. 2021 Aug;3(8):1042-1057.
doi: 10.1038/s42255-021-00439-y. Epub 2021 Aug 20.

Neonatal exposure to a wild-derived microbiome protects mice against diet-induced obesity

Affiliations

Neonatal exposure to a wild-derived microbiome protects mice against diet-induced obesity

Benedikt Hild et al. Nat Metab. 2021 Aug.

Abstract

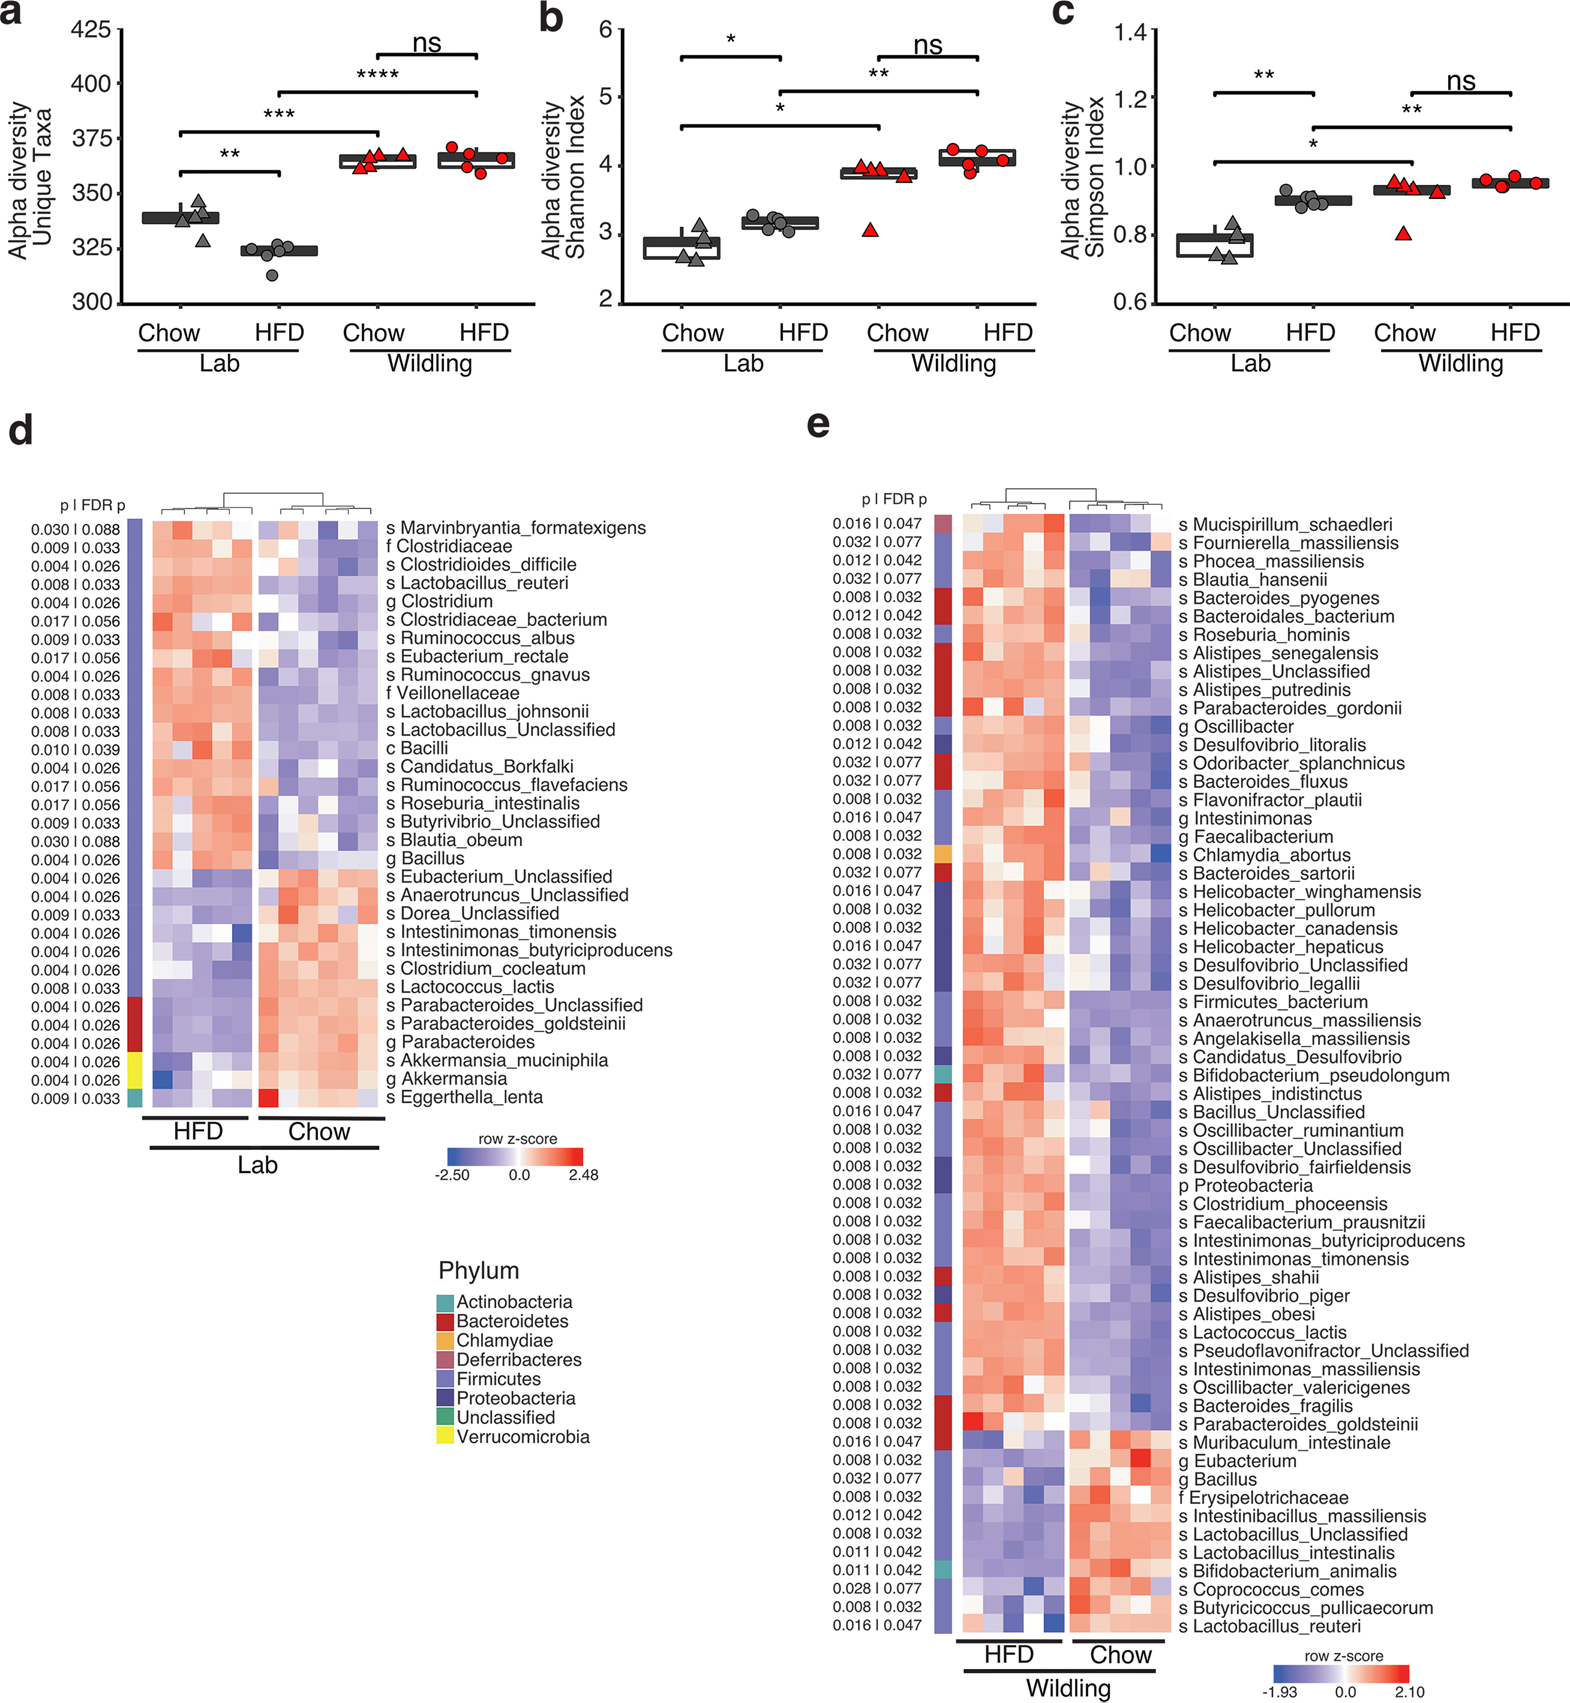
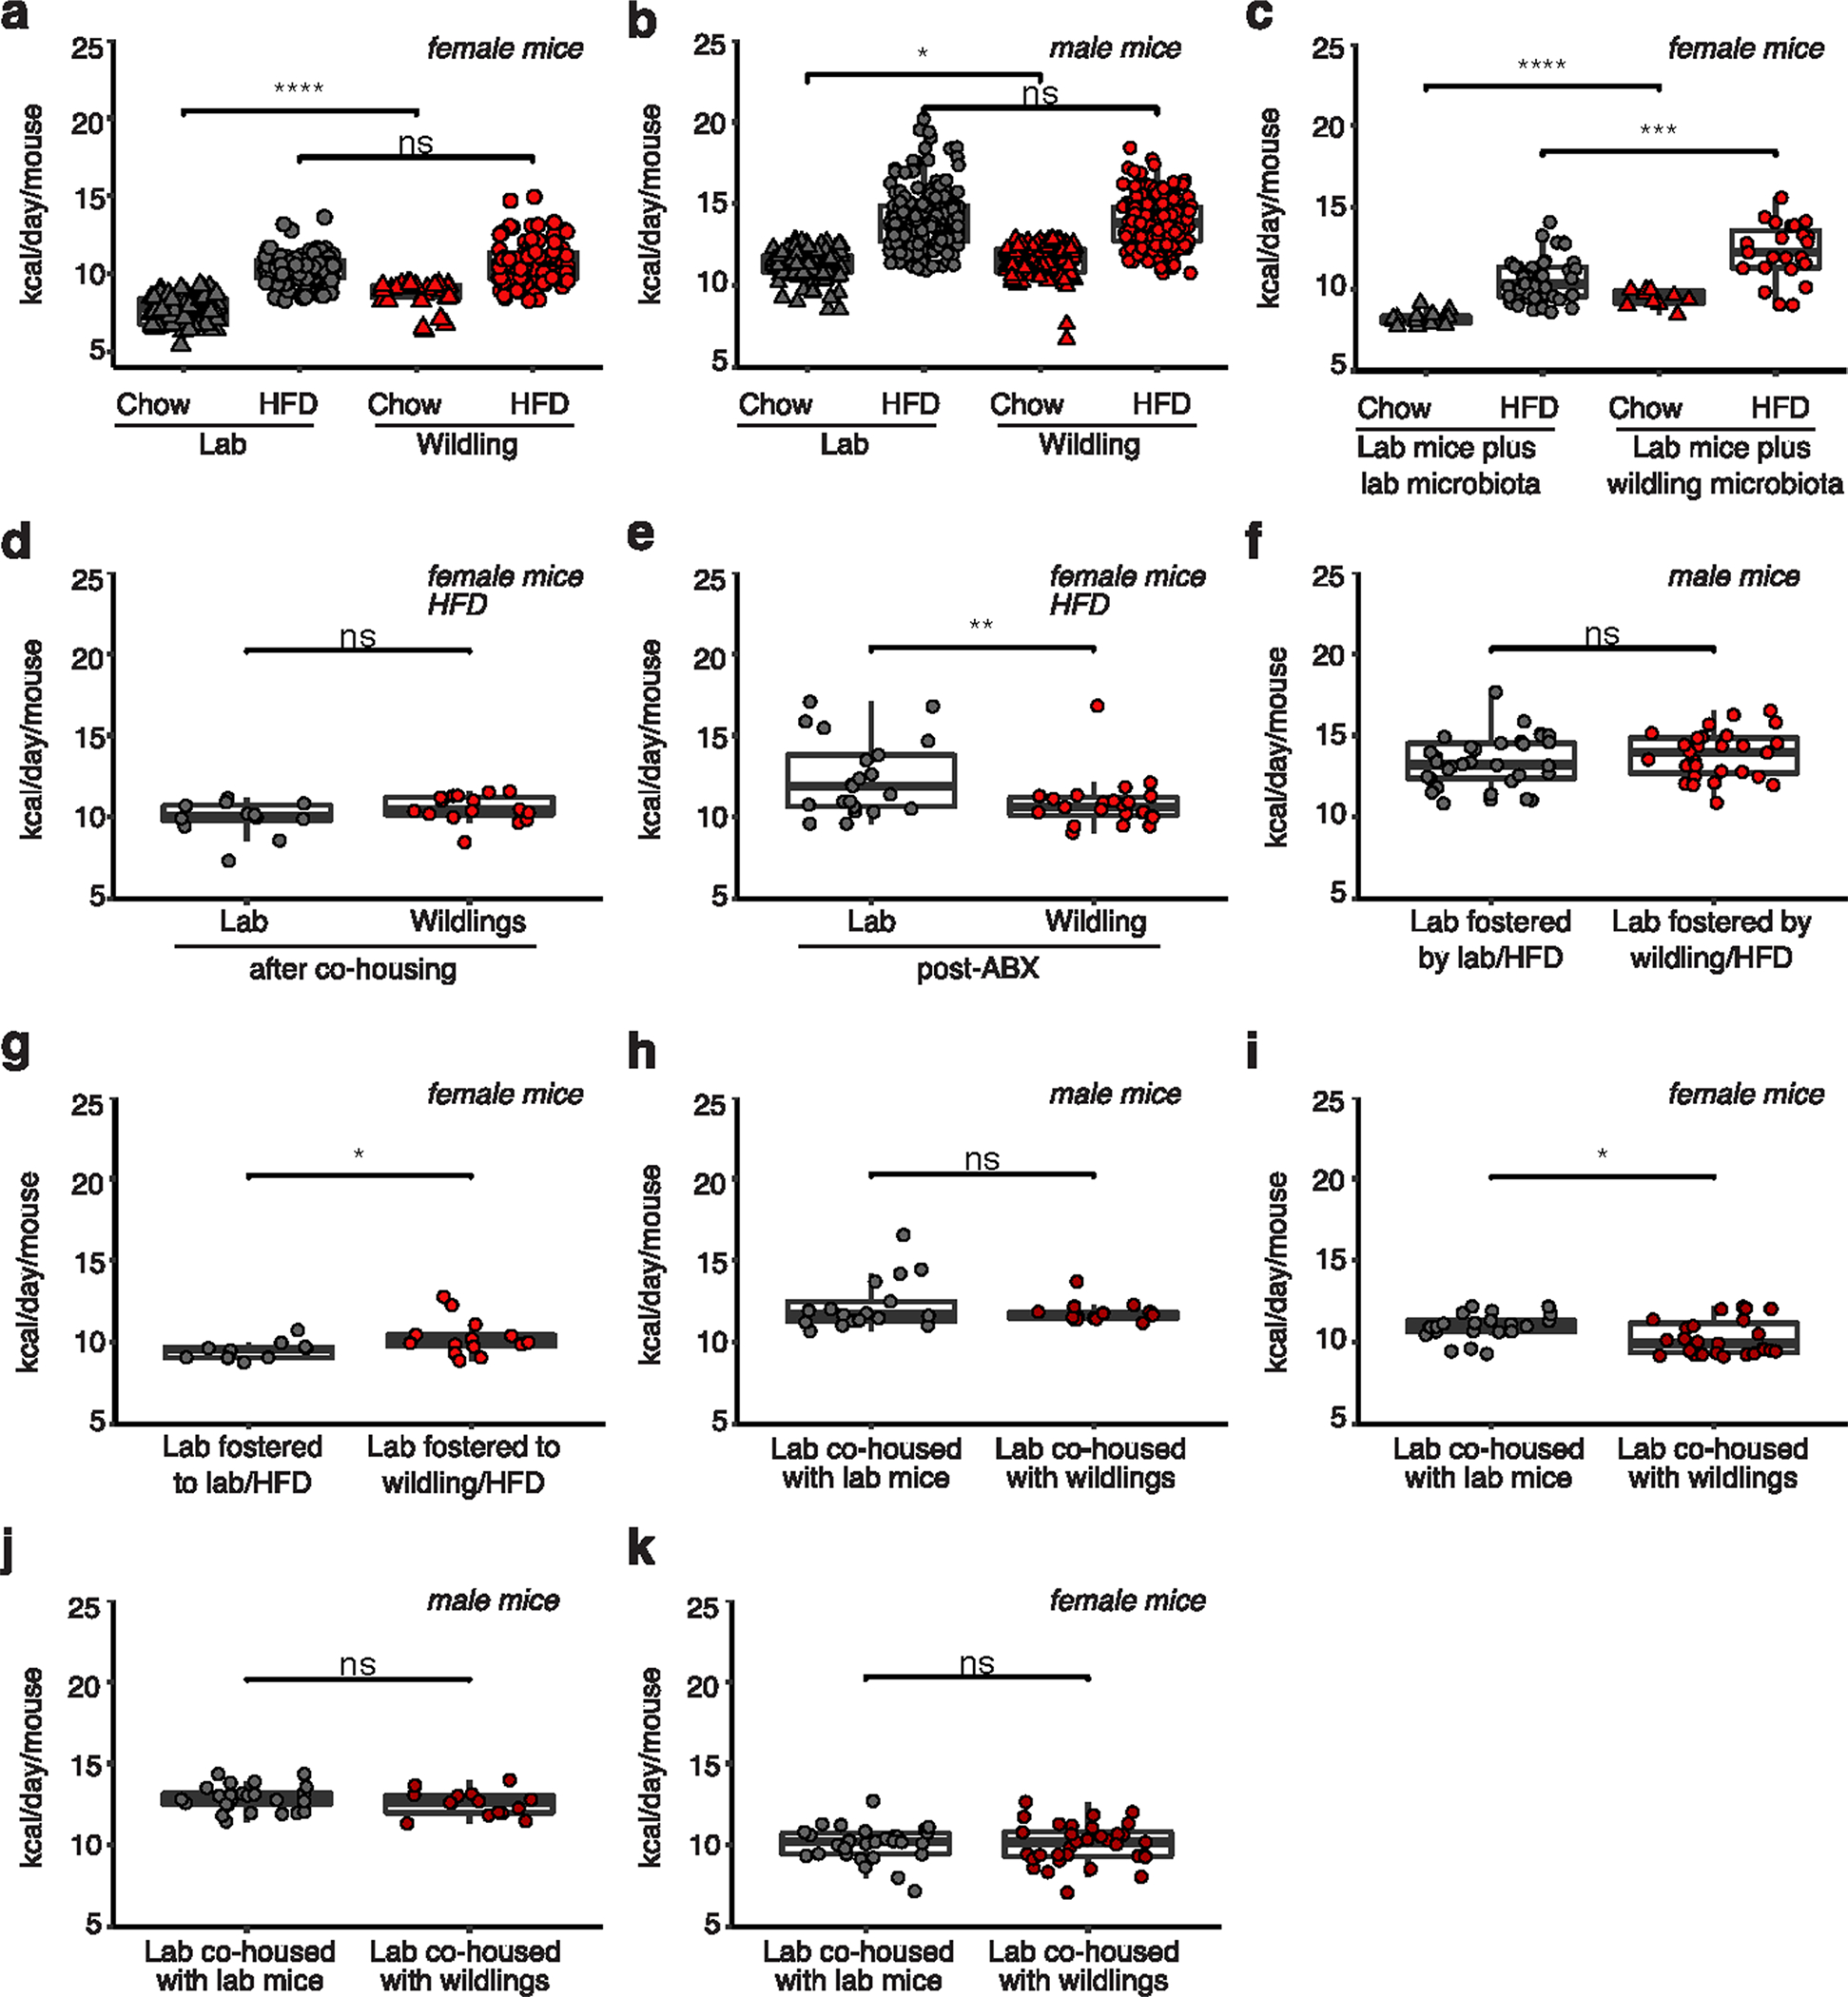
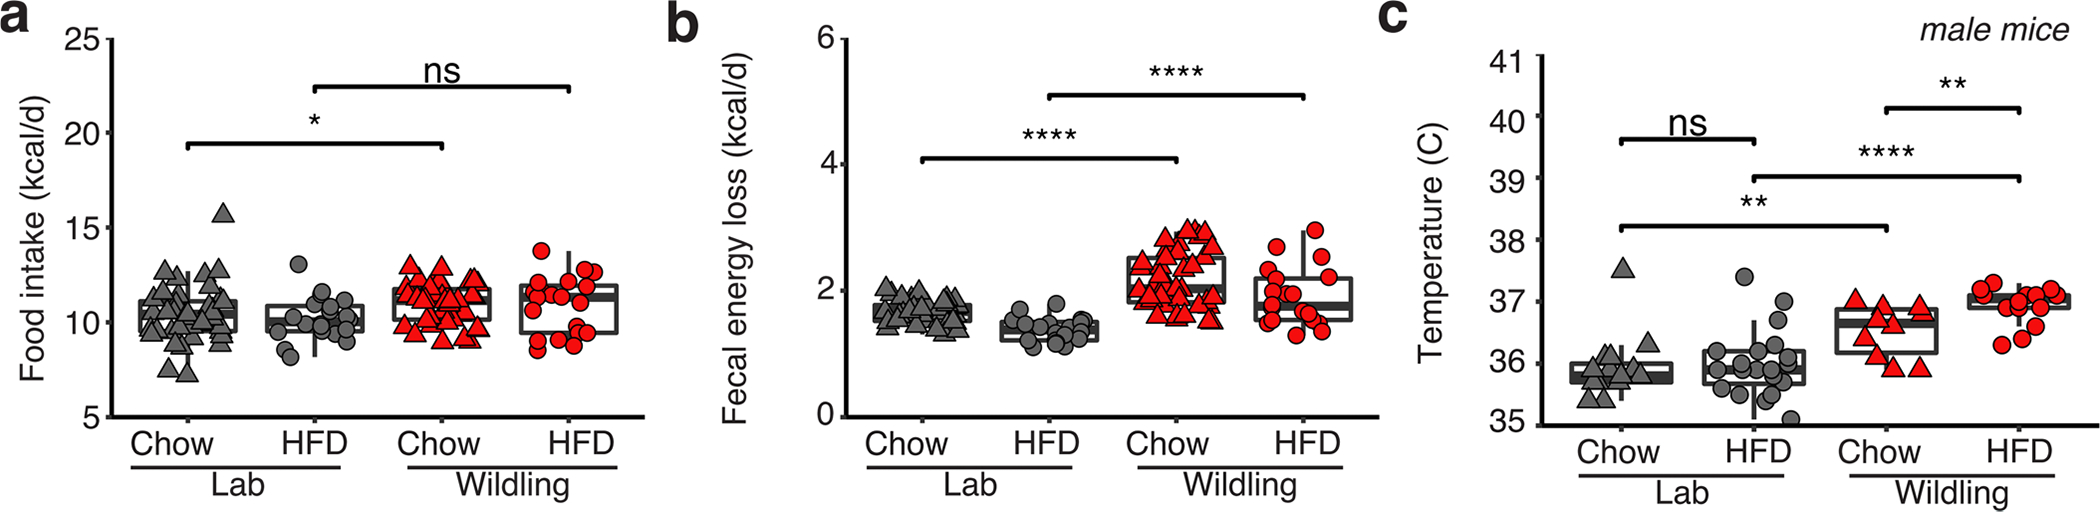
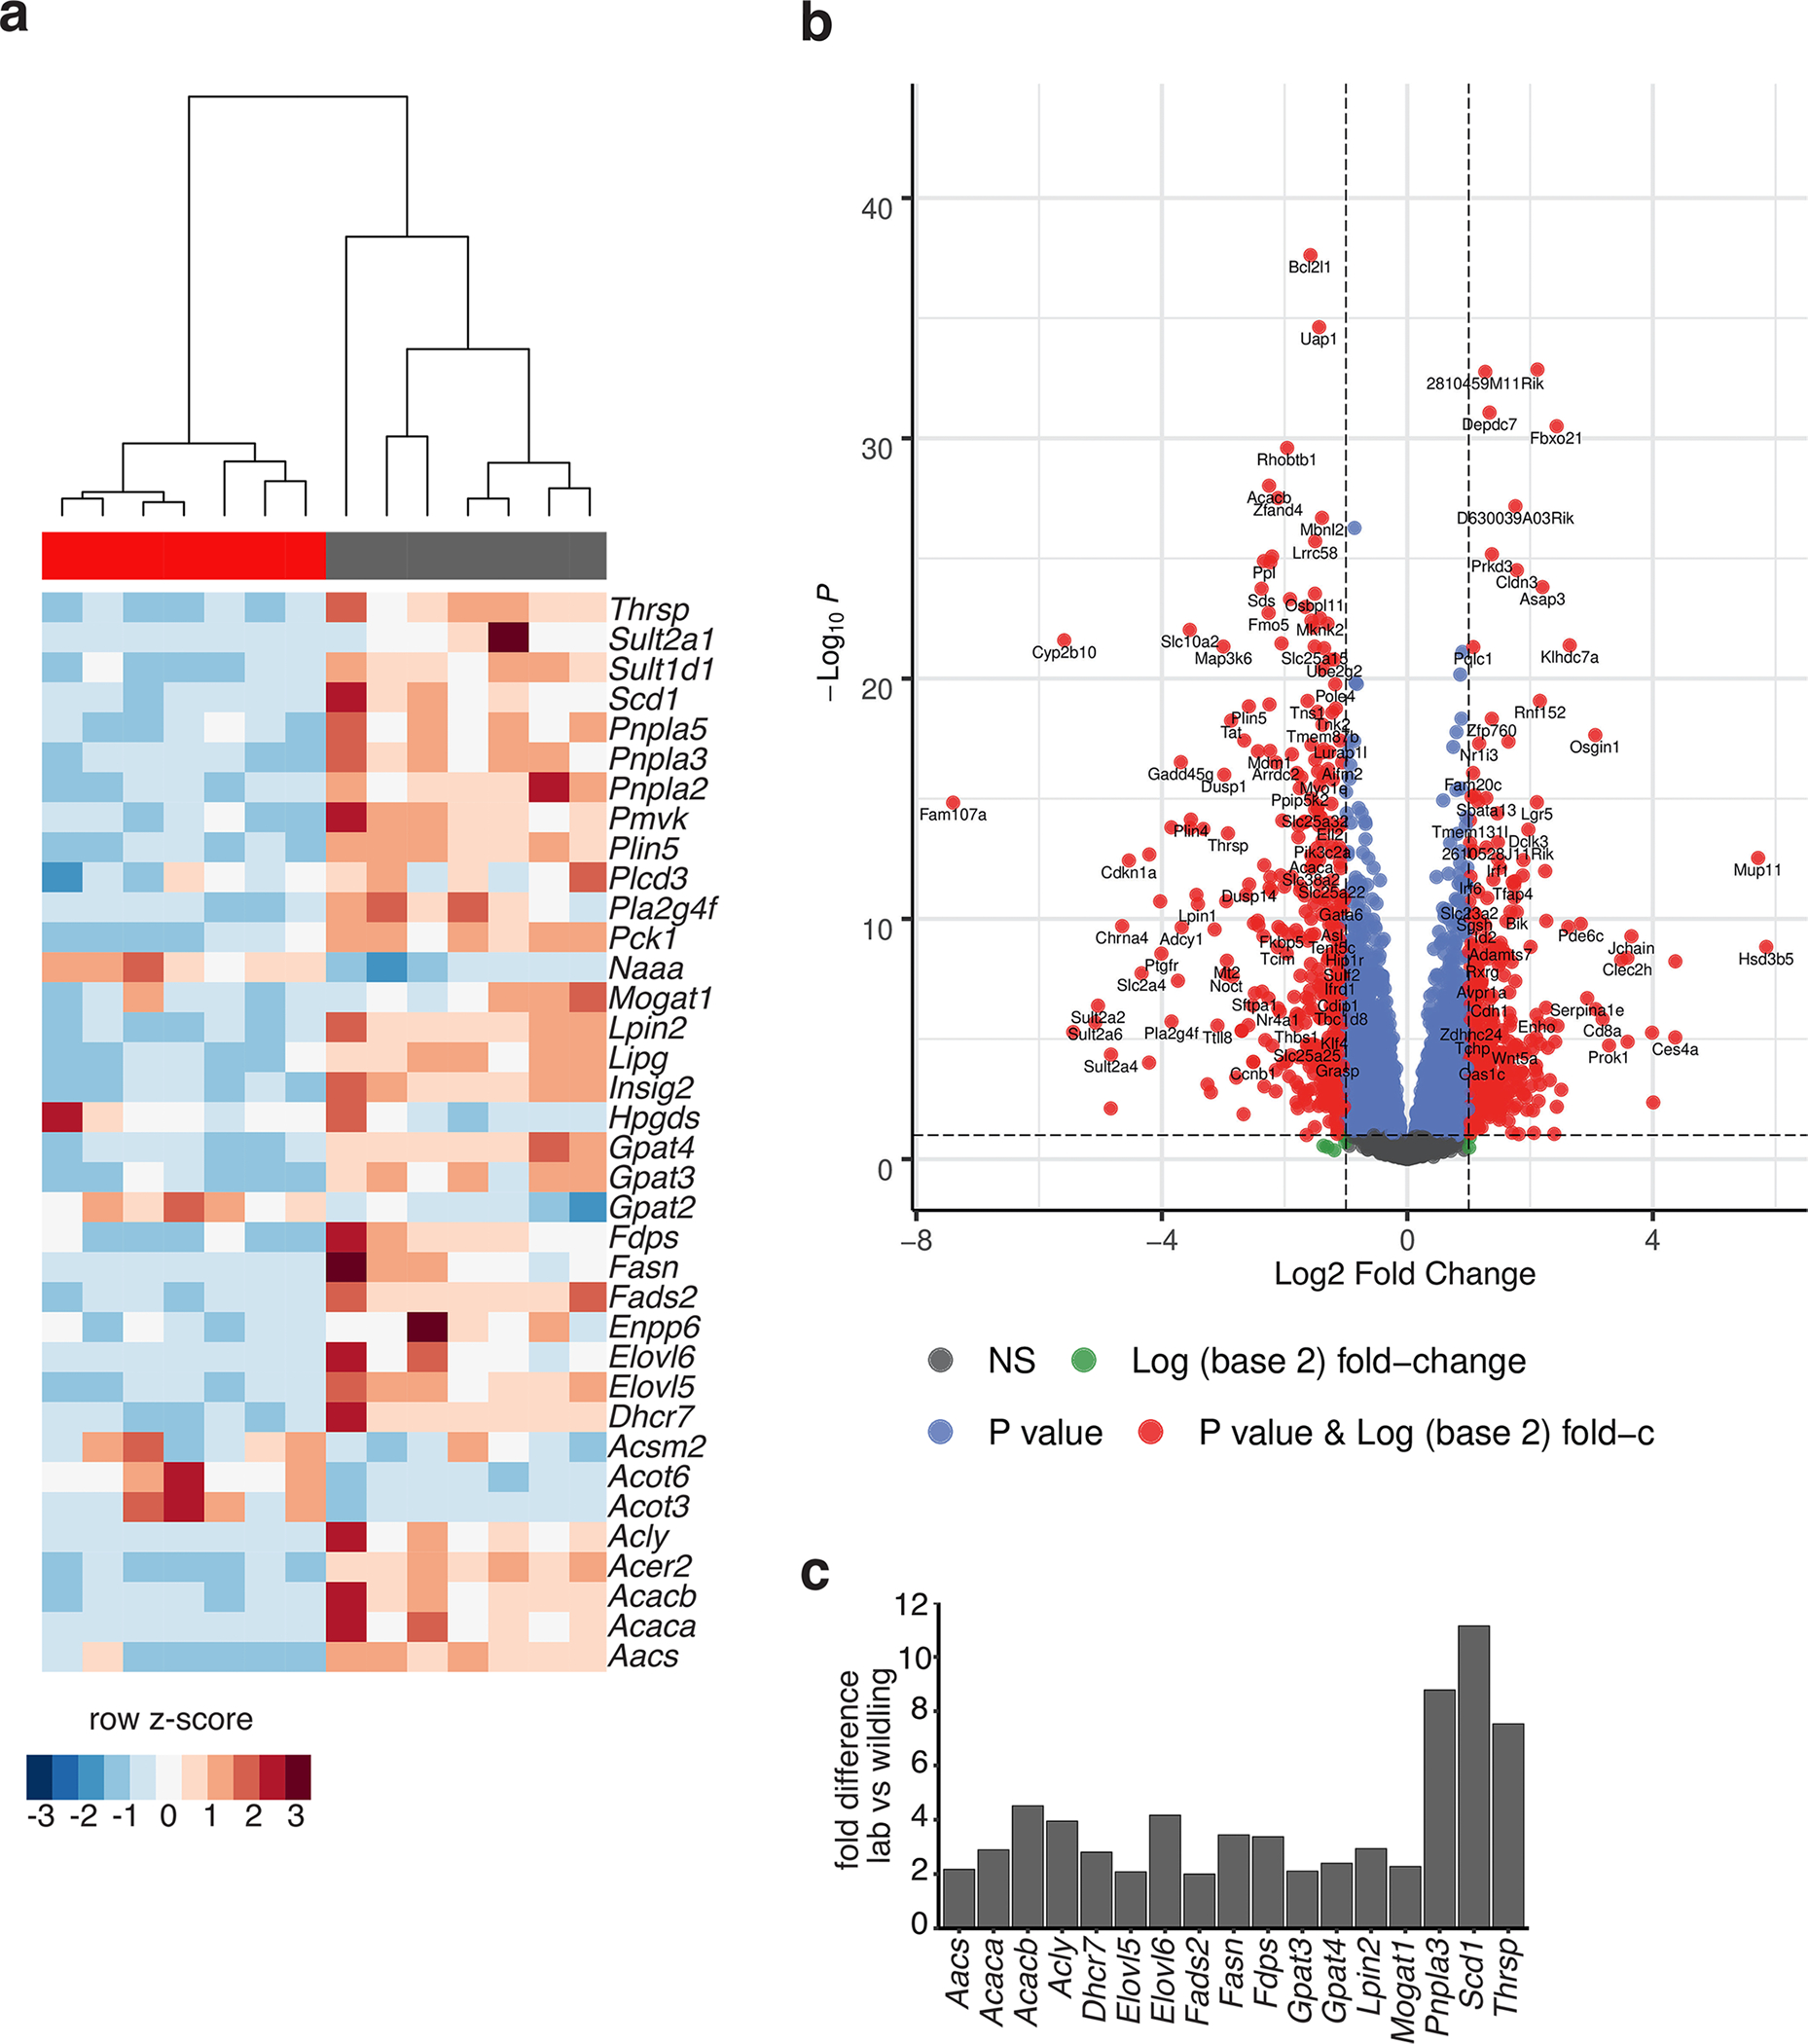
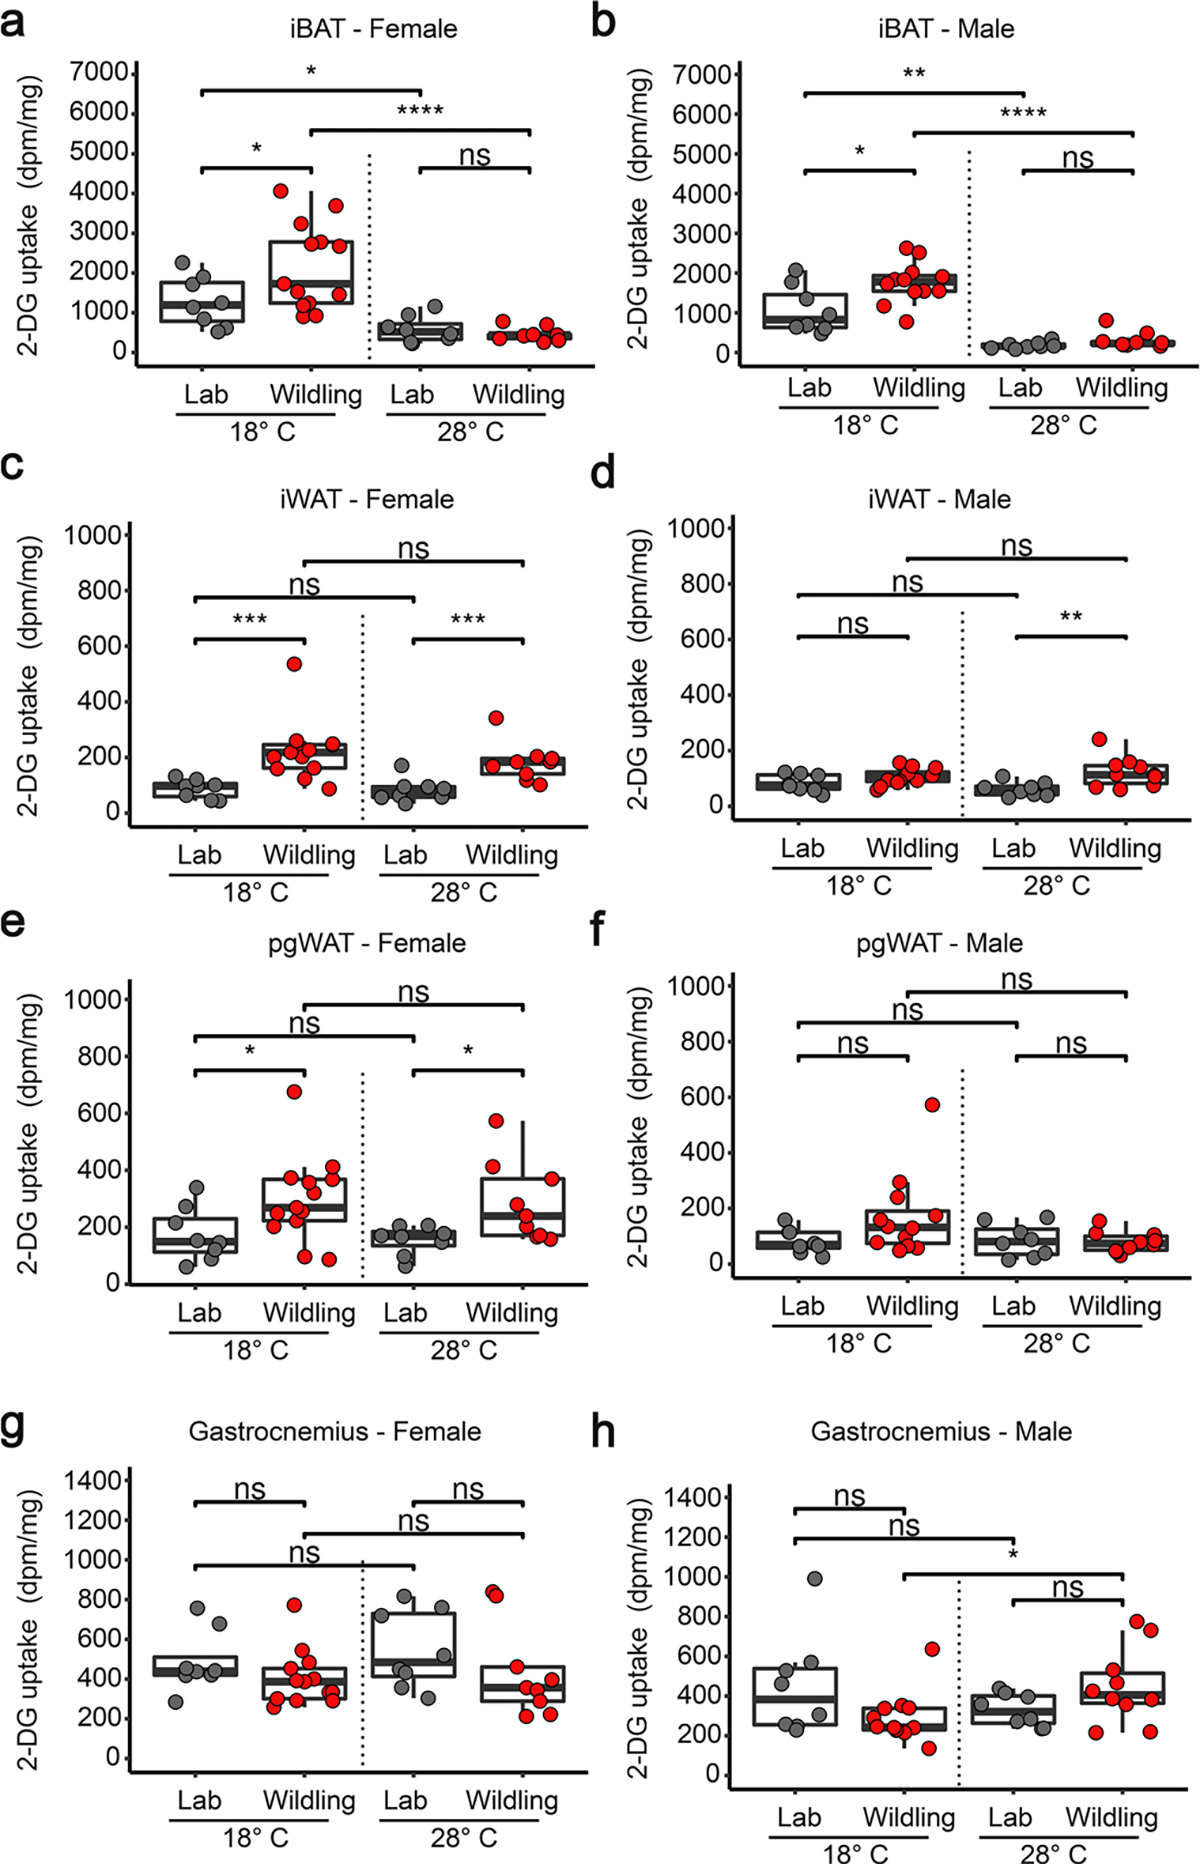
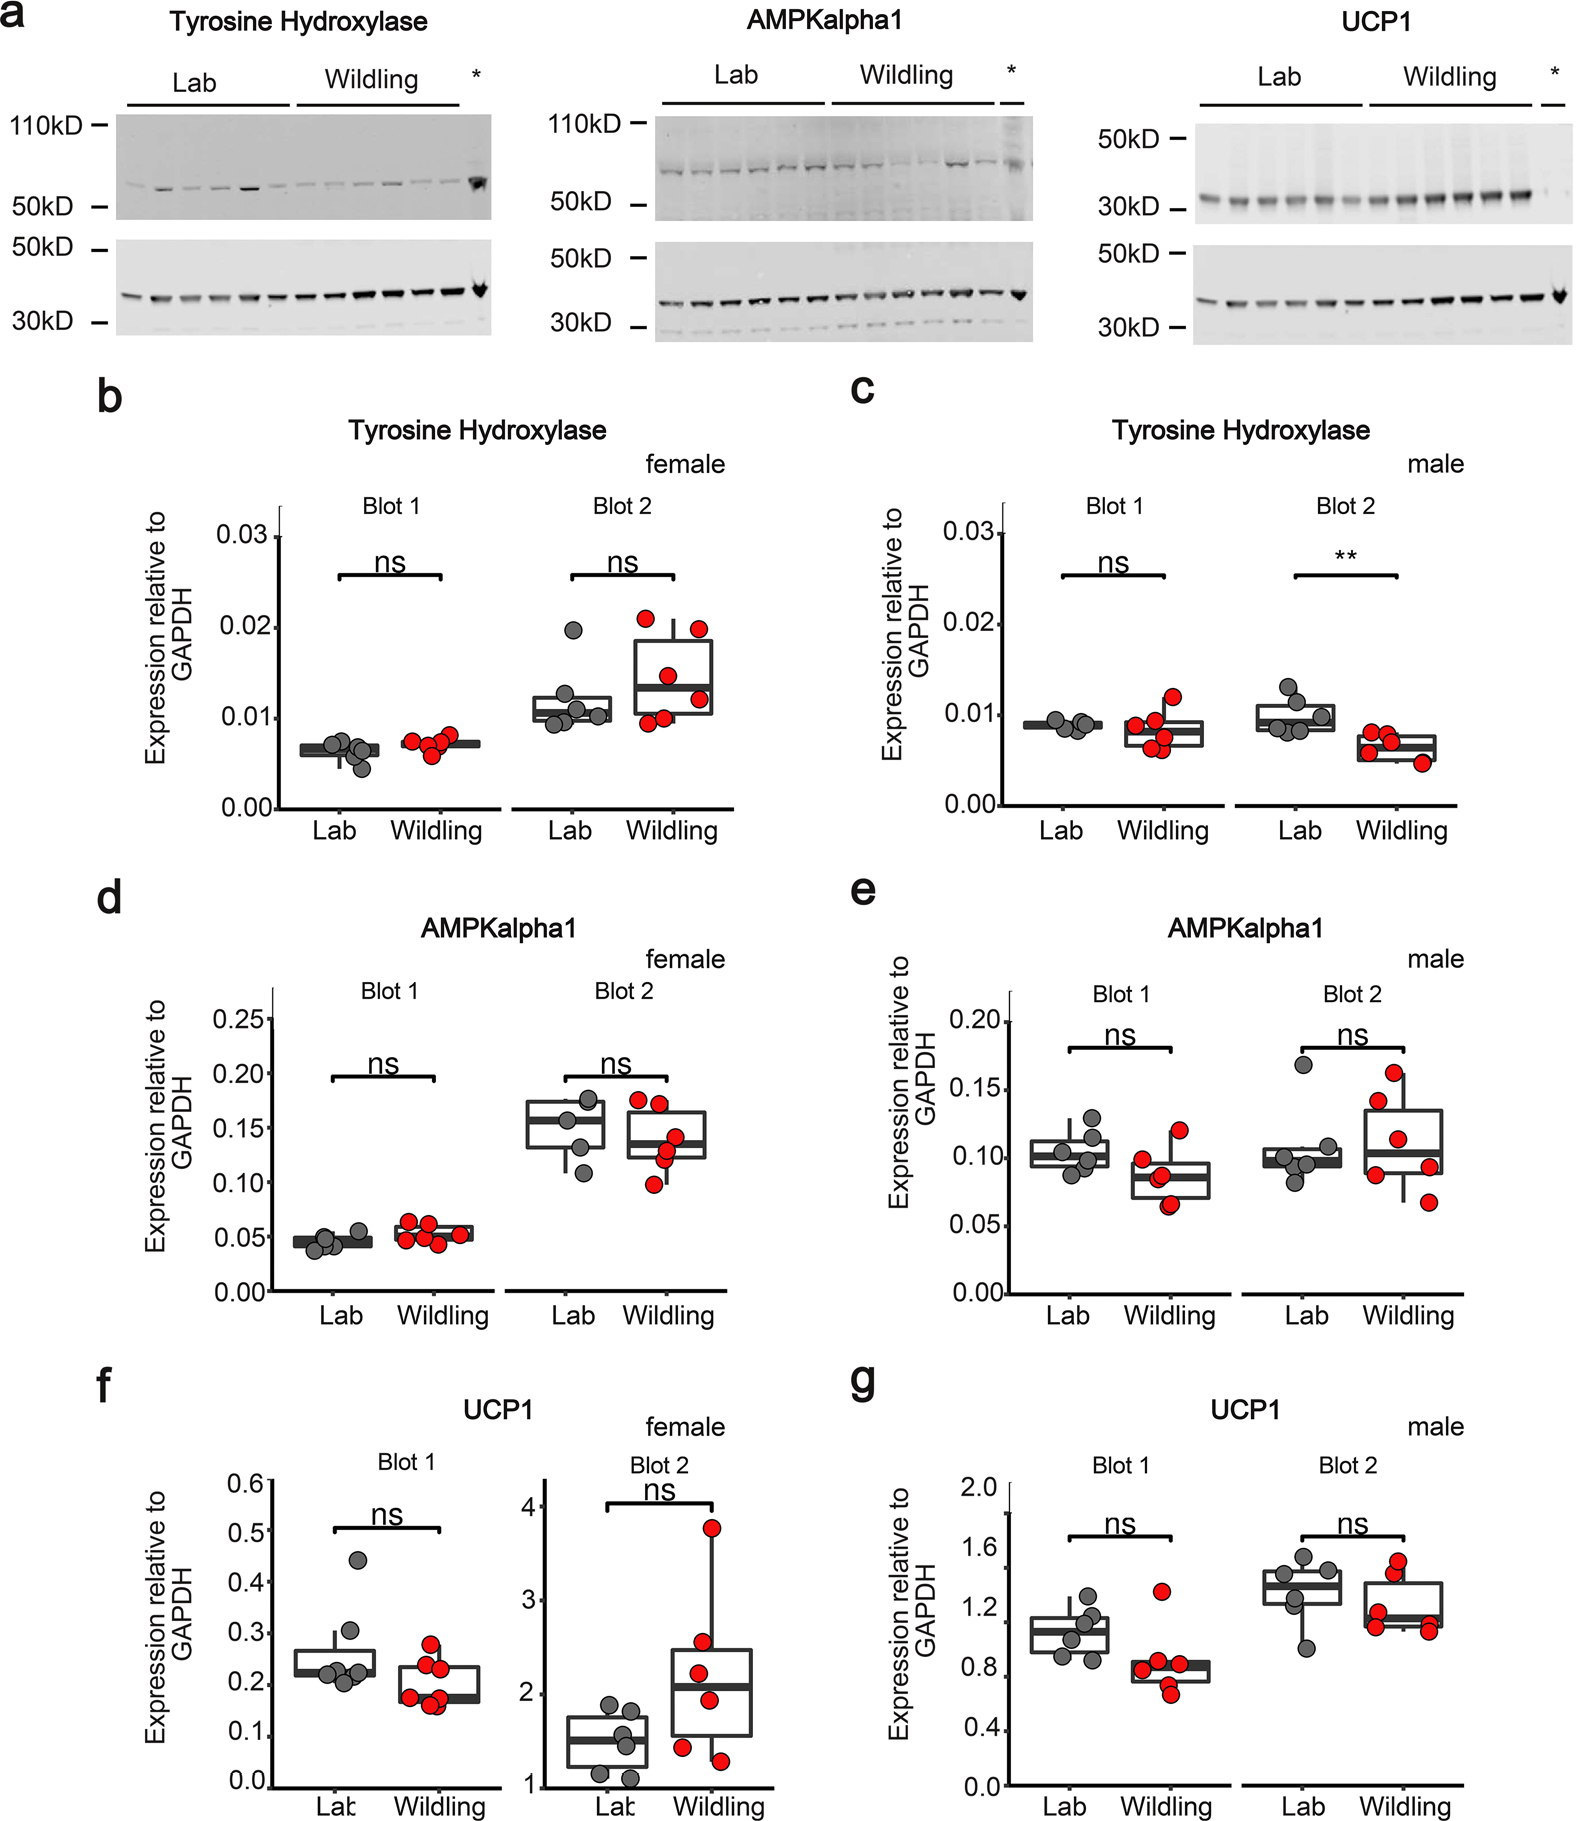
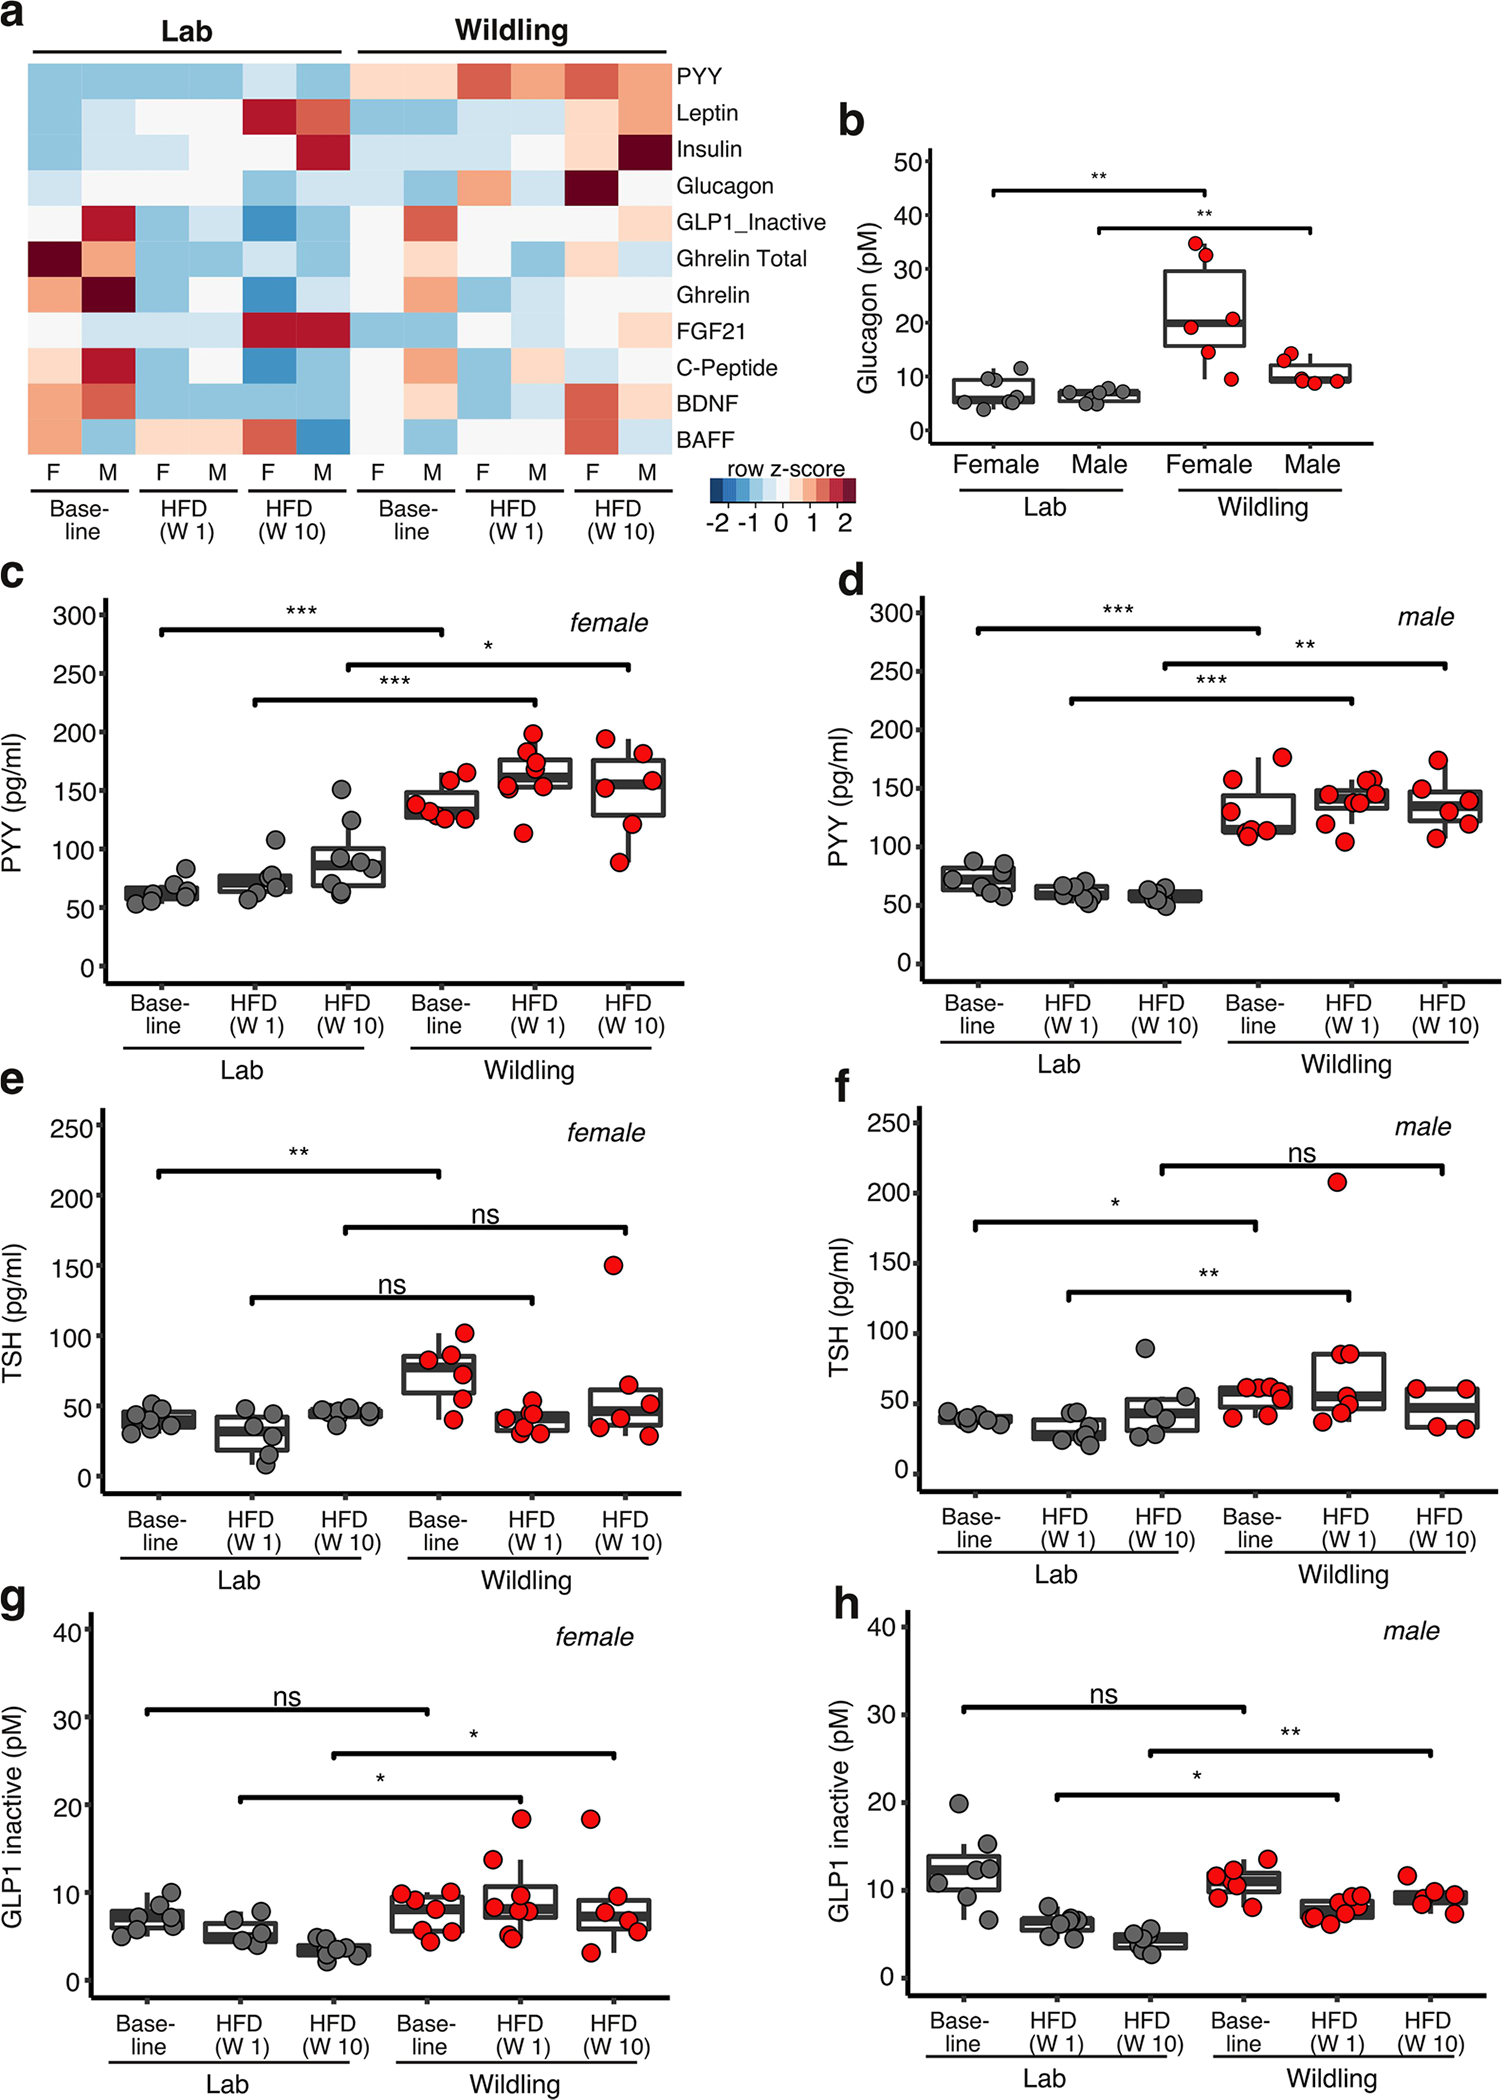
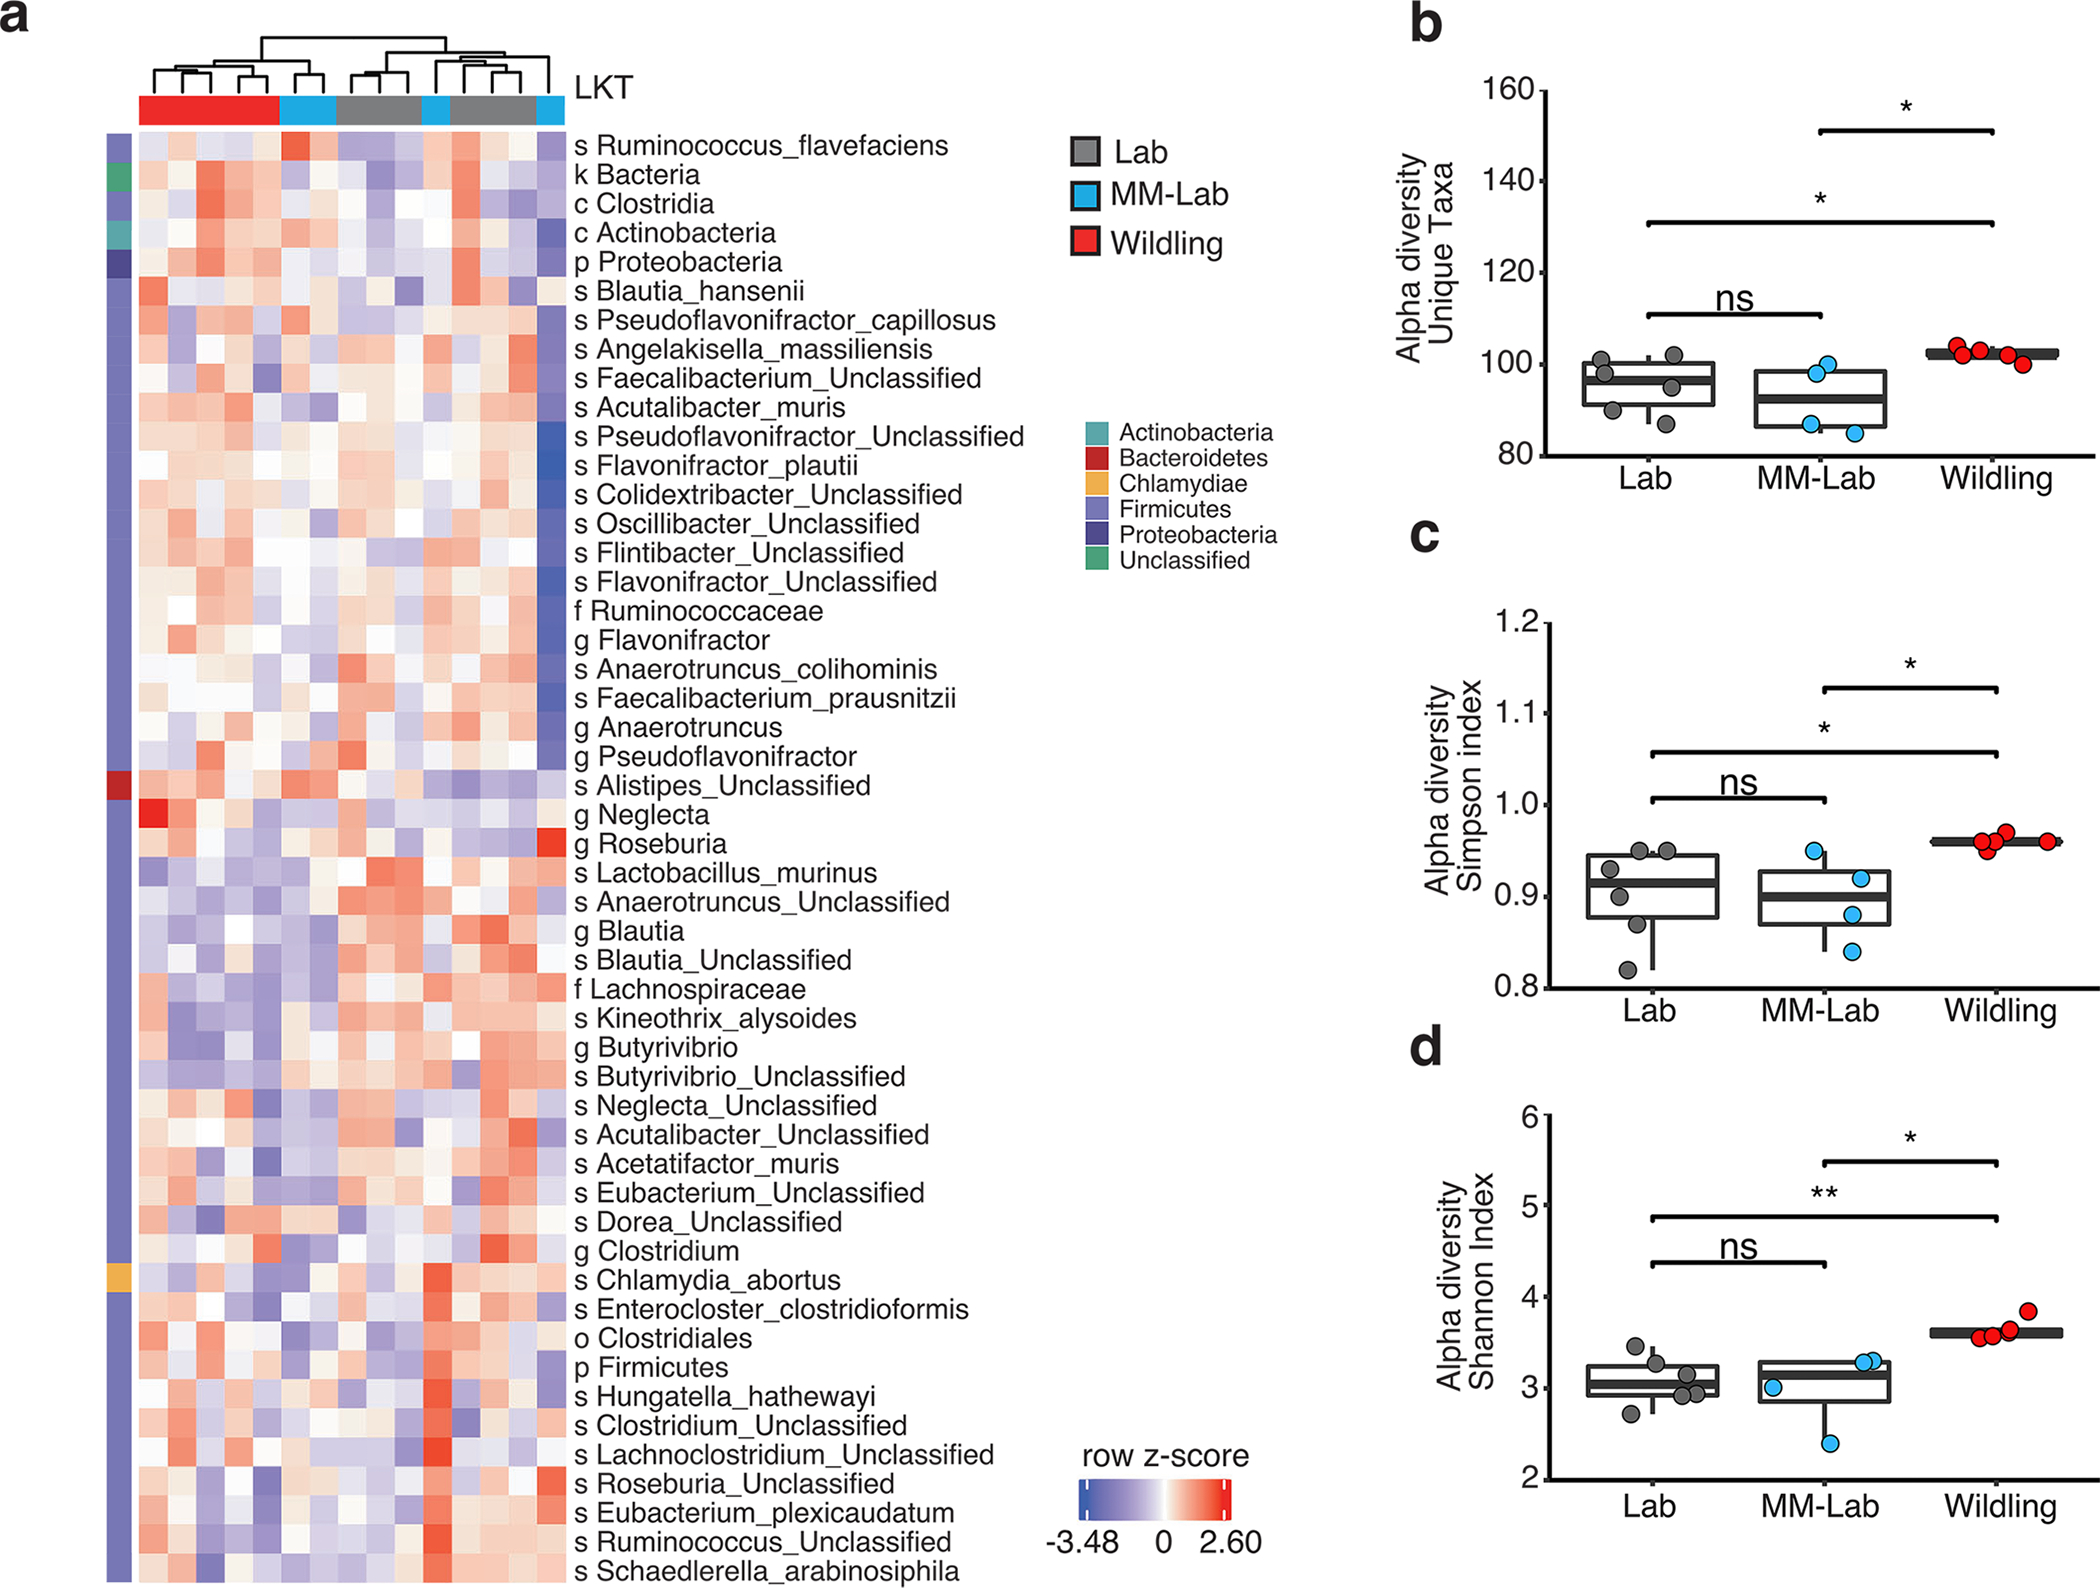
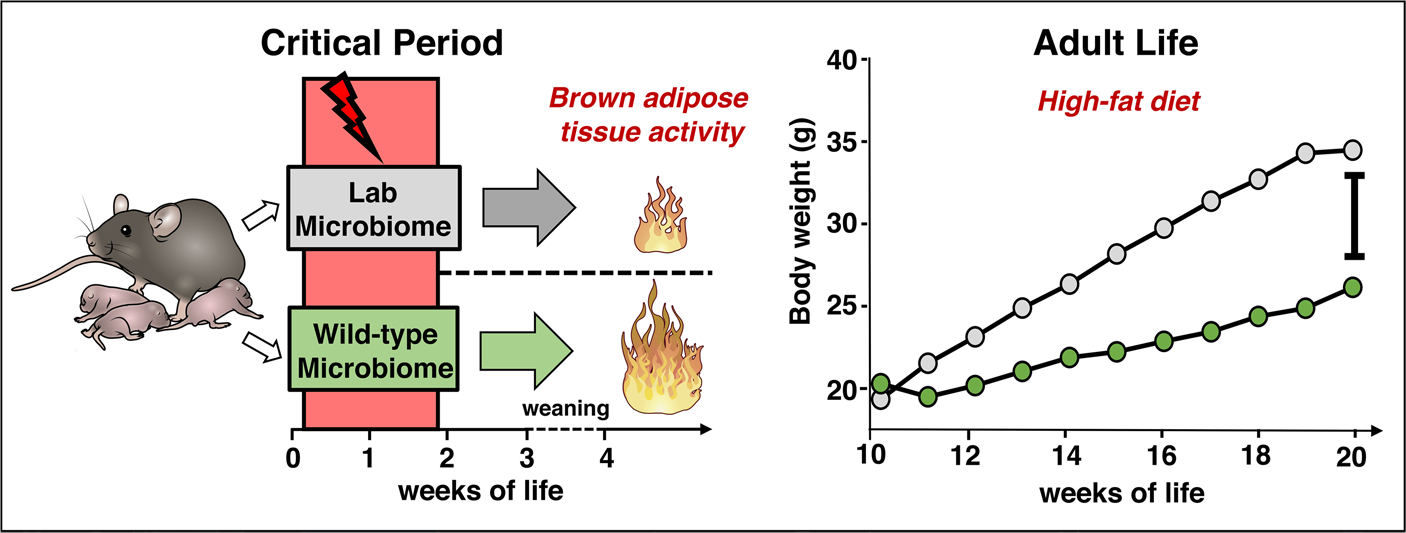
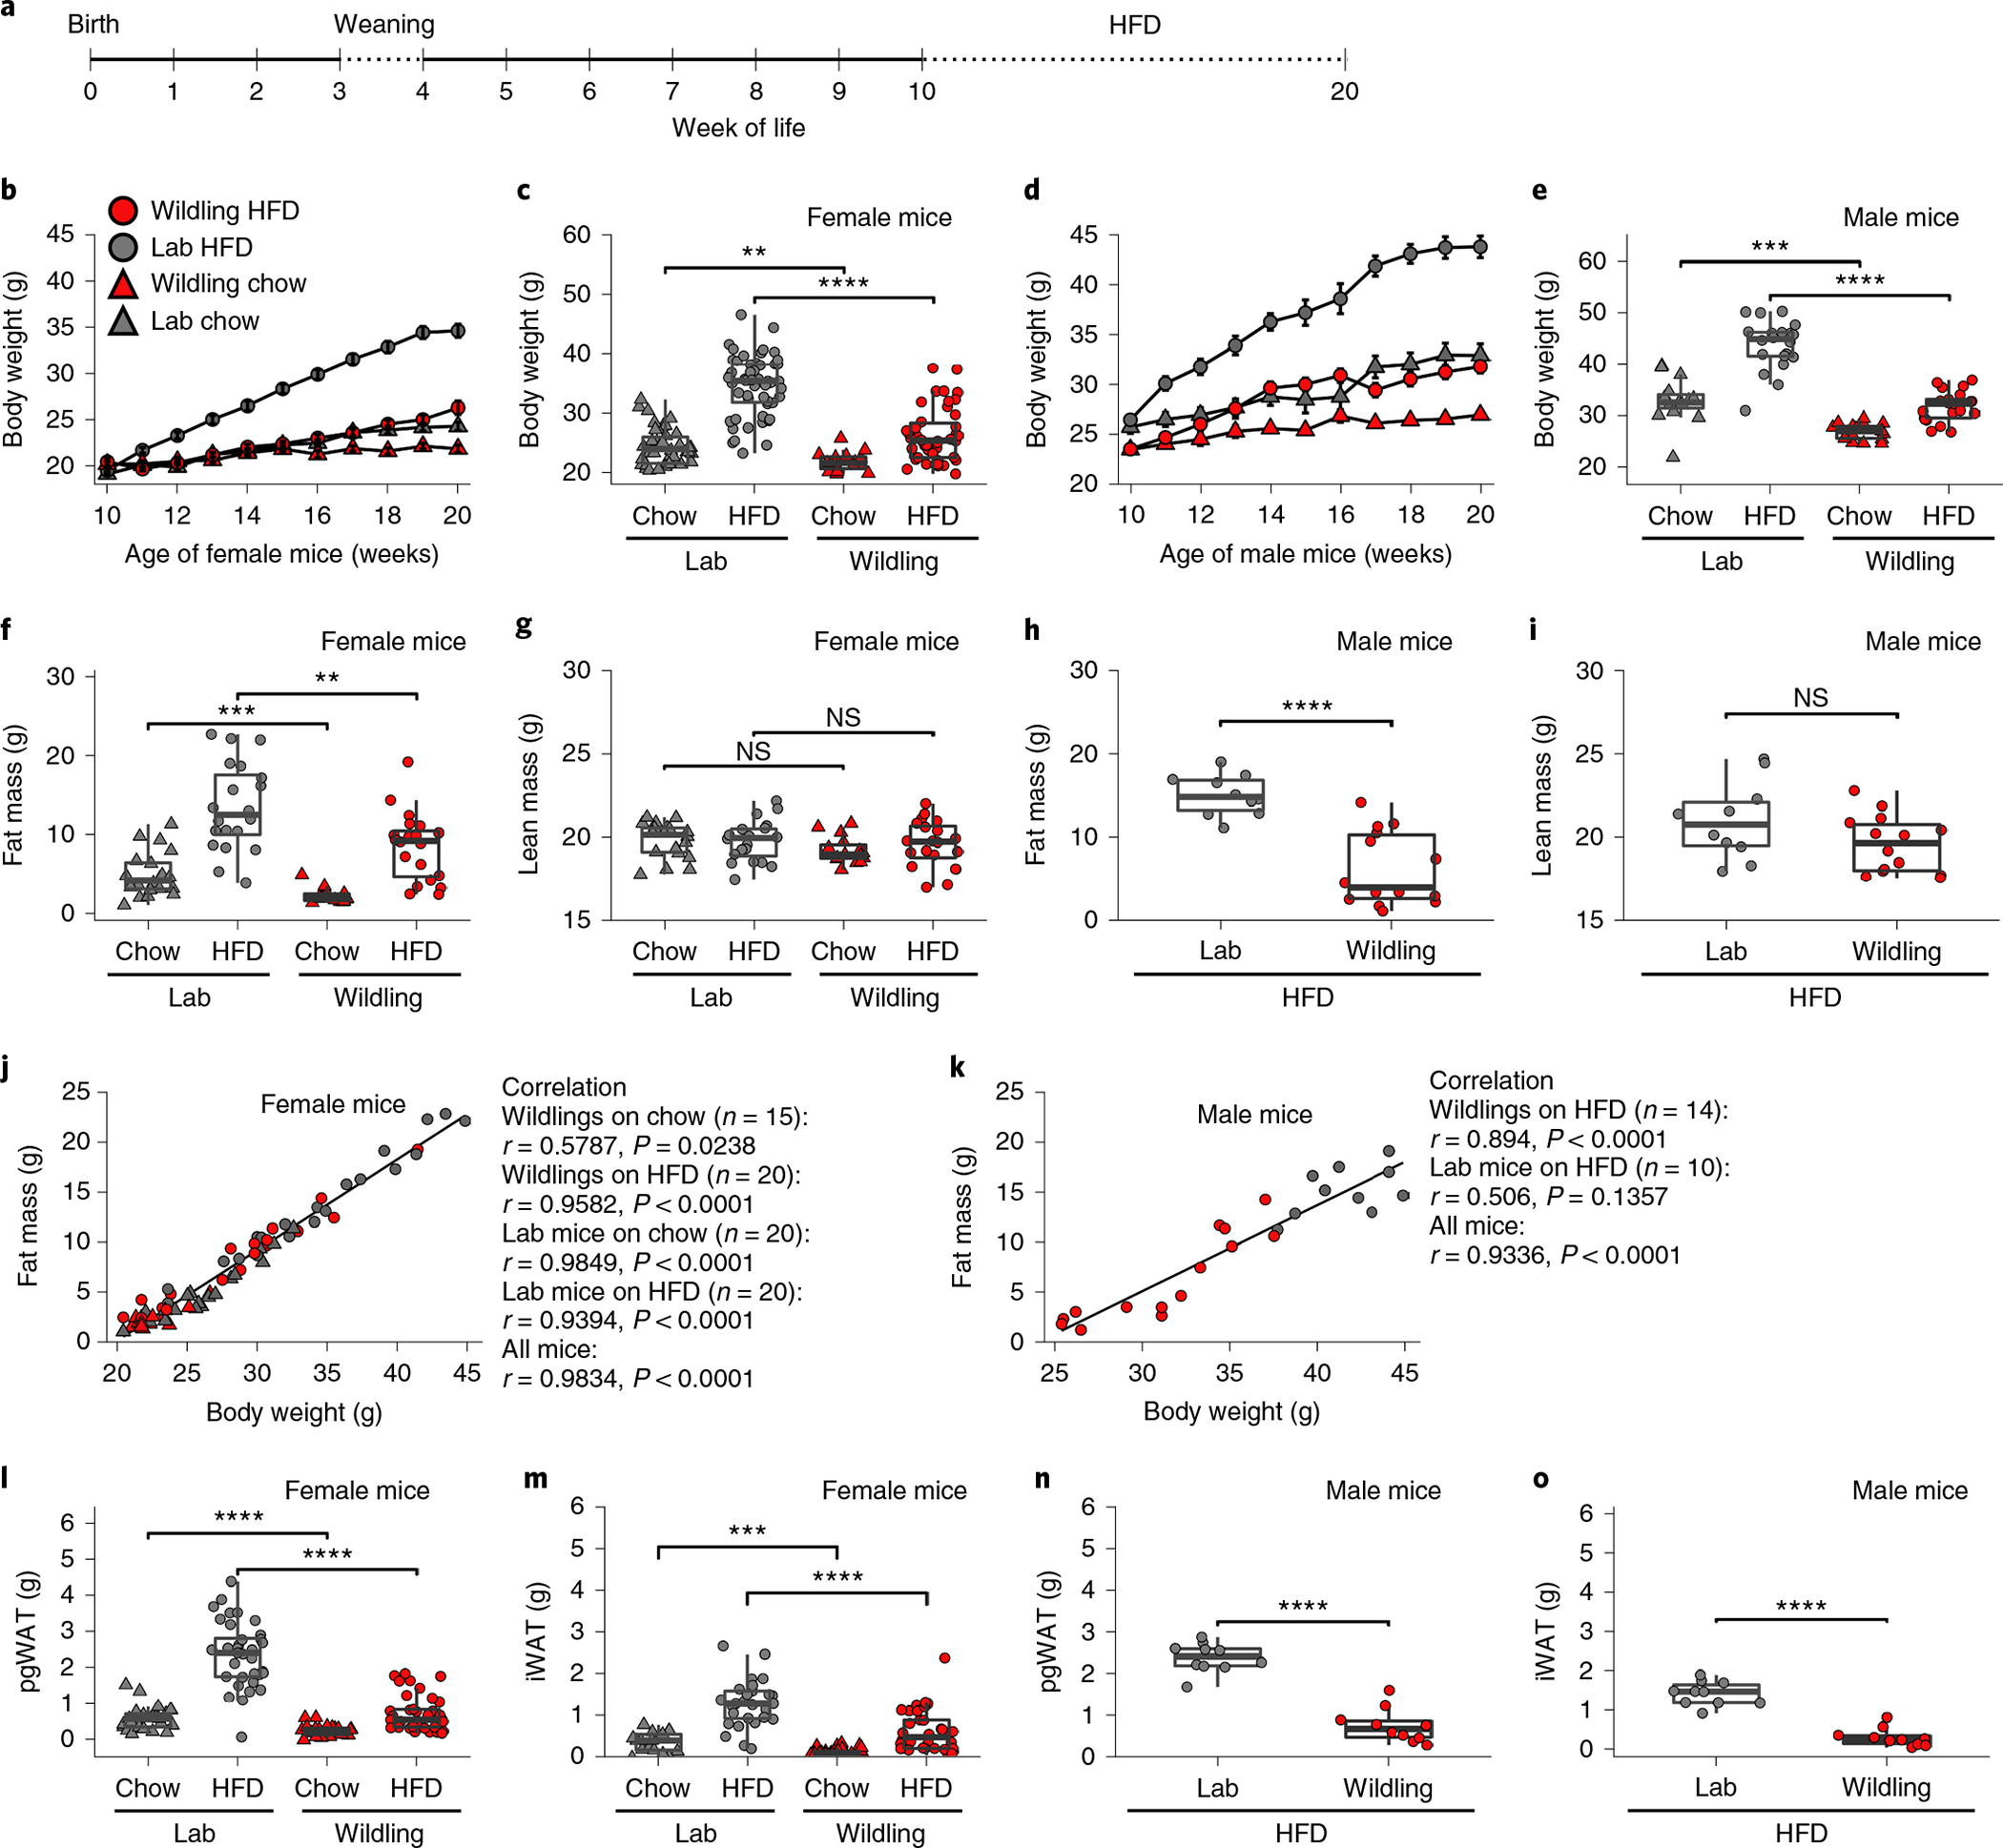
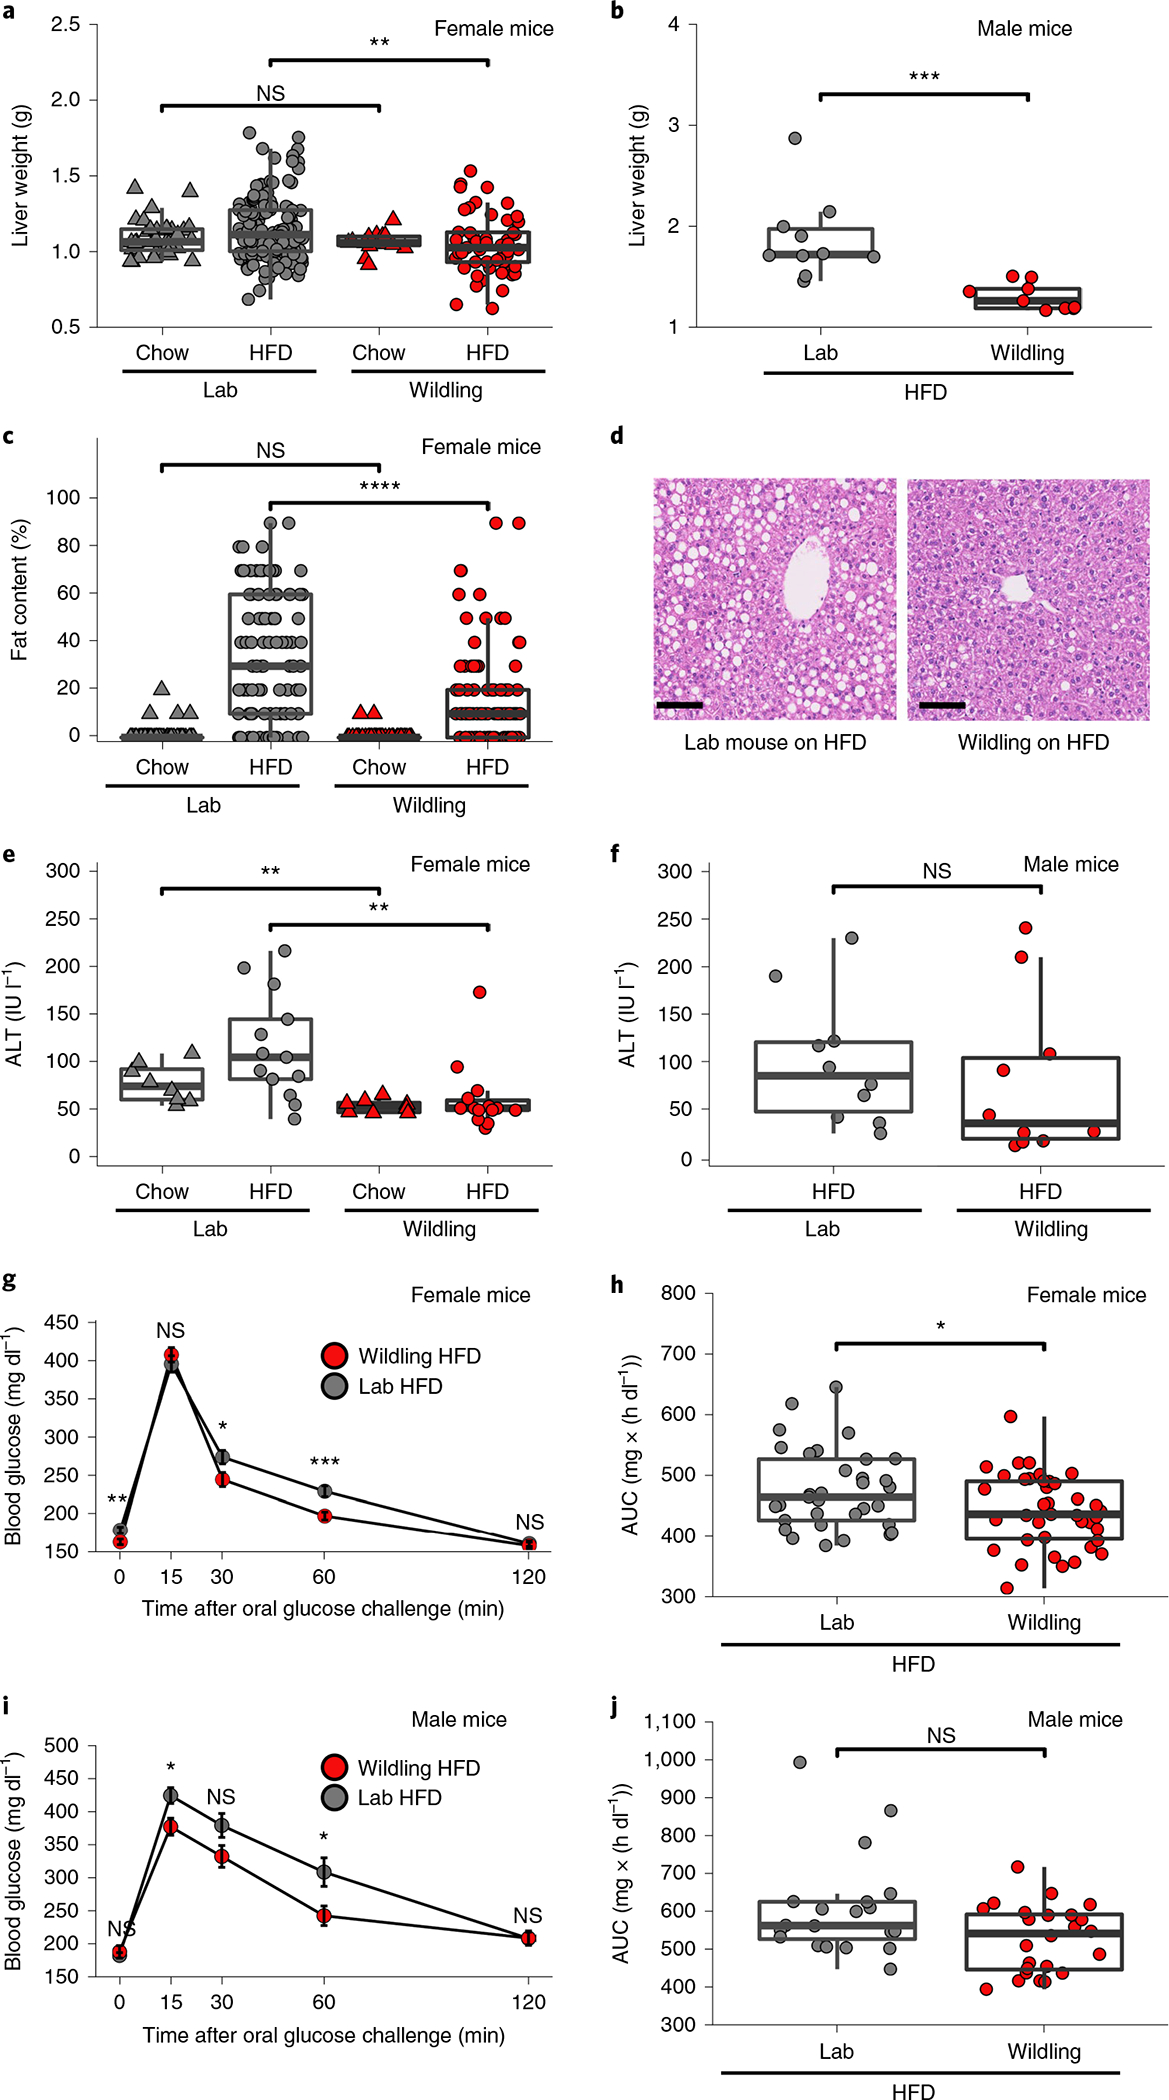
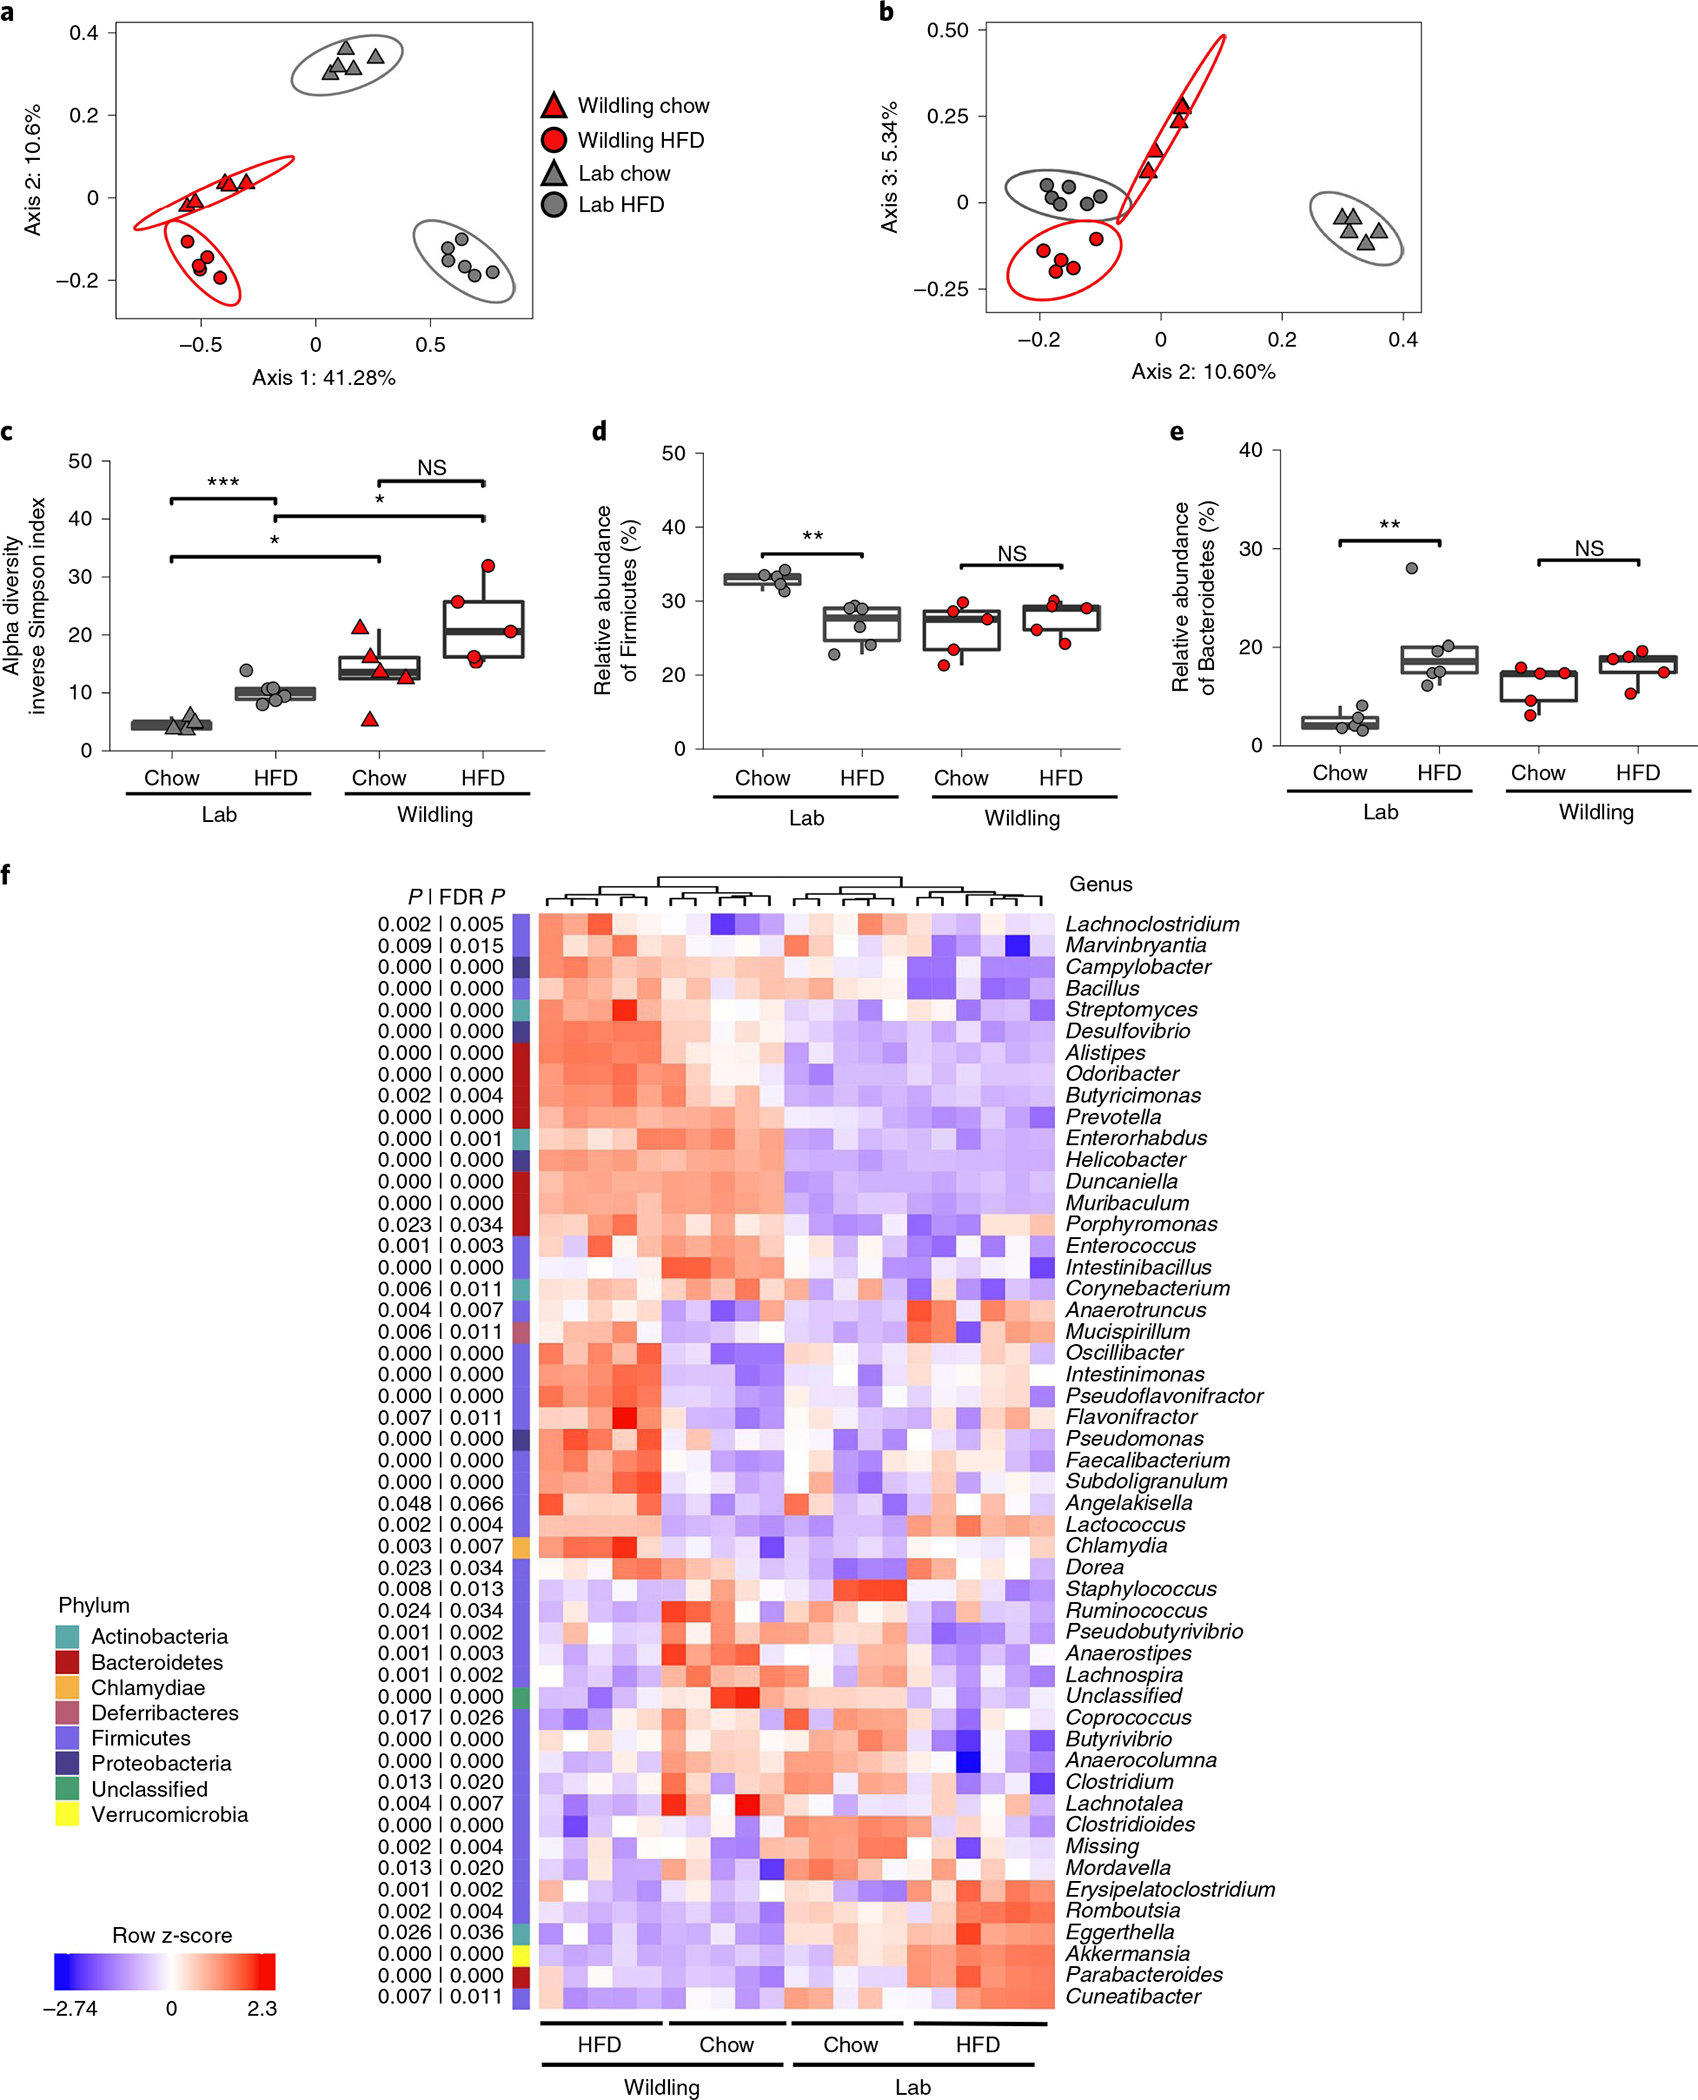
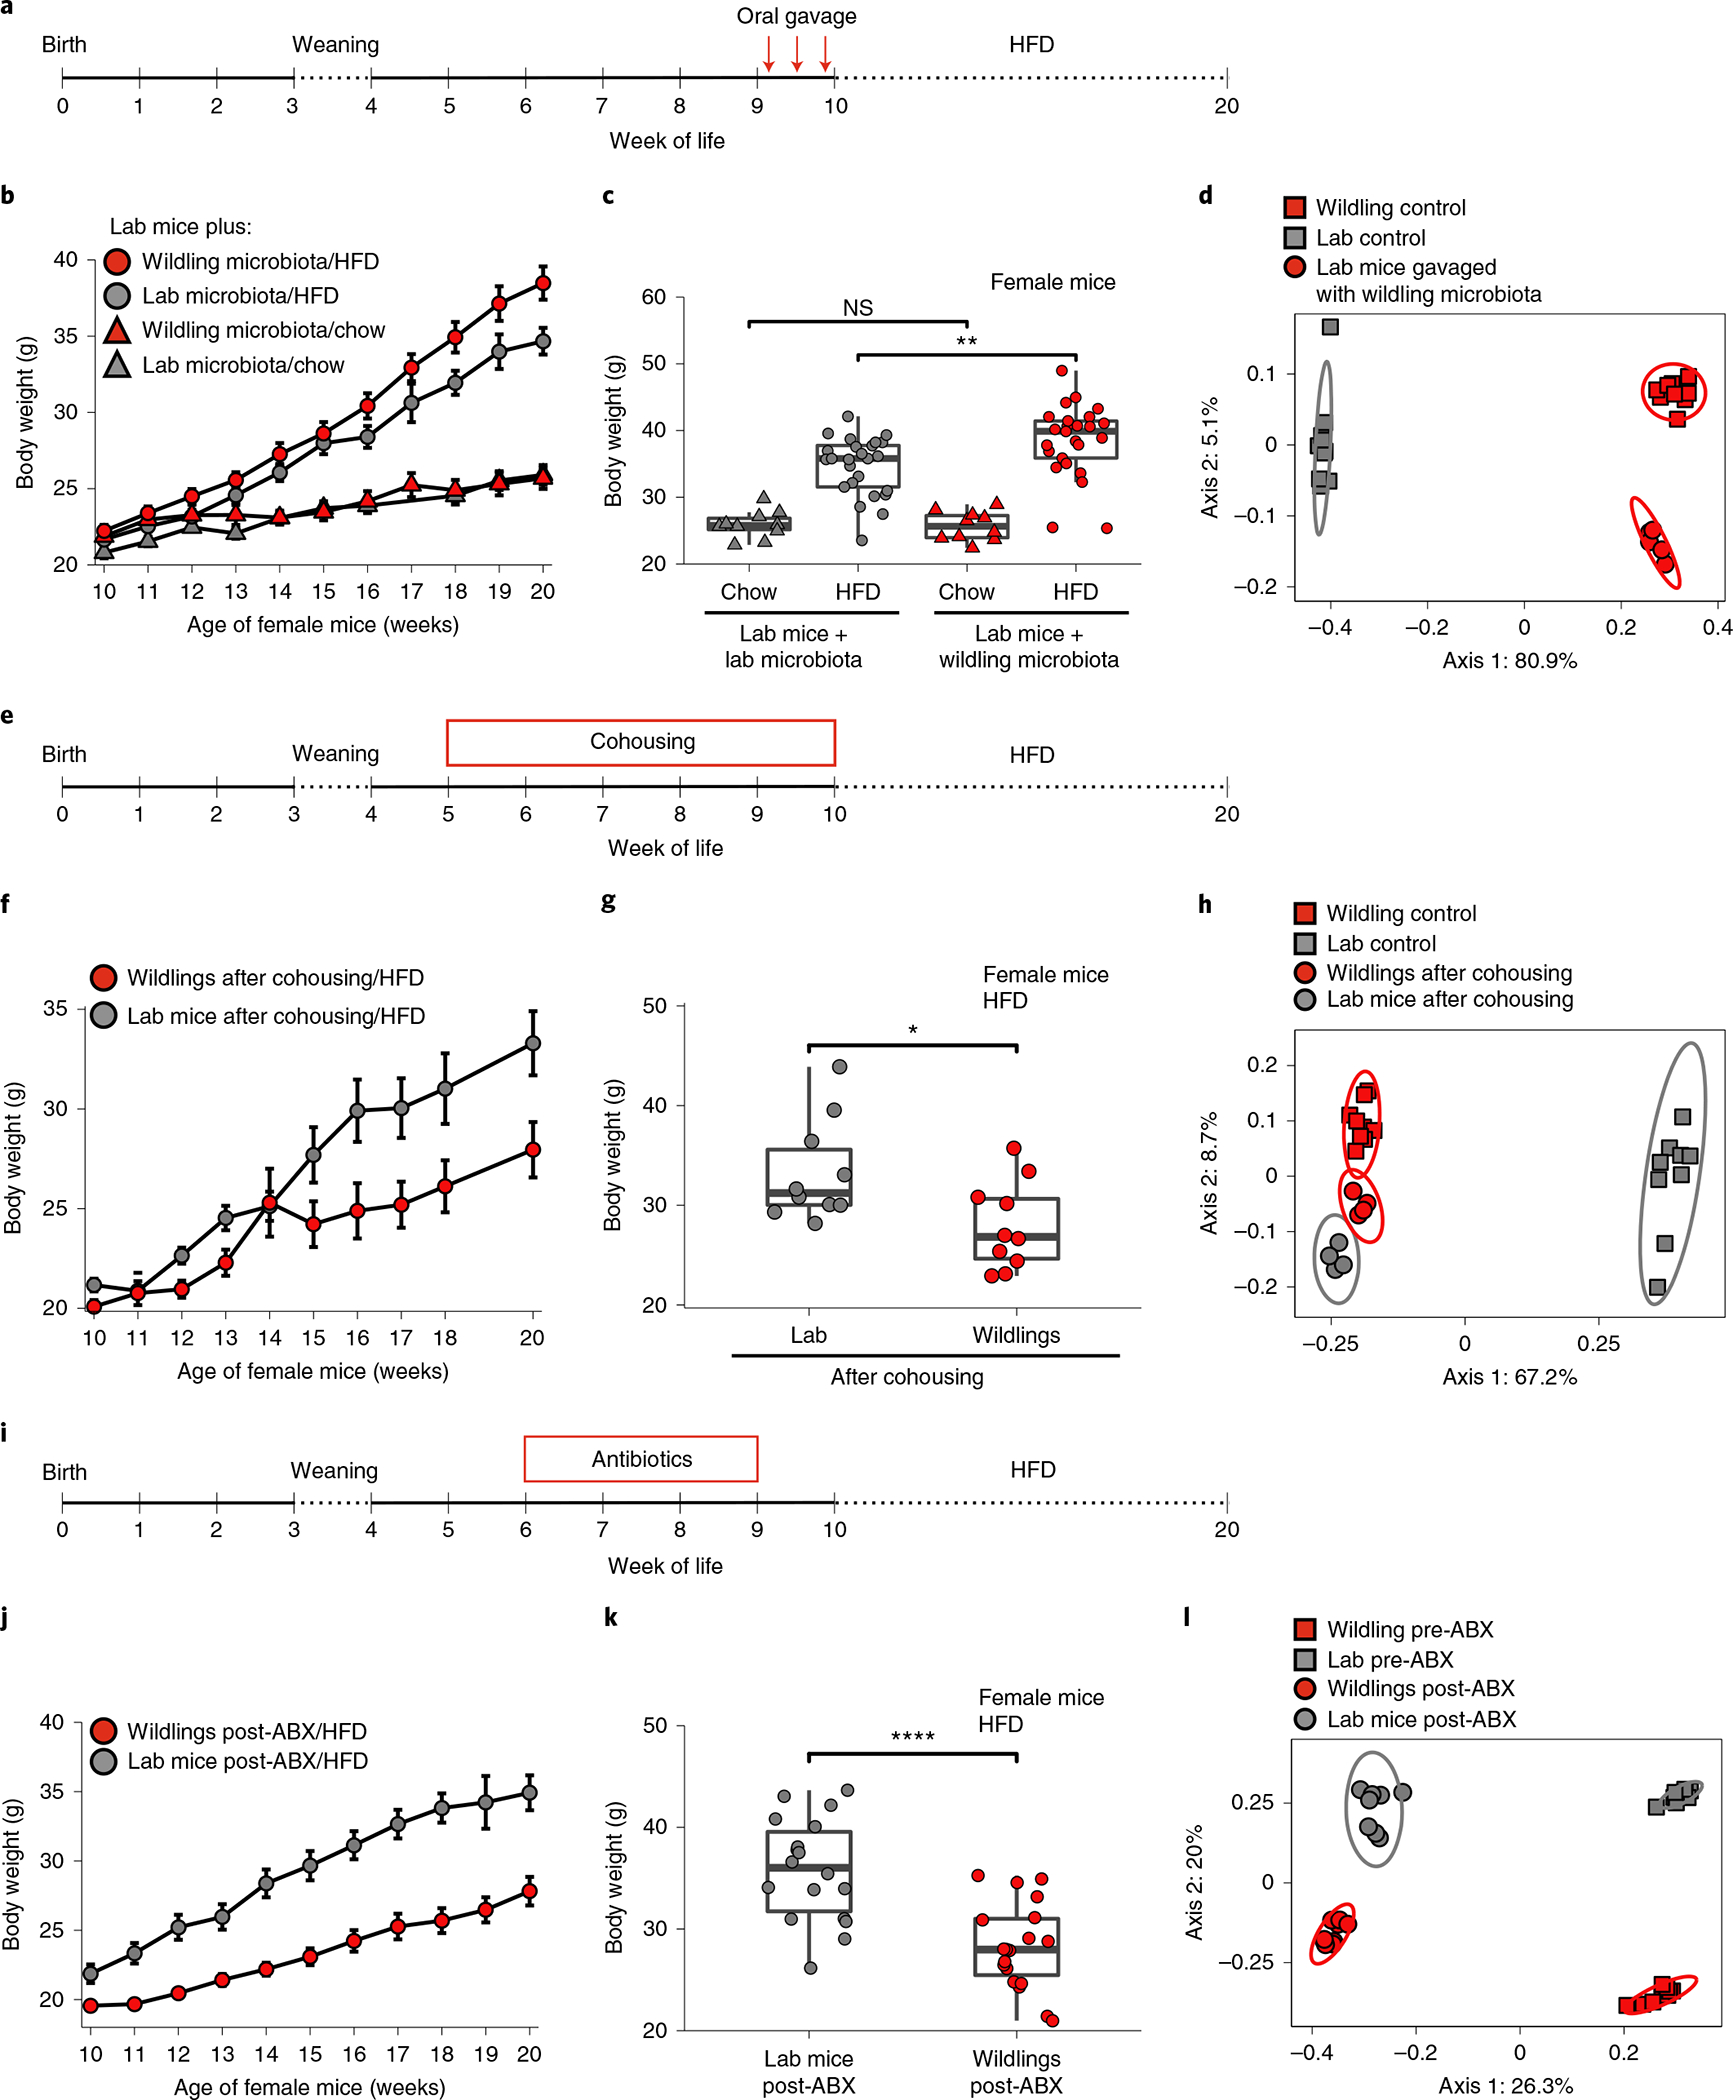
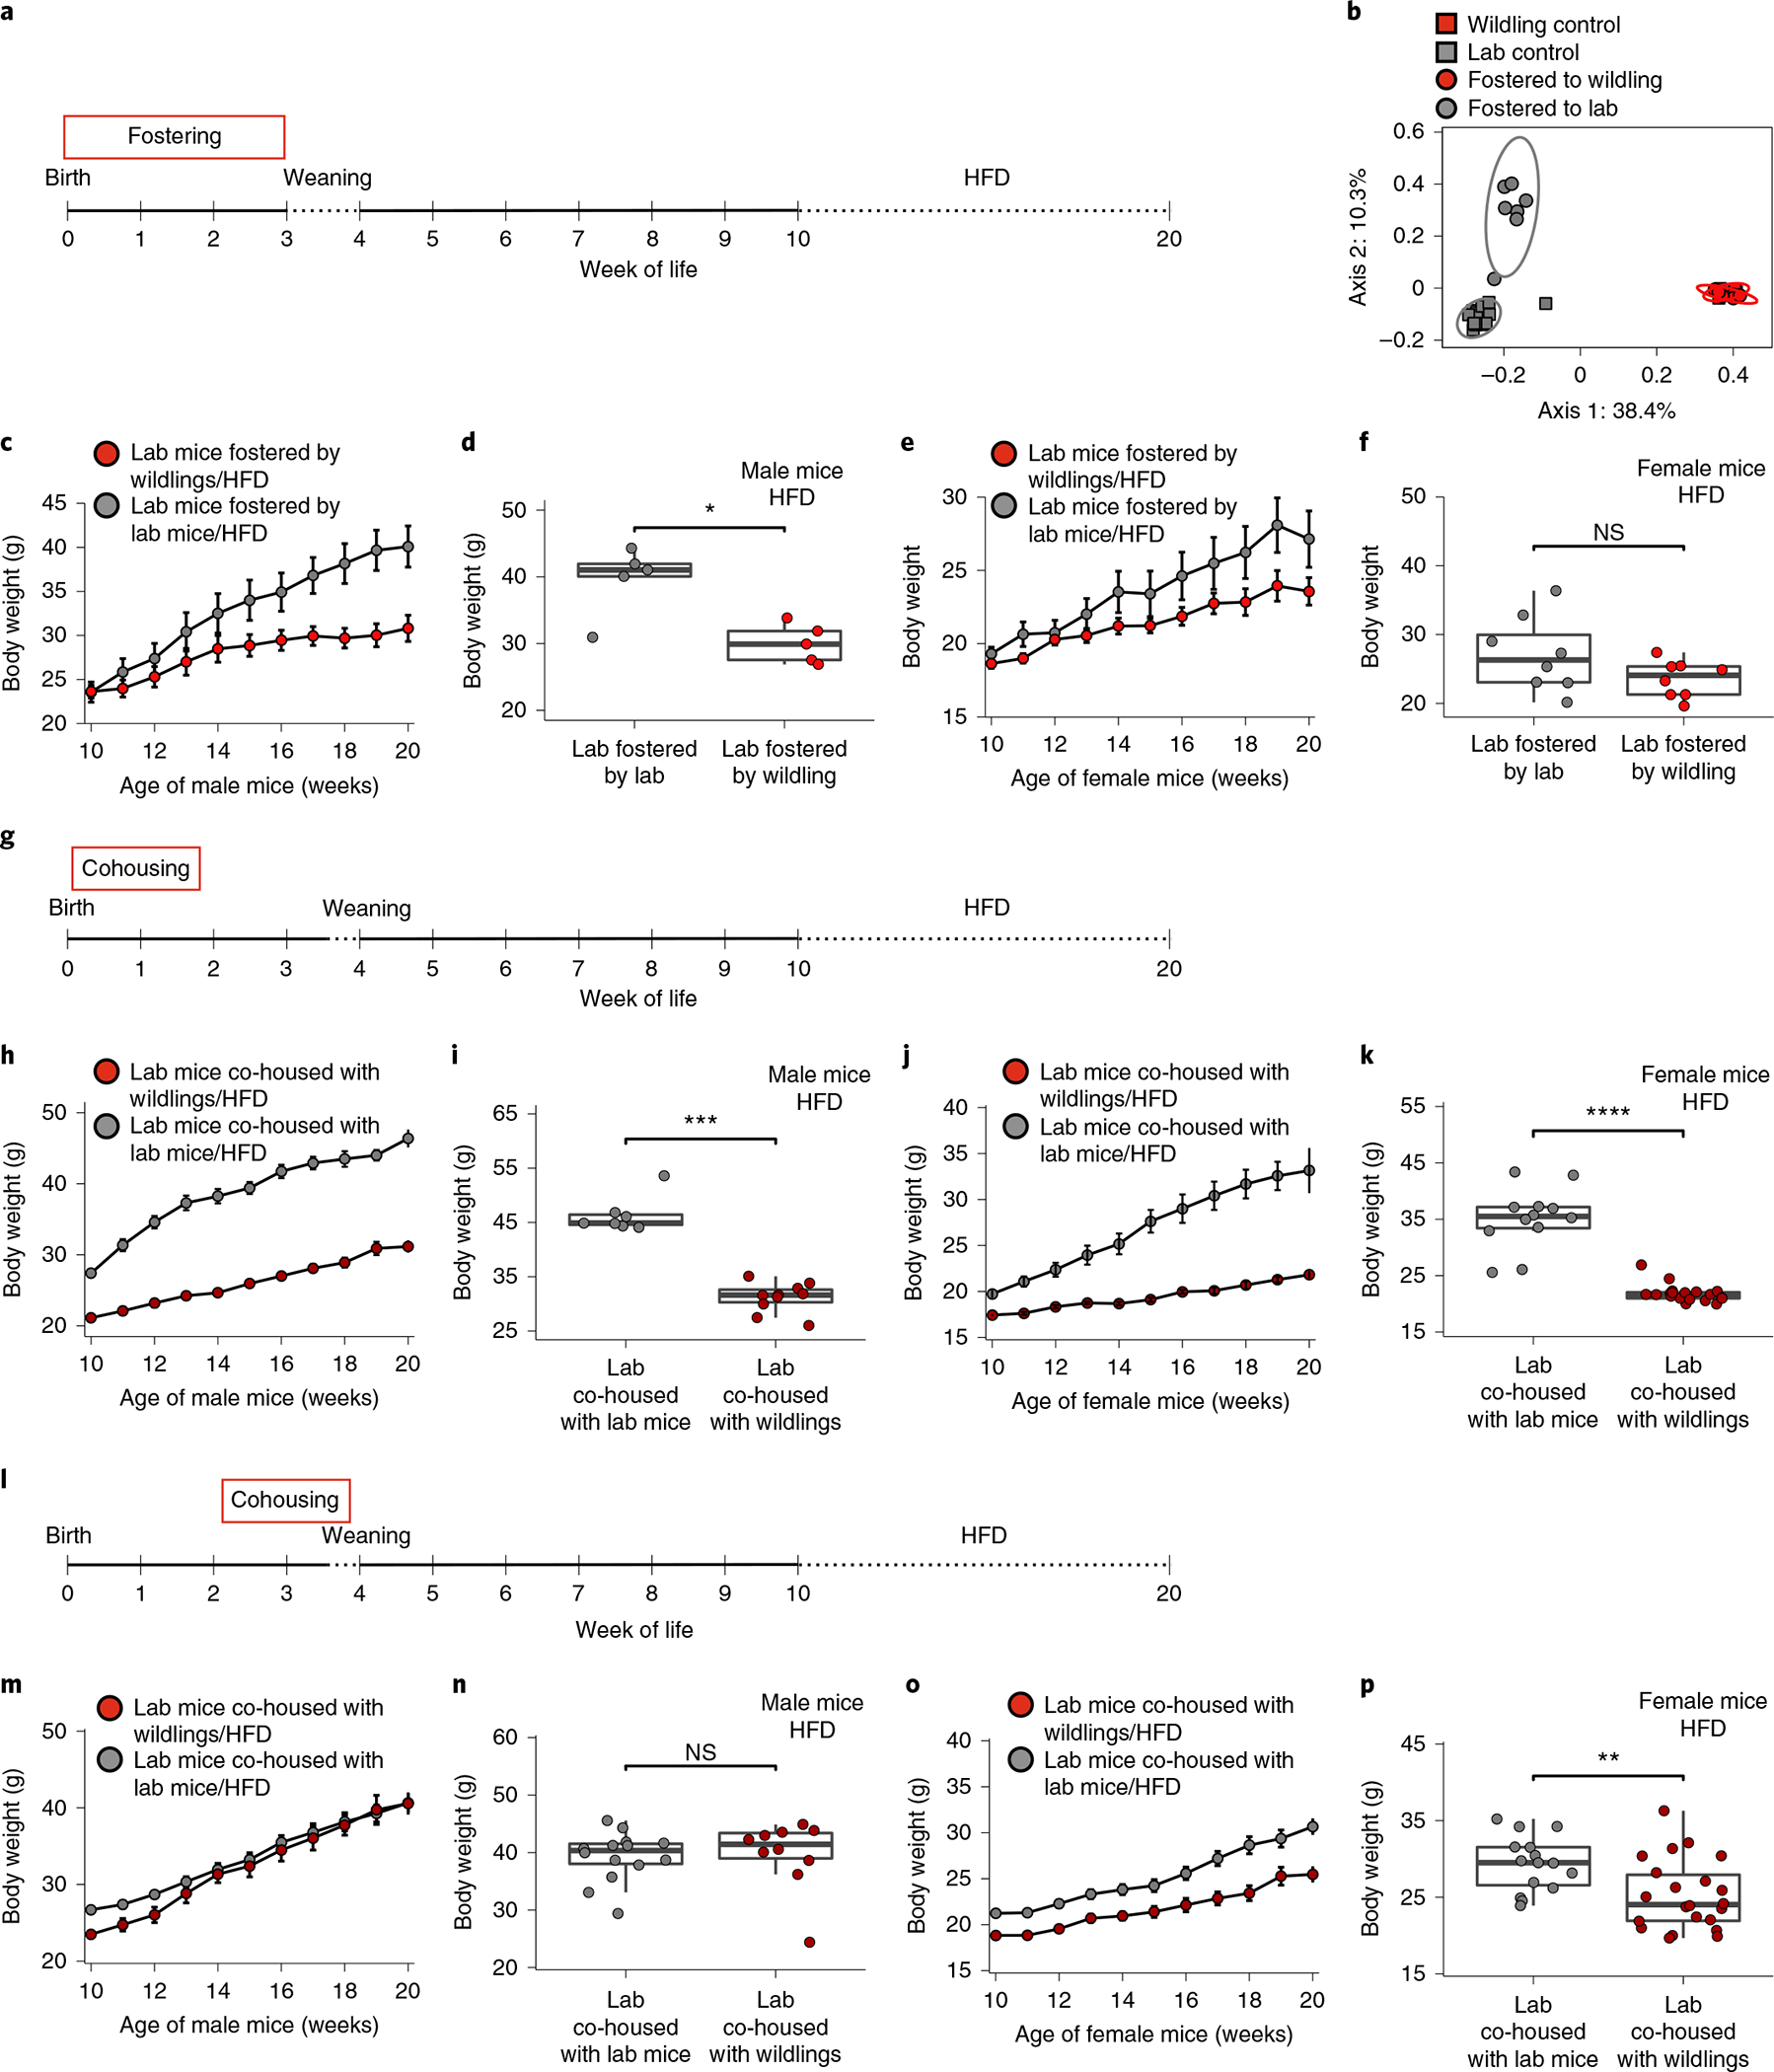
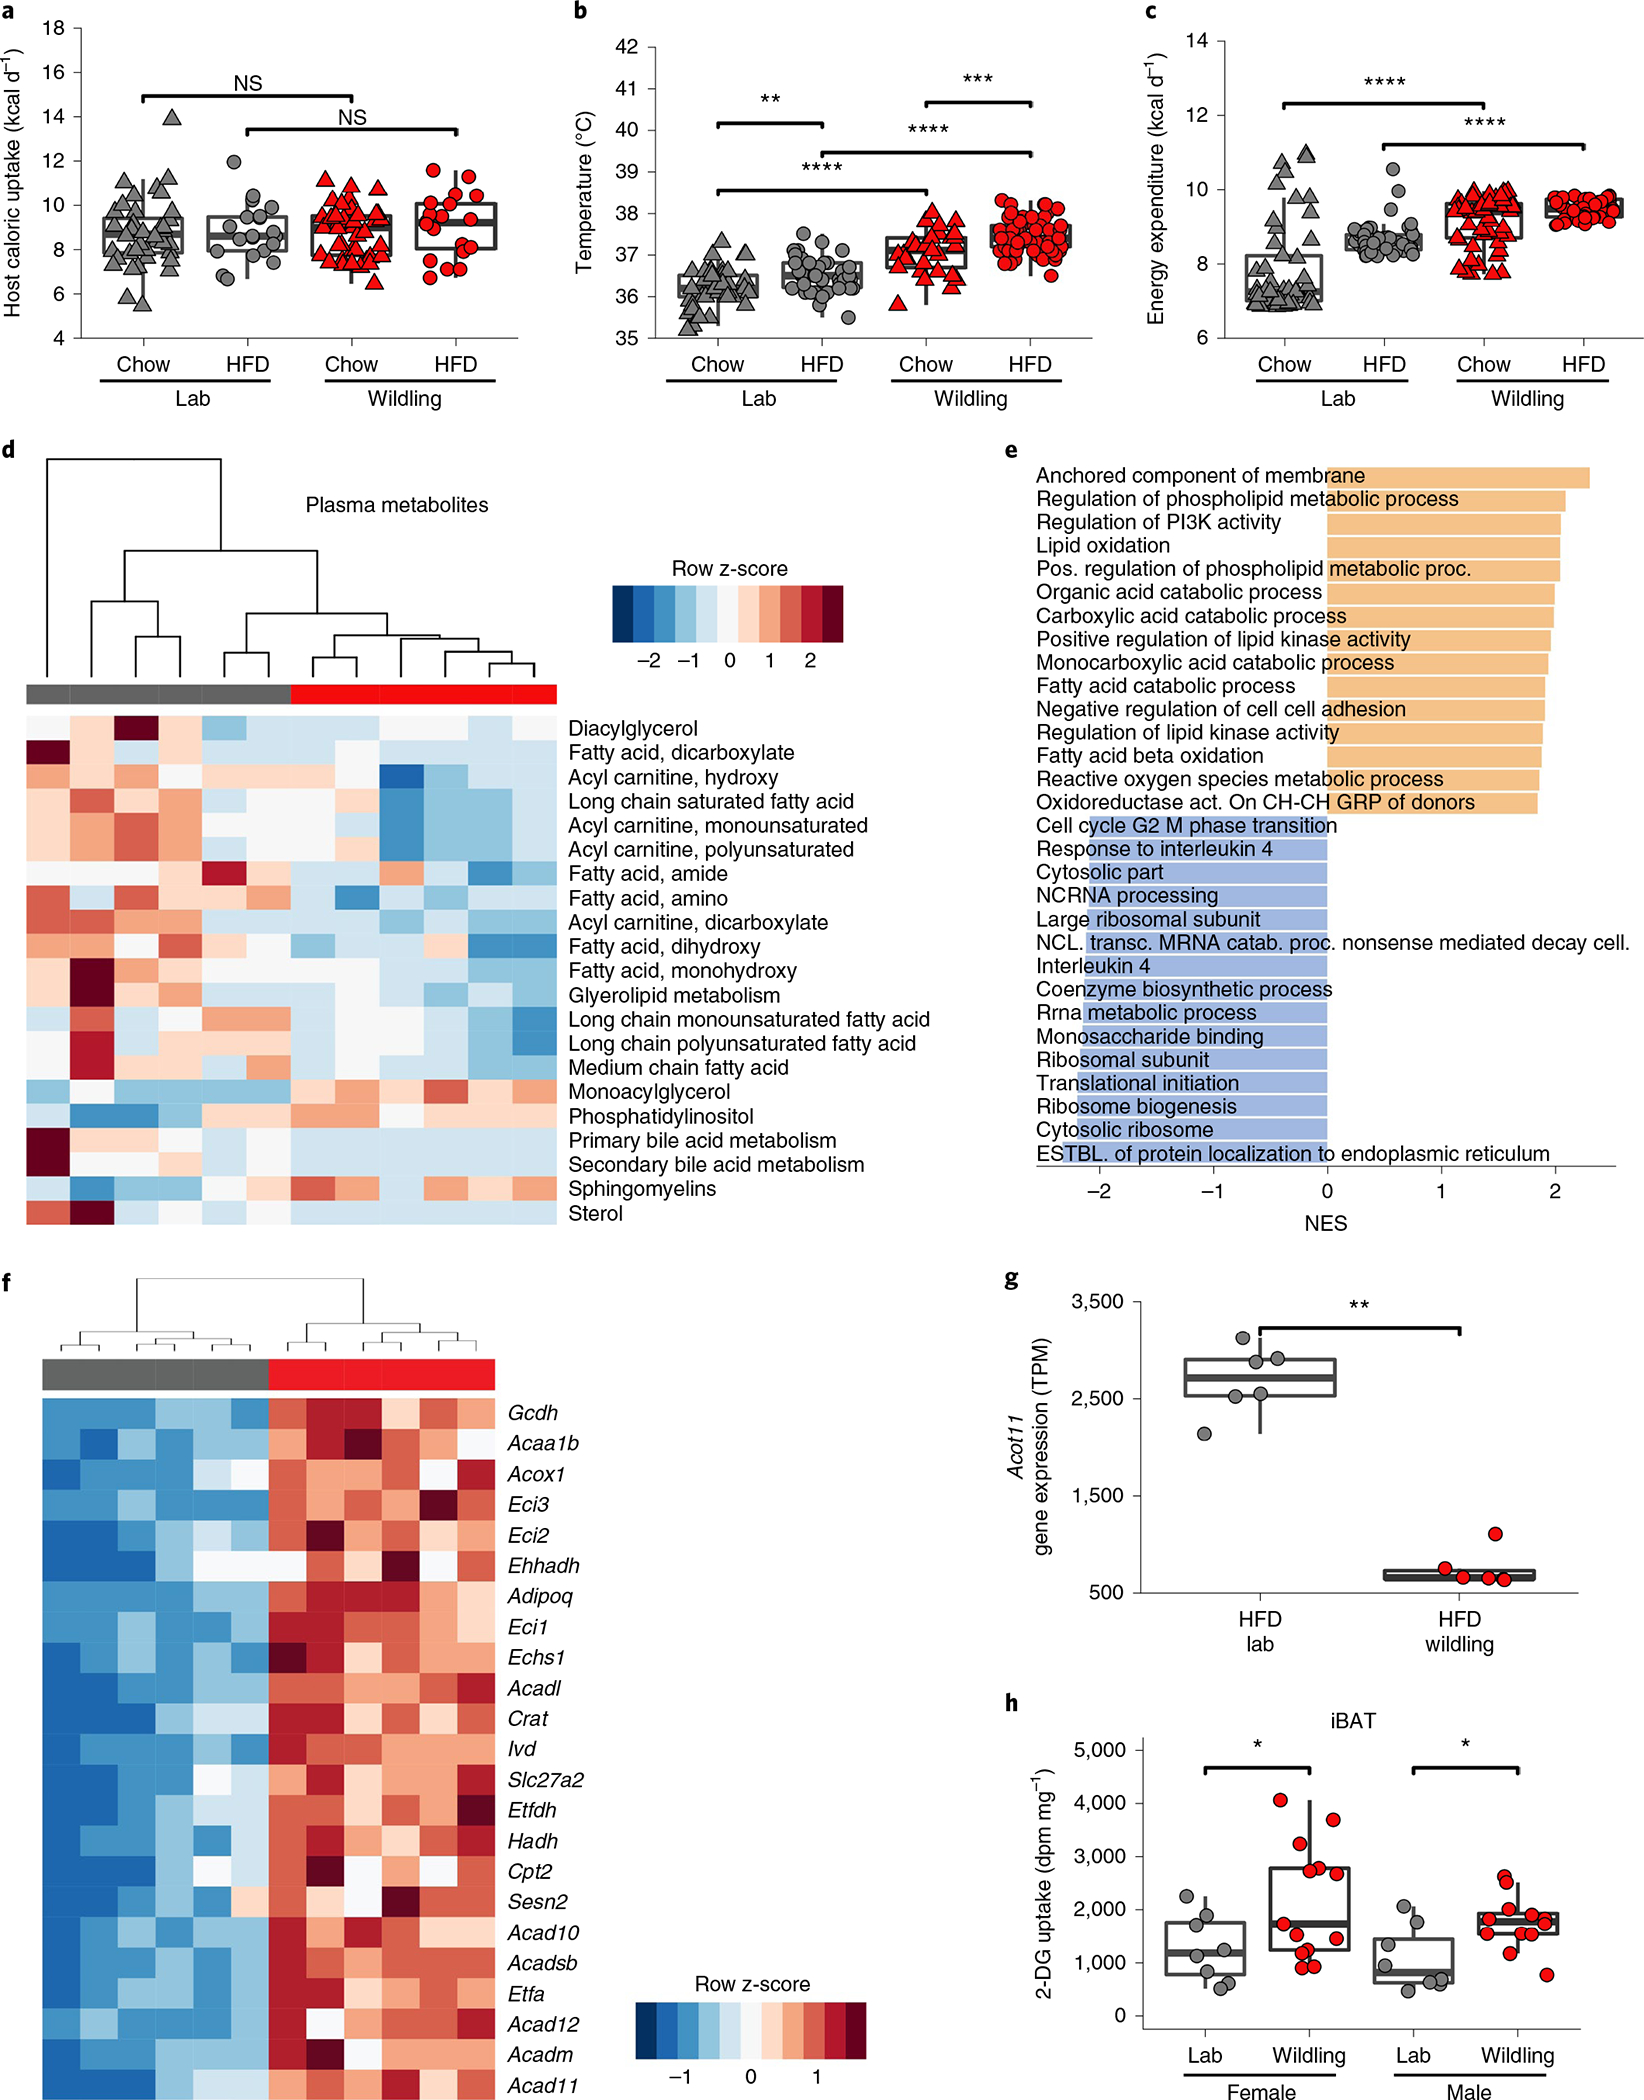
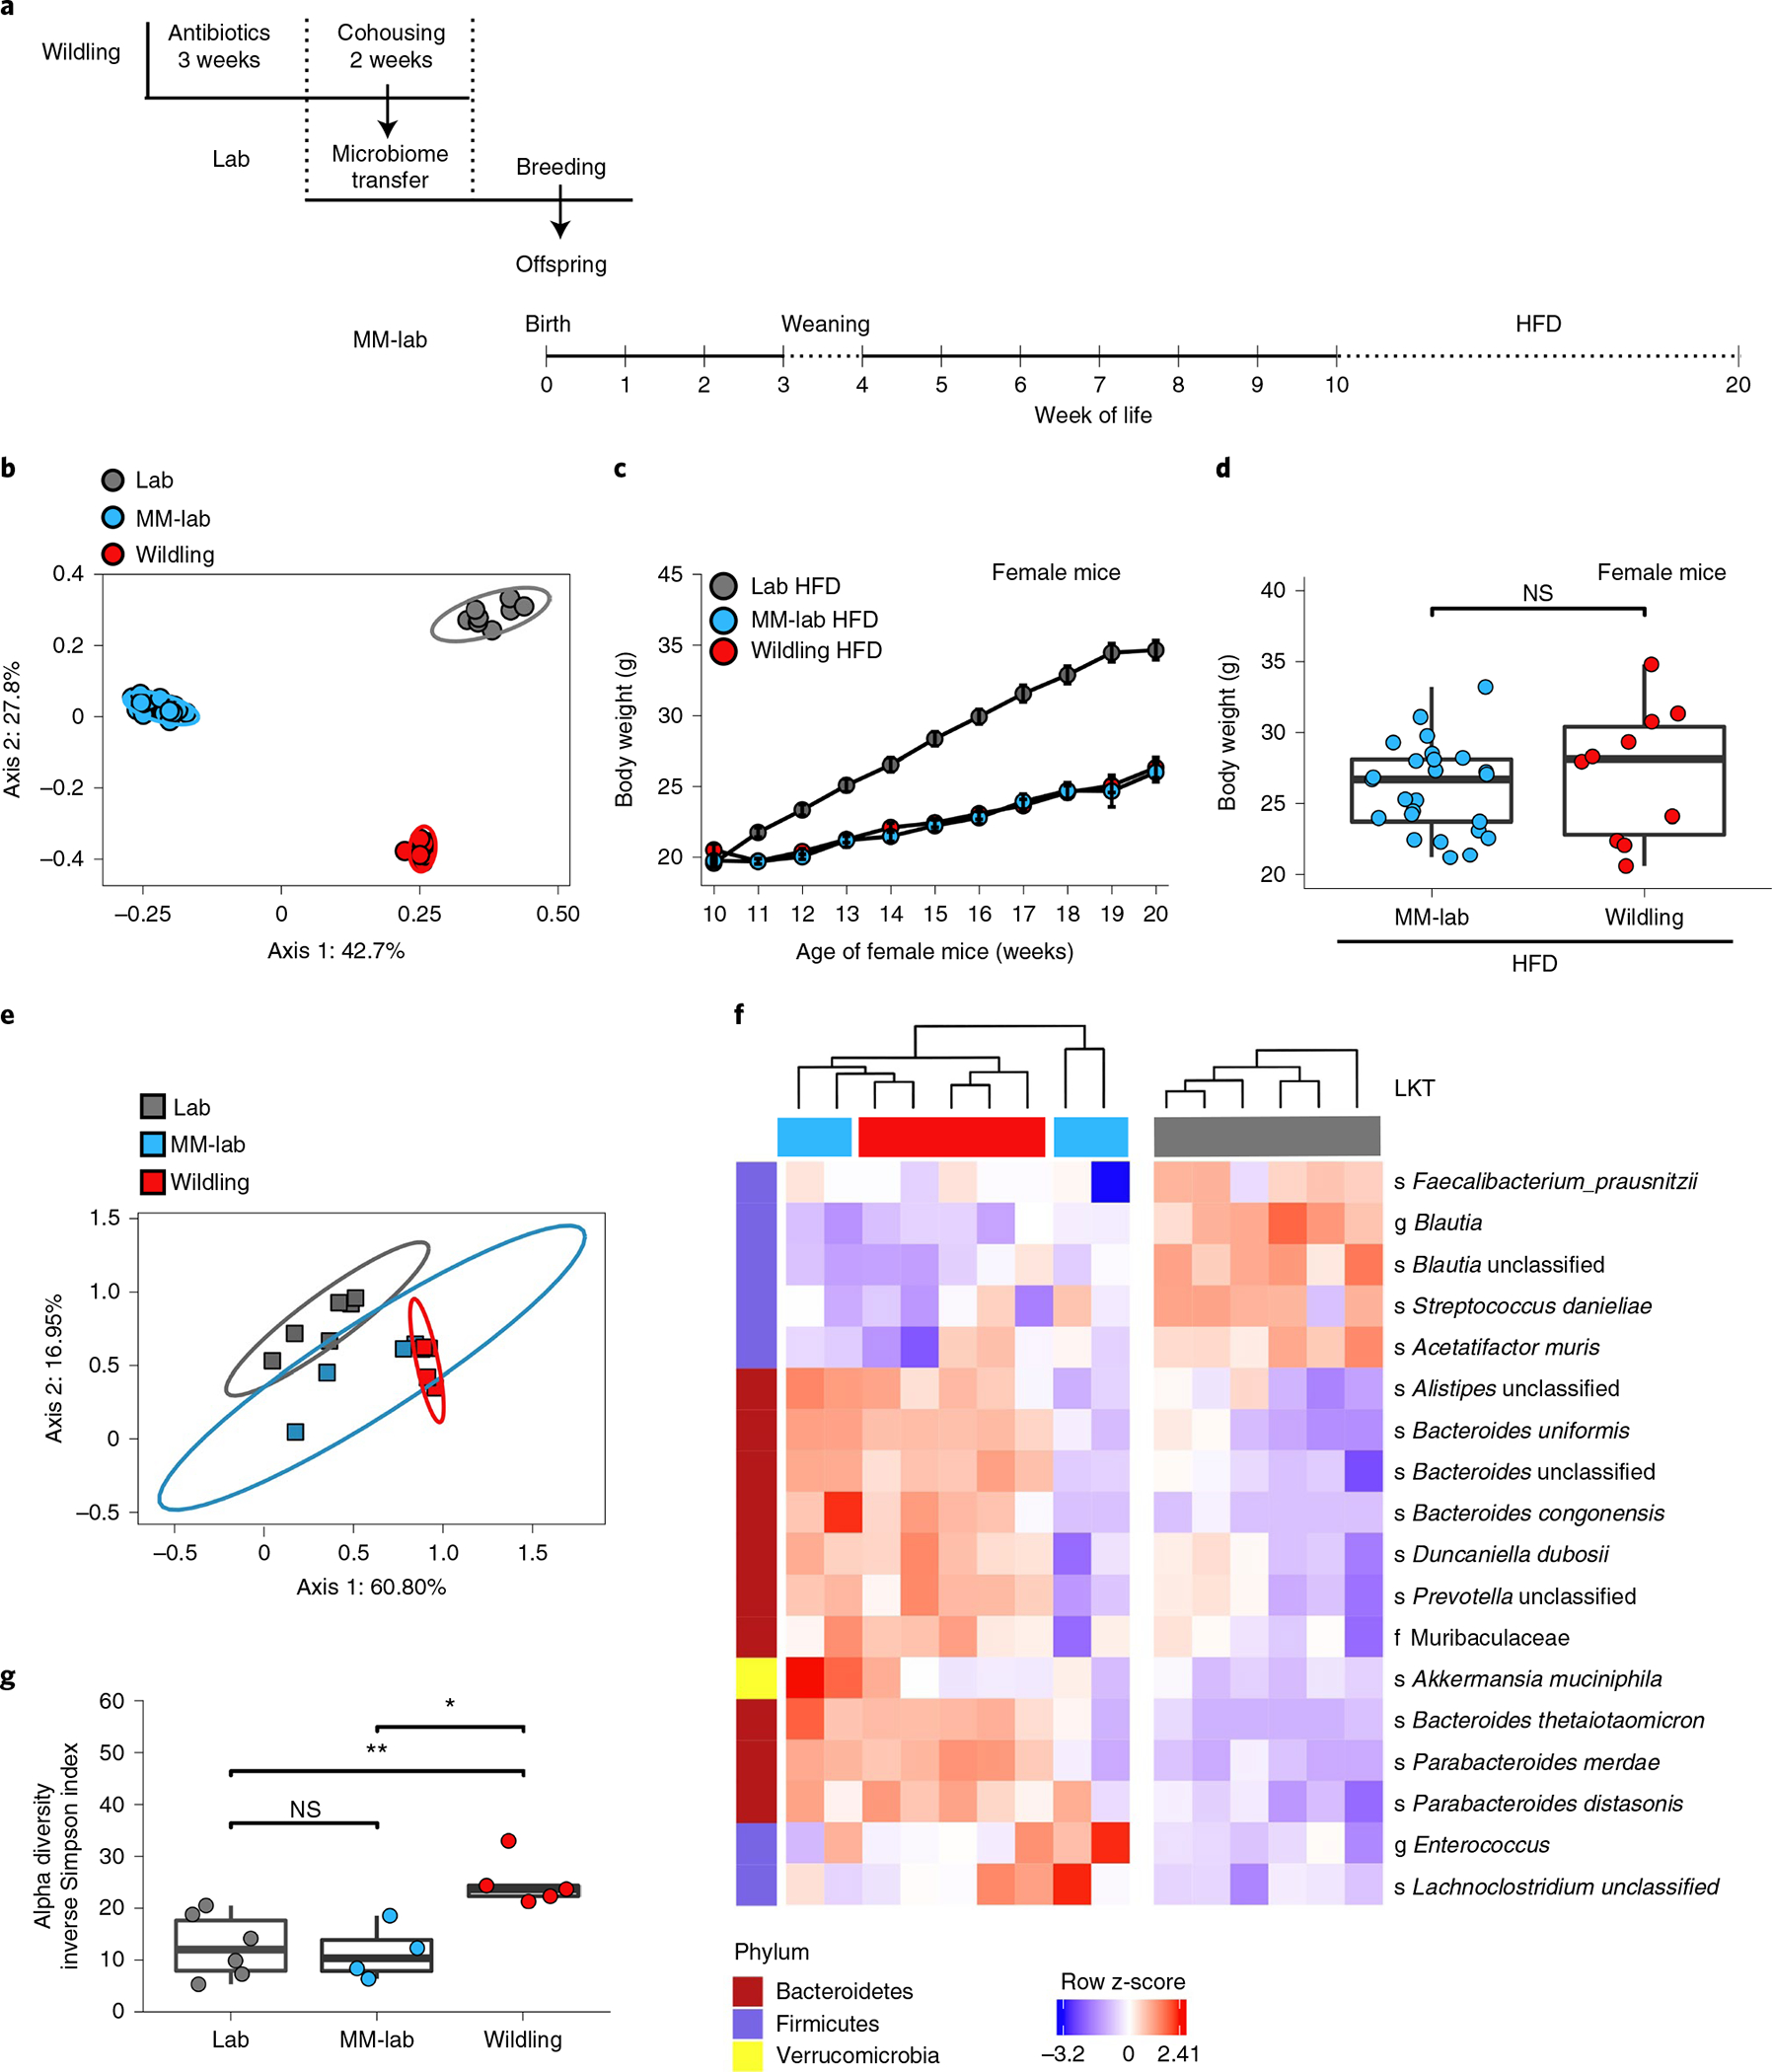
Obesity and its consequences are among the greatest challenges in healthcare. The gut microbiome is recognized as a key factor in the pathogenesis of obesity. Using a mouse model, we show here that a wild-derived microbiome protects against excessive weight gain, severe fatty liver disease and metabolic syndrome during a 10-week course of high-fat diet. This phenotype is transferable only during the first weeks of life. In adult mice, neither transfer nor severe disturbance of the wild-type microbiome modifies the metabolic response to a high-fat diet. The protective phenotype is associated with increased secretion of metabolic hormones and increased energy expenditure through activation of brown adipose tissue. Thus, we identify a microbiome that protects against weight gain and its negative consequences through metabolic programming in early life. Translation of these results to humans may identify early-life therapeutics that protect against obesity.


Conflict of interest statement

Competing interests

The authors declare no competing interests.

Figures

Extended Data Fig. 1 |
Extended Data Fig. 1 |. HFD-induced changes in the cecal microbiome of lab and wildling mice.
Shotgun metagenomics data comparing the cecal microbiome of female wildling and lab mice at week 10 of chow or HFD. Lab mice on HFD: n = 5; lab mice on chow: n = 6; wildlings on HFD: n = 5; wildlings on chow: n = 5. a-c, Alpha-diversity, measured as number of observed unique taxa (a), Shannon index (b) and Simpson index (c) based on last-known taxa identified by shotgun metagenomics analysis of cecal microbiome of female wildling and lab mice at week 10 of chow diet or HFD. Box plots show median (center line), 75th (upper limit of box) and 25th percentile (lower limit of box) and outliers (whiskers) if values do not exceed 1.5-times interquartile range. Unpaired two-tailed Student’s t test (Gaussian model) (a), Two-sided Wilcoxon signed rank test (b, c). (NS, not significant; * p < 0.05, ** p < 0.01, *** p < 0.001, **** p < 0.0001). d, e, Heat maps generated by unsupervised clustering within lab (d) and wildling (e), showing the most variant last-known taxa (FDR-adjusted p < 0.05 by Mann Whitney Wilcoxon test) after filtering based on taxon genome completeness of >10% in at least 5% of samples and abundance of >250 parts per million in at least 15% of samples. Relative abundances are shown as z-scores, letters in front of last-known taxa describe taxonomy (s = species, f=family, g=genus, o=order, p=phylum).
Extended Data Fig. 2 |
Extended Data Fig. 2 |. Food consumption of wildling and lab mice on chow and HFD.
Data points represent daily kcal consumption per mouse, based on weekly measurements per cage over the course of chow or HFD diet. a, Data set refers to food consumption during experiments described in Fig. 1b; n = 55 lab mice on HFD, n = 42 lab mice on chow, n = 60 wildlings on HFD, n = 30 wildlings on chow. b, refers to Fig. 1d, n = 20 lab mice on HFD, n = 15 lab mice on chow, n = 23 wildlings on HFD, n = 17 wildlings on chow. c, refers to Fig. 4b, lab mice plus lab microbiota: n = 10 lab mice on chow, n = 24 lab mice on HFD; lab mice plus wildling microbiota: n = 10 mice on chow, n = 25 mice on HFD. d, refers to Fig. 4f; n = 10 lab mice, n = 10 wildlings. e, refers to Fig. 4j, n = 18 lab mice, n = 20 for wildlings. f, refers to Fig. 5c, n = 5 lab mice fostered by lab mice, n = 5 lab mice fostered by wildlings. g, refers to Fig. 5e, n = 8 lab mice fostered by lab mice, n = 8 lab mice fostered by wildlings. h, refers to Fig. 5h, n = 7 lab mice co-housed with lab mice, n = 10 lab mice co-housed with wildlings. i, refers to Fig. 5j, n = 13 lab mice co-housed with lab mice, n = 19 lab mice co-housed with wildlings. j, refers to Fig. 5m, n = 15 lab mice co-housed with lab mice, n = 10 lab mice co-housed with wildlings. k, refers to Fig. 5n, n = 15 lab mice co-housed with lab mice, n = 22 lab mice co-housed with wildlings. Box plots show median (center line), 75th (upper limit of box) and 25th percentile (lower limit of box) and outliers (whiskers) if values do not exceed 1.5-times interquartile range. Unpaired two-tailed Student’s t test (Gaussian model) (c, d, f, g, h, i), two-sided Wilcoxon rank sum test (a, b, e, j, k). (NS, not significant; * p < 0.05, ** p < 0.01, *** p < 0.001, **** p < 0.0001, exact p-values are shown in the Source Data).
Extended Data Fig. 3 |
Extended Data Fig. 3 |. Fecal bomb calorimetry and rectal temperature of lab and wildling mice on chow and HFD.
a, b, Food energy intake (a) and fecal energy loss (bomb calorimetry) (b) in female lab or wildling mice on chow or HFD. N = 40 mice on chow and n = 40 mice on HFD examined per group over two independent experiments. c, Rectal temperature of male lab or wildling mice at week 9 of chow or HFD. N = 15 lab mice on chow, n = 20 lab mice on HFD, n = 17 wildlings on chow, n = 21 wildlings on HFD examined over two independent experiments. Box plots show median (center line), 75th (upper limit of box) and 25th percentile (lower limit of box) and outliers (whiskers) if values do not exceed 1.5-times interquartile range. Two-sided Wilcoxon rank sum test (NS, not significant; * p < 0.05, ** p < 0.01, *** p < 0.001, **** p < 0.0001, exact p-values are shown in the Source Data).
Extended Data Fig. 4 |
Extended Data Fig. 4 |. liver transcriptome of lab and wildling mice on HFD.
Bulk RNA sequencing of liver tissue from n = 7 lab mice (grey) and n = 7 wildlings (red) after 10 weeks of HFD. a, Unsupervised clustering of all metabolism-related gene transcripts that are significantly differently expressed. b, Volcano Plot. c, Comparison of lipogenesis-related gene transcripts (log2-fold expression) in liver tissue of the two groups of mice. Significance was determined as FDR ≤ 0.1.
Extended Data Fig. 5 |
Extended Data Fig. 5 |. Tissue-specific 2-deoxyglucose (2-DG) uptake in lab and wildling mice housed at 18 °C or 28 °C.
a, b, 2-DG uptake per milligram iBAT in female (a) or male (b) lab mice and wildlings at either 18 °C or 28 °C. c-h, 2-DG uptake in iWAT (c, d), pgWAT (e, f) or gastrocnemius muscle (g, h) in female (a, c, e, g) or male (b, d, f, h) lab or wildling mice held at 18 °C and 28 °C. N = 8 lab mice and n = 13 wildlings at 18 °C, n = 8 lab mice and n = 10 wildlings at 28 °C (a, c, e, g). N = 8 lab mice and n = 12 wildlings at 18 °C, n = 8 lab mice and n = 10 wildlings at 28 °C (b, d, f, h). Box plots show median (center line), 75th (upper limit of box) and 25th percentile (lower limit of box) and outliers (whiskers) if values do not exceed 1.5-times interquartile range. NS, not significant. Unpaired two-sided Student’s t test (Gaussian model) (a, b, d, e), two-sided Wilcoxon rank sum test (c, f, g, h). (NS, not significant; * p < 0.05, ** p < 0.01, *** p < 0.001, **** p < 0.0001, exact p-values are shown in the Source Data).
Extended Data Fig. 6 |
Extended Data Fig. 6 |. Western Blot analysis of AMPKalpha1, tyrosine hydroxylase and UCP1 in iBAT.
a, iBAT from lab and wildling mice at week 10 of HFD was analyzed by Western blot to quantitate the expression of tyrosine hydroxylase, AMPKalpha1 and UCP1 (upper bands) relative to GAPDH (lower bands). Brain lysate was used in the right lane (marked by asterisk). Representative Western Blot images for male mice (n = 6 mice per group). Unprocessed Western Blots are shown in Source Data. The experiment was independently repeated once for males and twice for females with similar results. b-g, The density of Western blot bands was quantified and normalized to each sample’s respective GAPDH band. Normalized expression levels are shown for tyrosine hydroxylase (b, c), AMPKalpha1 (d, e) and UCP1 (f, g) for female (b, d, f) and male (c, e, g) mice. N = 12 mice per group (b, c, e, g); n = 6 mice per group except n = 5 for the lab mouse group in blot 2 (d), n = 7 mice per group in blot 1, n = 6 mice per group in blot 2 (f). Box plots show median (center line), 75th (upper limit of box) and 25th percentile (lower limit of box) and outliers (whiskers) if values do not exceed 1.5-times interquartile range. Two-sided Wilcoxon signed rank test (NS, not significant; ** p = 0.007538).
Extended Data Fig. 7 |
Extended Data Fig. 7 |. Metabolic hormones of lab and wildling mice on chow and HFD.
Serum concentration of metabolic hormones of lab mice and wildlings at baseline (week 10 of age on chow diet) and after 1 week and 10 weeks of HFD (weeks 11 and 20 of age, respectively). Each sample was pooled from two mice. Female lab mice at baseline, n = 14; at week 1 of HFD, n = 12; at week 10 of HFD, n = 16; male lab mice at baseline, n = 14; at week 1 of HFD, n = 14; at week 10 of HFD, n = 14; female wildlings at baseline, n = 14; at week 1 on HFD, n = 16; at week 10 of HFD, n = 12; male wildlings at baseline, n = 14; at week 1 of HFD, n = 16; at week 10 of HFD, n = 12. a Heatmap displaying median value of each group presented as z-score. BDNF, brain derived neurotropic factor; BAFF, B-cell activating factor. The Mesoscale Mouse Metabolic Combo 1 multiplex assay was used. b-h Serum concentration of glucagon (b), peptide YY (PYY) (c, d), thyroid stimulating hormone (TSH) (e, f), and the inactive form of glucagon like peptide 1 (GLP1) (g, h) at the indicated time points on chow or HFD as determined by multiplex Mesoscale Mouse Metabolic Combo 1 multiplex assay (b, c, d, g, h) or ELISA (e, f). Box plots show median (center line), 75th (upper limit of box) and 25th percentile (lower limit of box) and outliers (whiskers) if values do not exceed 1.5-times interquartile range. Two-sided Wilcoxon signed rank test (NS, not significant; * p < 0.05, ** p < 0.01, *** p < 0.001, **** p < 0.0001, exact p-values are shown in the Source Data).
Extended Data Fig. 8 |
Extended Data Fig. 8 |. increased diversity of wildling microbiome with interspersed clustering of MM-lab mice.
Shotgun metagenomics analysis of cecal microbiome from 12-day-old lab (n = 6), MM-lab (n = 4) and wildling (n = 5) pups. MM-lab mice were generated by co-housing lab mice with antibiotic-treated wildlings for 2 weeks and then separating and breeding these lab mice. Their offspring (microbiome modified (MM)-lab) were used for these experiments. a, Heat map generated by unsupervised clustering, showing the most variant last known taxa (LKT) after filtering based on taxon genome completeness of >10% in at least 5% of samples and abundance of >250 parts per million in at least 15% of samples. Relative abundances are shown as z-scores. Letters in front of LKT describe taxonomy (s = species, f=family, g=genus, o=order, p=phylum). b-d, Alpha-diversity, measured as number of observed unique taxa (b), Simpson index (c) and Shannon index (d) based on LKT. Box plots show median (center line), 75th (upper limit of box) and 25th percentile (lower limit of box) and outliers (whiskers) if values do not exceed 1.5-times interquartile range. Two-sided Wilcoxon signed rank test (NS, not significant; * p < 0.05, ** p < 0.01, exact p-values are shown in the Source Data).
Extended Data Fig. 9 |
Extended Data Fig. 9 |. Graphical Summary.
Exposure to a wildling microbiome resulting in increased brown adipose tissue activity that protects from diet-induced obesity later-on in life.
Fig. 1 |
Fig. 1 |. Wildlings are protected from excessive weight gain on HFD.
a, Experimental design. C57BL/6NTac with wild mouse microbiome (wildlings) and C57BL/6NTac with SPF lab mouse microbiome (lab) received a 10-week course of either regular chow or HFD. b,c, Weight of female lab or wildling mice during (b) and after 10 weeks of chow or HFD (c). n = 42 lab mice on chow, n = 55 lab mice on HFD; n = 30 wildlings on chow, n = 60 wildlings on HFD examined over 3 independent experiments. d,e Weight of male lab or wildling mice during (d) and after 10 weeks of chow or HFD (e). n = 15 lab mice on chow, n = 20 lab mice on HFD; n = 17 wildlings on chow, n = 23 wildlings on HFD examined over two independent experiments. f,g, Fat (f) and lean (g) body mass of female mice on chow (n = 20 lab mice, n = 15 wildlings) or HFD (n = 20 lab mice, n = 20 wildlings). h,i, Fat (h) and lean (i) body mass of male mice on HFD (n = 10 lab mice, n = 14 wildlings). j,k, Pearson correlation of body weight and fat mass of female (j) and male (k) lab and wildling mice after 10 weeks of chow or HFD; two independent experiments each, symbols as in b. l,m, Weight of pgWAT (l) and iWAT (m) of female mice after 10 weeks of chow (n = 50 lab mice, n = 78 wildlings) or HFD (n = 57 lab mice, n = 70 wildlings), examined over five independent experiments. n,o, Weight of pgWAT (n) and iWAT (o) of male mice after 10 weeks of HFD (n = 10 lab mice, n = 10 wildlings), examined over two independent experiments. Mean ± s.e.m. are shown (b,d). Box plots show median (centre line), 75th (upper limit of box) and 25th percentiles (lower limit of box) and outliers (whiskers) if values do not exceed 1.5 × interquartile range (c,ei,lo). Two-sided Student’s t-test (Gaussian model) (e,g,h,i,n,o); two-sided Wilcoxon rank sum test (c,f,l,m). NS, not significant; **P < 0.01, ***P < 0.001, ****P < 0.0001; exact P values are provided in the Source Data.
Fig. 2 |
Fig. 2 |. Wildlings are protected from adverse metabolic effects of HFD.
a,b, Liver weight of female (a) or male (b) lab or wildling mice at week 10 of chow or HFD; n = 159 lab mice on HFD, n = 55 lab mice on chow; n = 95 wildlings on HFD, n = 78 wildlings on chow examined over three independent experiments (a); n = 10 lab mice, n = 10 wildlings examined over two independent experiments (b). c, Liver fat content of female lab and wildling mice at 10, 20 or 30 weeks of age on chow and at 20 or 30 weeks of age on HFD as assessed by scoring of liver histology by two independent assessors. n = 47 lab mice on chow, n = 50 lab mice on HFD; n = 38 wildlings on chow, n = 52 wildlings on HFD examined over three independent experiments. d, Hematoxylin and eosin (H&E)-stained liver histology from female lab and wildling mice after 10 weeks of HFD, representative for data in c obtained over three independent experiments. Scale bars, 100 μm. e,f, Serum alanine aminotransferase (ALT) activity of female (e) and male (f) lab or wildling mice after 10 weeks of chow or HFD. n = 8 lab mice on chow, n = 14 lab mice on HFD; n = 8 wildlings on chow, n = 14 wildlings on HFD (e); n = 10 lab mice, n = 10 wildlings (f). g,h, Oral glucose tolerance test of female mice (n = 33 lab mice, n = 39 wildlings) on HFD showing blood glucose levels at different times of the test (g) and glucose area under the curve (AUC) for the entire assay (h). Data are from three independent experiments. i,j, Oral glucose tolerance test of male mice (n = 20 lab mice, n = 24 wildlings) on HFD showing blood glucose levels at different times of the test (i) and glucose area under the curve (AUC) for the entire assay (j). Data are from three independent experiments. Data are presented as mean values ± s.e.m. (g,i). Box plots show median (centre line), 75th (upper limit of box) and 25th percentiles (lower limit of box) and outliers (whiskers) if values do not exceed 1.5 × interquartile range (a–c,e,f,h,j); *P < 0.05, **P < 0.01, ***P < 0.001. Unpaired two-sided Student’s t-test (Gaussian model) (b); two-sided Wilcoxon rank sum test (a,c,e,f–j). *P < 0.05, **P < 0.01, ***P < 0.001, ****P < 0.0001; exact P values are provided in the Source Data. IU, international units.
Fig. 3 |
Fig. 3 |. HFD-induced changes in the wildling and lab mouse microbiome.
Shotgun metagenomics data comparing the caecal microbiome of female wildling and lab mice at week 10 of chow or HFD. a,b, PCoA (Jaccard distance) of first and second (a) and the second and third (b) most variant axes. c, Alpha diversity expressed as inverse Simpson index. d,e, Relative abundance of the phyla Firmicutes (d) and Bacteroidetes (e). f, Heat map generated by unsupervised clustering, showing the top 50 most variant genera (false discovery rate (FDR)-adjusted P < 0.05 across groups by analysis of variance test) after filtering based on taxon genome completeness of >10% in at least 5% of samples and abundance of >250 parts per million in at least 15% of samples. Relative abundances are shown as z-score. n = 6 lab mice on HFD, n = 6 lab mice on chow; n = 5 wildlings on HFD, n = 5 wildlings on chow (ce). Box plots show median (centre line), 75th (upper limit of box) and 25th percentiles (lower limit of box) and outliers (whiskers) if values do not exceed 1.5 × interquartile range (ce). Unpaired two-sided Student’s t-test (Gaussian mode) (b); two-sided Wilcoxon rank sum test (cf). *P < 0.05, **P < 0.01, ***P < 0.001; exact P values are provided in the Source Data.
Fig. 4 |
Fig. 4 |. impact of adult life microbiome on HFD response.
a, Design of experiment. b,c, Weight during (b) and after 10 weeks on chow or HFD (c) of lab mice (n = 10 mice on chow and n = 25 mice on HFD over two independent experiments) that had been gavaged with caecal content from wildlings and of lab mice (n = 10 mice on chow and n = 24 mice on HFD over two independent experiments) that had been gavaged with caecal content from lab mice. d, PCoA (Jaccard distance) of 16S rRNA gene-profiling data of faecal samples from lab mice at week 20 of age on chow diet (10 weeks after gavage with caecal content from wildlings), in comparison with untreated lab mice and untreated wildlings. e, Design of experiment. f,g, Weight over time (f) and after 10 weeks of HFD (g) of n = 10 lab mice and n = 10 wildlings that had been cohoused at weeks 5–10 of age, examined over two independent experiments. h, PCoA (Jaccard distance) of 16S rRNA gene-profiling data of faecal samples from lab mice and wildlings at week 20 of age on HFD (after cohousing for weeks 5–10 of age) in comparison with control lab mice and wildlings. i, Design of experiment. j,k, weight over time (j), and after 10 weeks of HFD (k) of n = 18 lab mice and n = 20 wildlings that had received 3 weeks of antibiotic (ABX) treatment (vancomycin, neomycin, metronidazole, ampicillin) from week 6 to 9 of age. l, PCoA (Jaccard distance) of 16S rRNA gene-profiling data of faecal samples from lab mice and wildlings before (pre-ABX) and 1 week after (post-ABX) a 3-week course of ABX treatment. Mean ± s.e.m. are shown (b, f, j). Ellipses indicate 95% confidence interval (d,h). Box plots show median (centre line), 75th (upper limit of box) and 25th percentiles (lower limit of box) and outliers (whiskers) if values do not exceed 1.5 × interquartile range. Unpaired two-sided Student’s t-test (Gaussian model) (c,g,k). *P < 0.05, **P < 0.01, ****P < 0.0001; exact P values are provided in the Source Data.
Fig. 5 |
Fig. 5 |. Microbiota exposure in early-life programmes the response to HFD.
a, Experimental design. Lab mice were delivered via sterile C-section, fostered by either lab or wildling dams and subjected to HFD from week 10 to 20 of age. b, PCoA (Jaccard distance) of 16S rRNA gene-profiling data of faecal samples; ellipses show 95% confidence interval. c,d, Weight of fostered male lab mice (n = 5 per group) during (c) and after 10 weeks (d) of HFD. e,f, Weight of fostered female lab mice (n = 8 per group) during (e) and after 10 weeks (f) of HFD. Data were collected over two independent experiments (bf). g, Experimental design: at day 2 of age, lab and wildling litters and their respective dams were cohoused for a period of 11 d. As controls, two lab litters and their respective dams were cohoused for the same period of time. After 11 d of cohousing, lab litters and their dams were separated from wildling litters and their dams. The pups were weaned at day 26 of age and subjected to HFD. h,i, Weight of male lab mice (n = 10 had been cohoused with wildlings, n = 7 had been cohoused with lab mice) during (h) and after (i) the 10-week course of HFD. j,k, Weight of female lab mice (n = 19 had been cohoused with wildlings, n = 13 had been cohoused with lab mice) during (j) and after (k) the 10-week course of HFD. l, Experimental design: at day 15 of age, lab and wildling litters and their respective dams were cohoused for a period of 11 d. As controls, two lab litters and their respective dams were cohoused for the same period of time. After 11 d of cohousing, lab litters and their dams were separated from wildling litters and their dams. The pups were weaned at day 26 of age and subjected to HFD. m,n, Weight of male lab mice (n = 10 had been cohoused with wildlings, n = 15 had been cohoused with lab mice) during (m) and after (n) the 10-week course of HFD. o,p, Weight of female lab mice (n = 22 had been cohoused with wildlings, n = 15 had been cohoused with lab mice) during (o) and after (p) the 10-week course of HFD. Mean ± s.e.m. are shown (c,e,h,j,m,o). Box plots show median (centre line), 75th (upper limit of box) and 25th percentiles (lower limit of box) and outliers (whiskers) if values do not exceed 1.5 × interquartile range (d,f,i,k,n,p). Two-sided Wilcoxon rank sum test (d,f,i,k,n,p). *P < 0.05, **P < 0.01, ***P < 0.001, ****P < 0.0001; exact P values are provided in the Source Data.
Fig. 6 |
Fig. 6 |. Energy expenditure is increased in wildlings.
a, Caloric uptake calculated by subtracting faecal energy loss (bomb calorimetry) from energy of consumed food. n = 40 lab mice on chow, n = 20 lab mice on HFD; n = 40 wildlings on chow, n = 20 wildlings on HFD (all female mice) examined over two independent experiments. b, Rectal temperature of female lab or wildling mice on chow or HFD. Each data point represents the mean of weekly measurements of a single mouse at weeks 7–9 of diet. n = 42 lab mice on chow, n = 55 lab mice on HFD; n = 42 wildlings on chow, n = 60 wildlings on HFD (all female mice) examined over three independent experiments. c, Energy expenditure during 10 weeks on the respective diet (means of overall energy expenditure per mouse) as calculated using a virtual calorimetry chamber algorithm. n = 42 lab mice on chow, n = 55 lab mice on HFD; n = 30 wildlings on chow, n = 60; wildlings on HFD examined over 3 independent experiments. d, Unsupervised clustering of subpathways classified as lipid-related, based on metabolite analysis (using the Metabolon HD4 Panel) of plasma from n = 6 lab mice (grey) and n = 5 wildling mice (red) examined after 10 weeks of HFD over two independent experiments. eg RNA-seq data from iBAT from n = 6 female lab mice (grey) and n = 6 female wildling mice (red) after 10 weeks of HFD. Gene set enrichment analysis showing the 15 most strongly upregulated (orange) or downregulated (grey) gene sets in wildling iBAT compared with lab mouse iBAT, sorted by maximum normalized enrichment score (NES) (e). Unsupervised clustering of transcripts from the gene ontology group ‘fatty acid beta-oxidation’ that are differentially expressed in BAT from wildling versus lab mice (f). Acot11 mRNA level; TPM, transcripts per kilobase million (g). h, 2-DG uptake per milligram of iBAT from lab and wildling mice at 18 °C. n = 8 female lab mice, n = 13 female wildlings; n = 8 male lab mice, n = 12 male wildlings. All data are from female mice in ag; male and female mice are shown h. Box plots show median (centre line), 75th (upper limit of box) and 25th percentiles (lower limit of box) and outliers (whiskers) if values do not exceed 1.5 × interquartile range (ac,g,h). Two-sided Wilcoxon rank sum test (ac,g,h). *P < 0.05, **P < 0.01, ***P < 0.001, ****P < 0.0001; exact P values are provided in the Source Data. dpm, disintegrations per minute.
Fig. 7 |
Fig. 7 |. Transfer of modified microbiome induces obesity resistance.
a, Experimental design. Lab mice were cohoused with antibiotic-treated wildlings for 2 weeks and then separated and bred. Their offspring (MM-lab) were used for experiments. b, PCoA (Jaccard distance) of 16S rRNA gene-profiling data of faecal samples from wildlings, lab mice and MM-lab mice. c, Weight gain of female wildlings, lab mice and MM-lab mice on HFD. Data from lab mice and wildling mice are from Fig. 1b; n = 25 MM-lab mice on HFD, n = 55 lab mice on HFD, n = 60 wildlings on HFD. Data are presented as mean values ± s.e.m. d, Weight of n = 25 female MM-lab mice and n = 10 wildlings after 10 weeks of HFD. Box plot shows median, IQR (box), and 75th and 25th percentiles (whiskers) (two-sided Mann–Whitney U test). eg, Shotgun metagenomic sequencing data of the caecal microbiome from 12-day-old pups (n = 5 wildlings, n = 4 MM-lab mice, n = 6 lab mice): PCoA (e); heat map showing microbial LKTs that are equally shared between MM-lab mice and wildlings and significantly different to lab mice (f); alpha diversity expressed as inverse Simpson index (g). Ellipses show 95% confidence interval (b, e). Box plots show median (centre line), 75th (upper limit of box) and 25th percentiles (lower limit of box) and outliers (whiskers) if values do not exceed 1.5 × interquartile range (d,g). Two-sided Wilcoxon rank sum test. *P < 0.05, **P < 0.01; exact P values are provided in the Source Data.

Comment in

References

    1. WHO. The Global Health Observatory https://www.who.int/data/gho/data/themes/mortality-and-global-health-est... (2020).
    1. Flegal KM, Kruszon-Moran D, Carroll MD, Fryar CD & Ogden CL Trends in obesity among adults in the united states, 2005 to 2014. JAMA 315, 2284–2291 (2016). - PMC - PubMed
    1. Ogden CL et al. Trends in obesity prevalence among children and adolescents in the united states, 1988–1994 through 2013–2014. JAMA 315, 2292–2299 (2016). - PMC - PubMed
    1. Shreiner AB, Kao JY & Young VB The gut microbiome in health and in disease. Curr. Opin. Gastroenterol. 31, 69–75 (2015). - PMC - PubMed
    1. Belkaid Y & Hand TW Role of the microbiota in immunity and inflammation. Cell 157, 121–141 (2014). - PMC - PubMed

Publication types