. 2022 Jan;87(1):120-137.
doi: 10.1002/mrm.28970. Epub 2021 Aug 21.

Free-breathing multitasking multi-echo MRI for whole-liver water-specific T1 , proton density fat fraction, and R2 quantification

Affiliations

Free-breathing multitasking multi-echo MRI for whole-liver water-specific T1 , proton density fat fraction, and R2 quantification

Nan Wang et al. Magn Reson Med. 2022 Jan.

Abstract

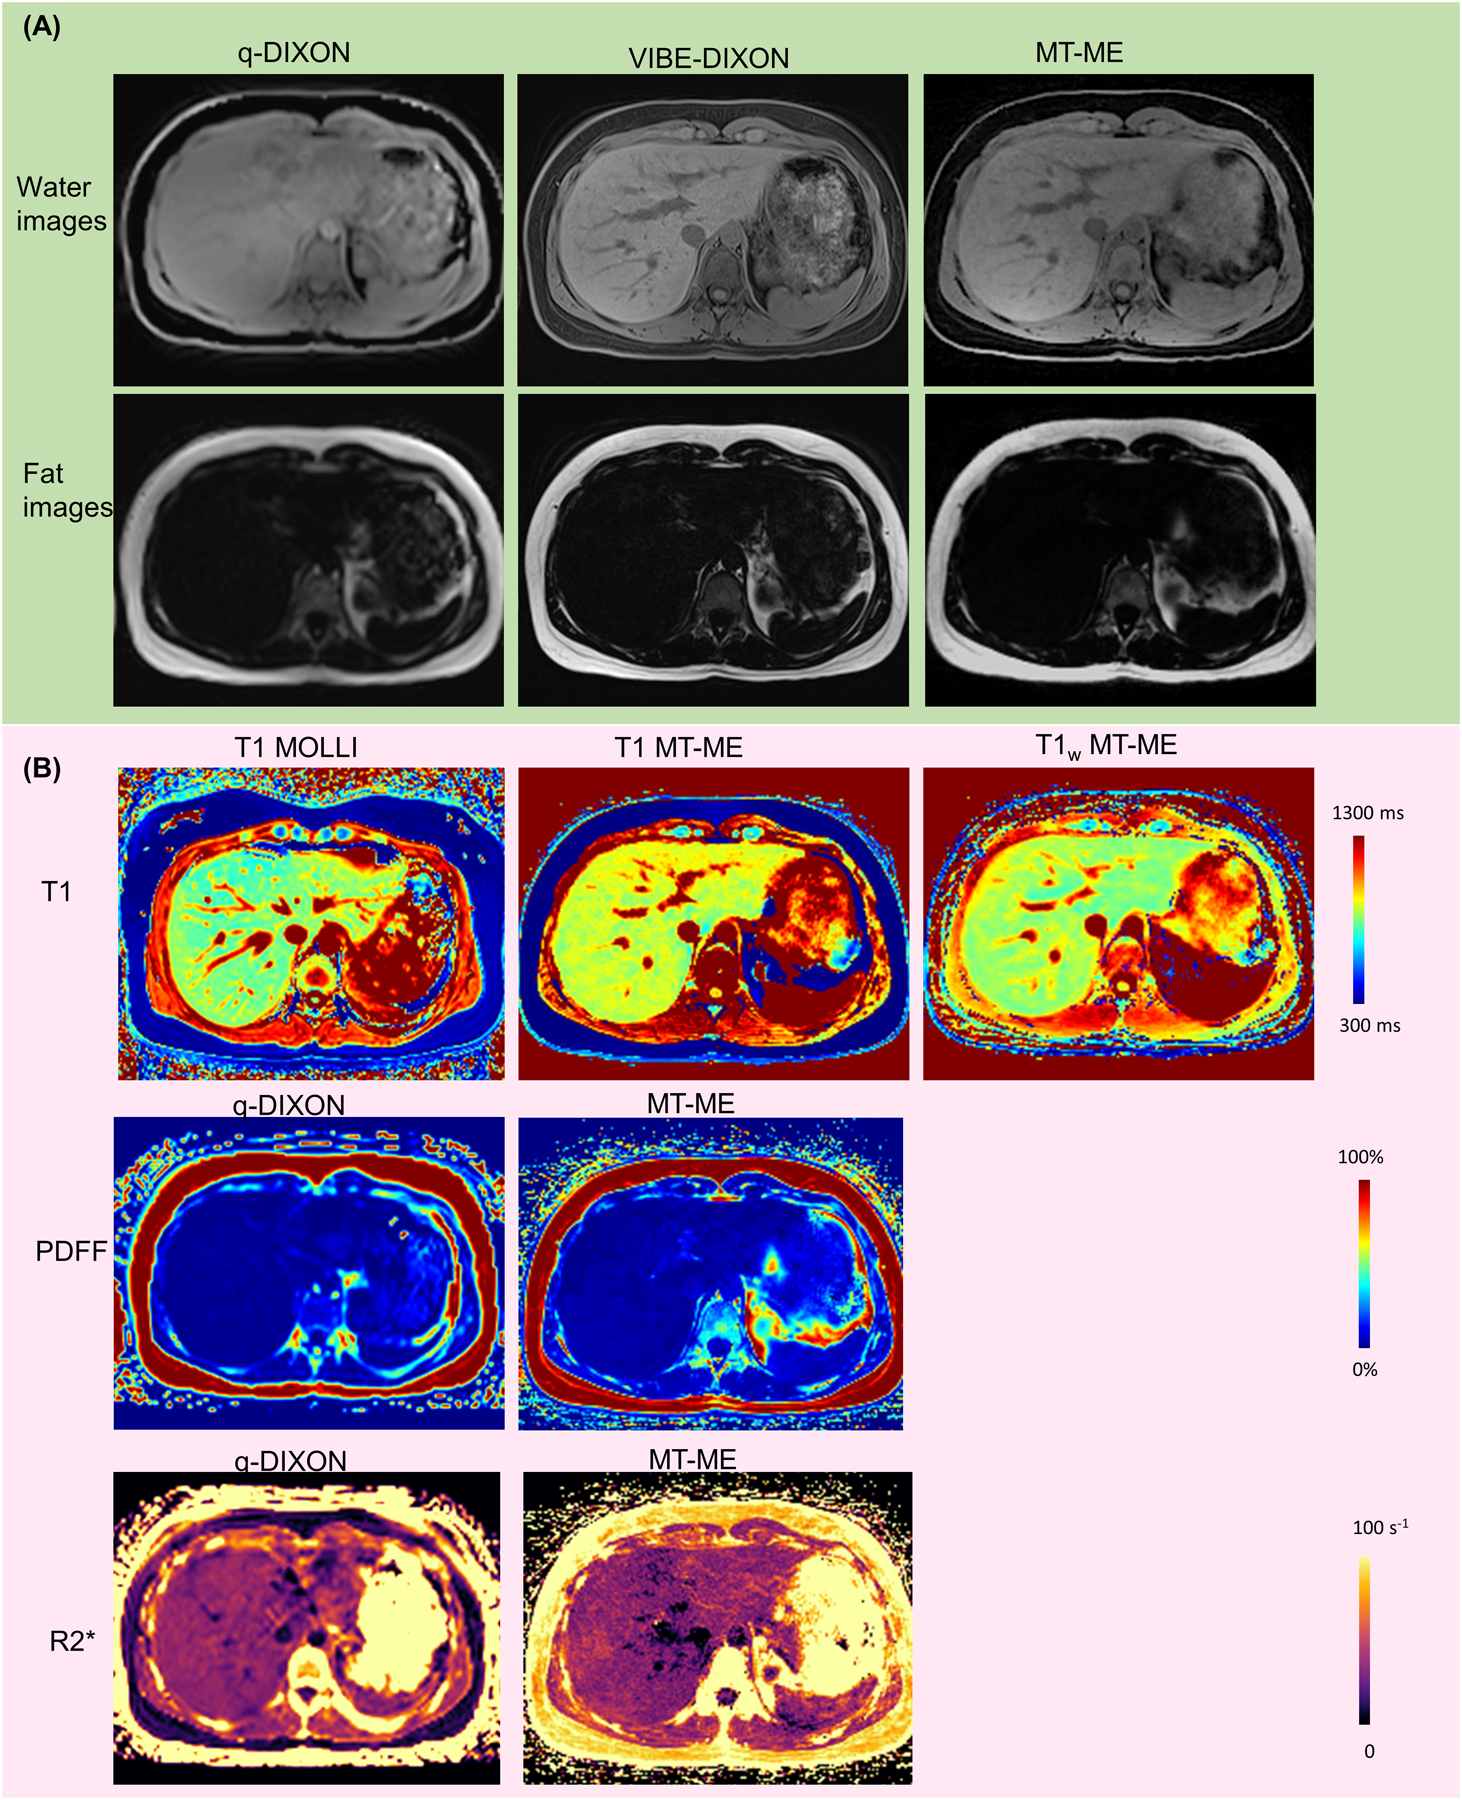
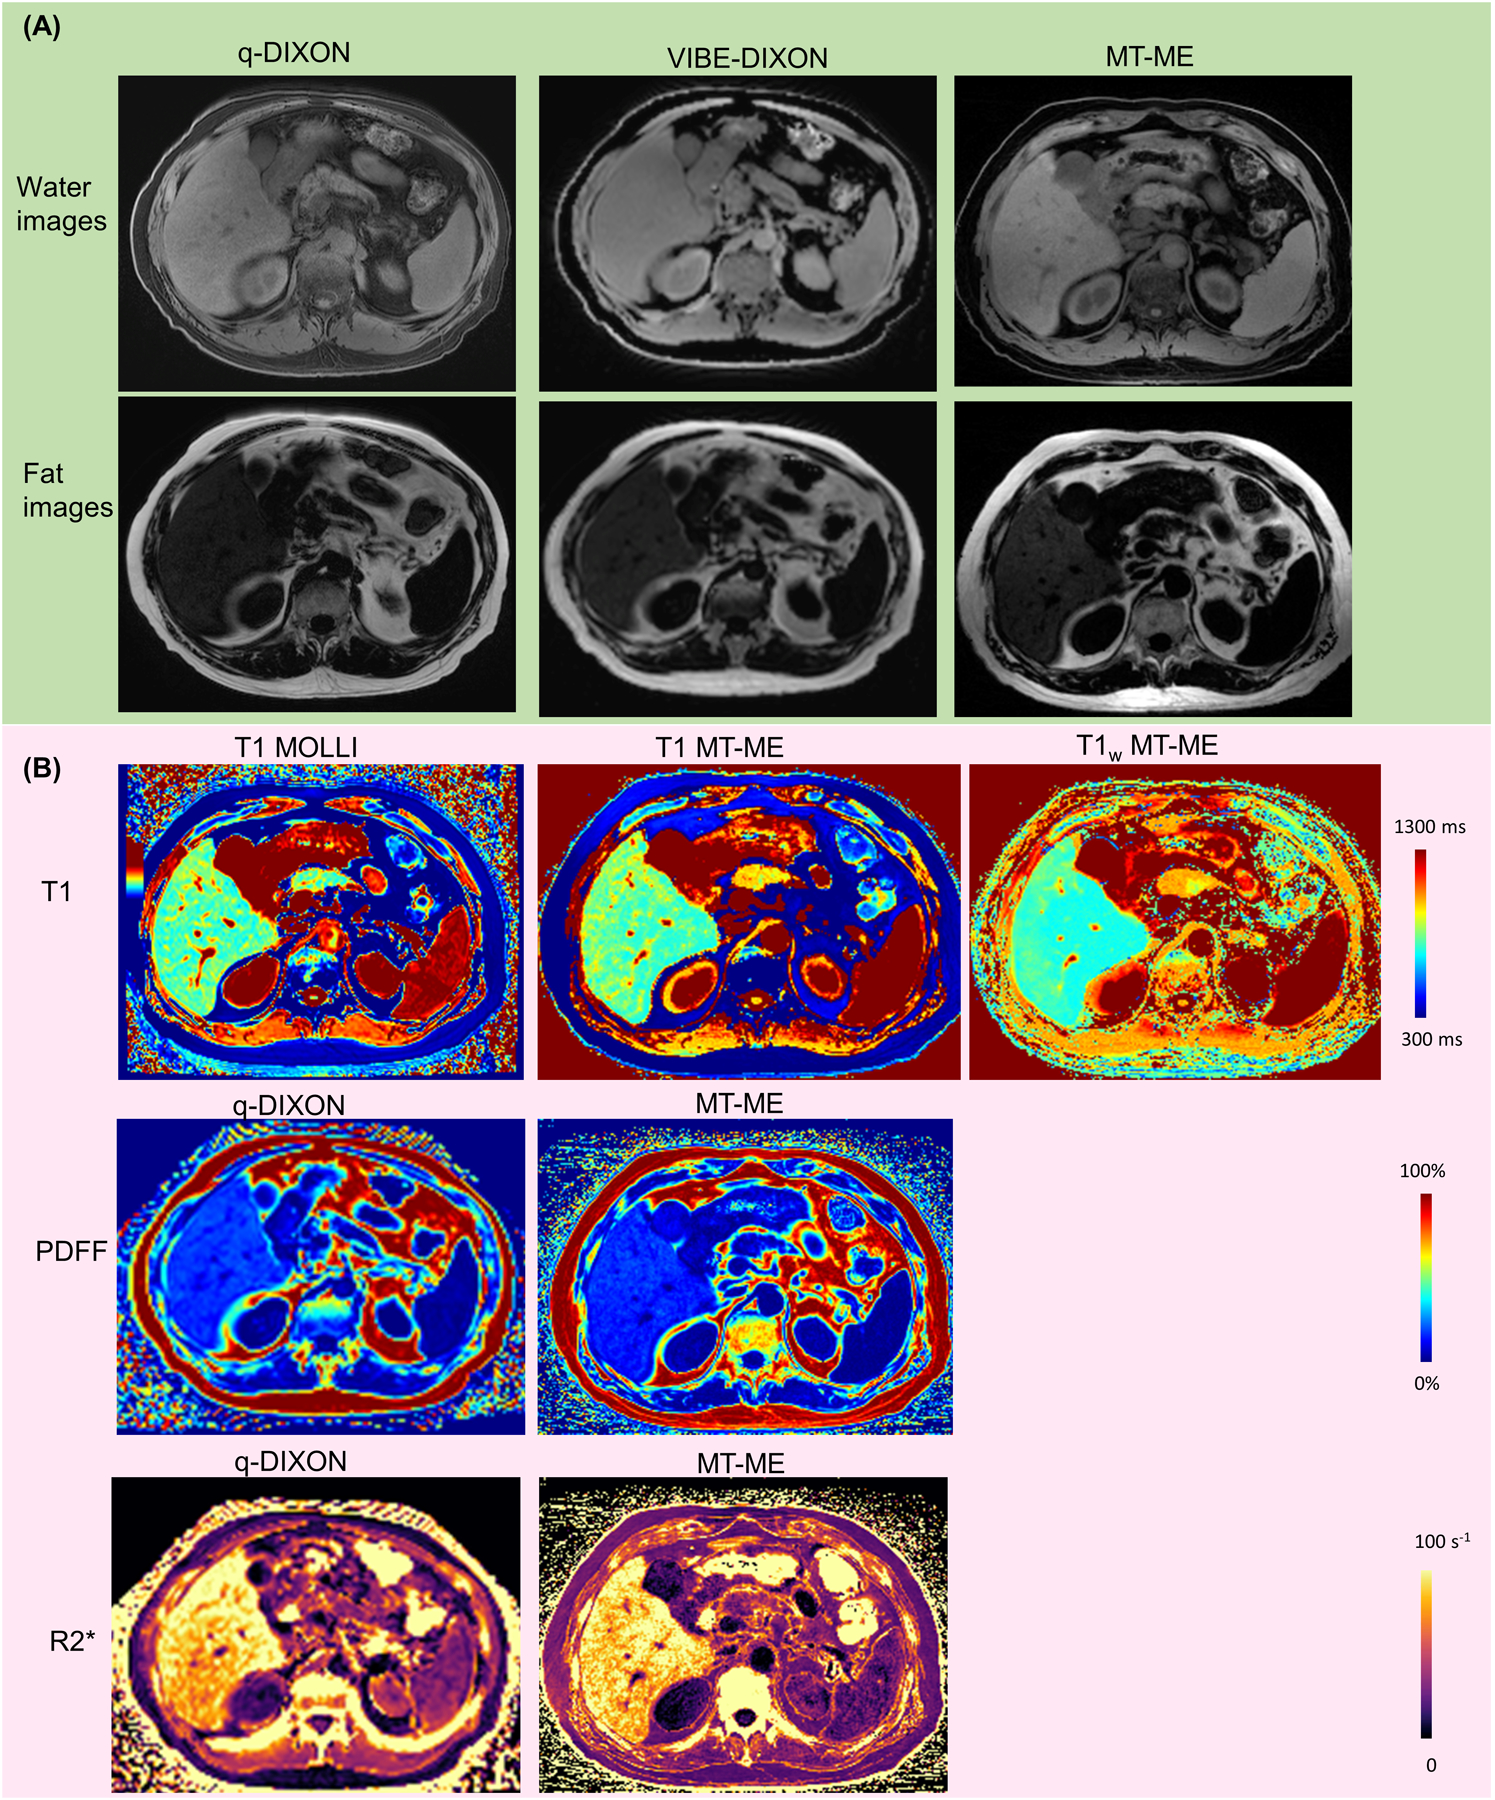
Purpose: To develop a 3D multitasking multi-echo (MT-ME) technique for the comprehensive characterization of liver tissues with 5-min free-breathing acquisition; whole-liver coverage; a spatial resolution of 1.5 × 1.5 × 6 mm3 ; and simultaneous quantification of T1 , water-specific T1 (T1w ), proton density fat fraction (PDFF), and R2 .

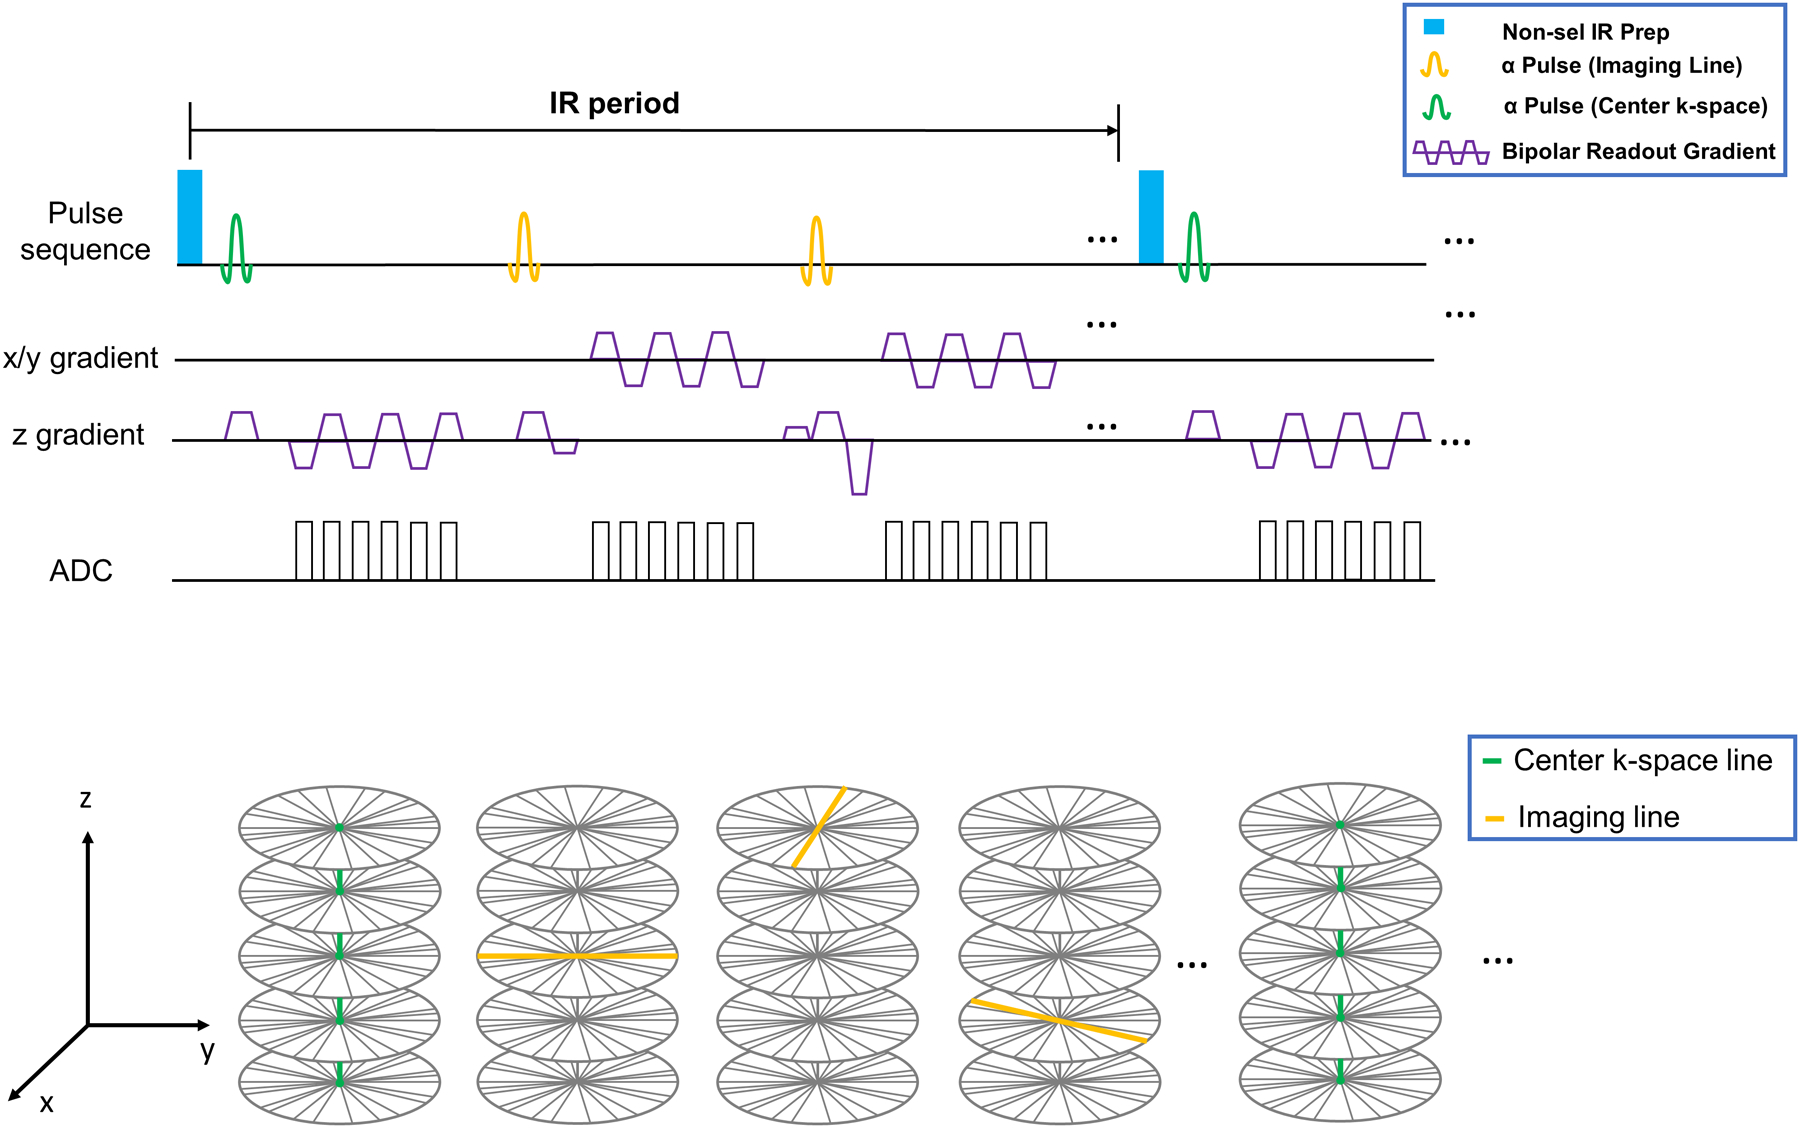
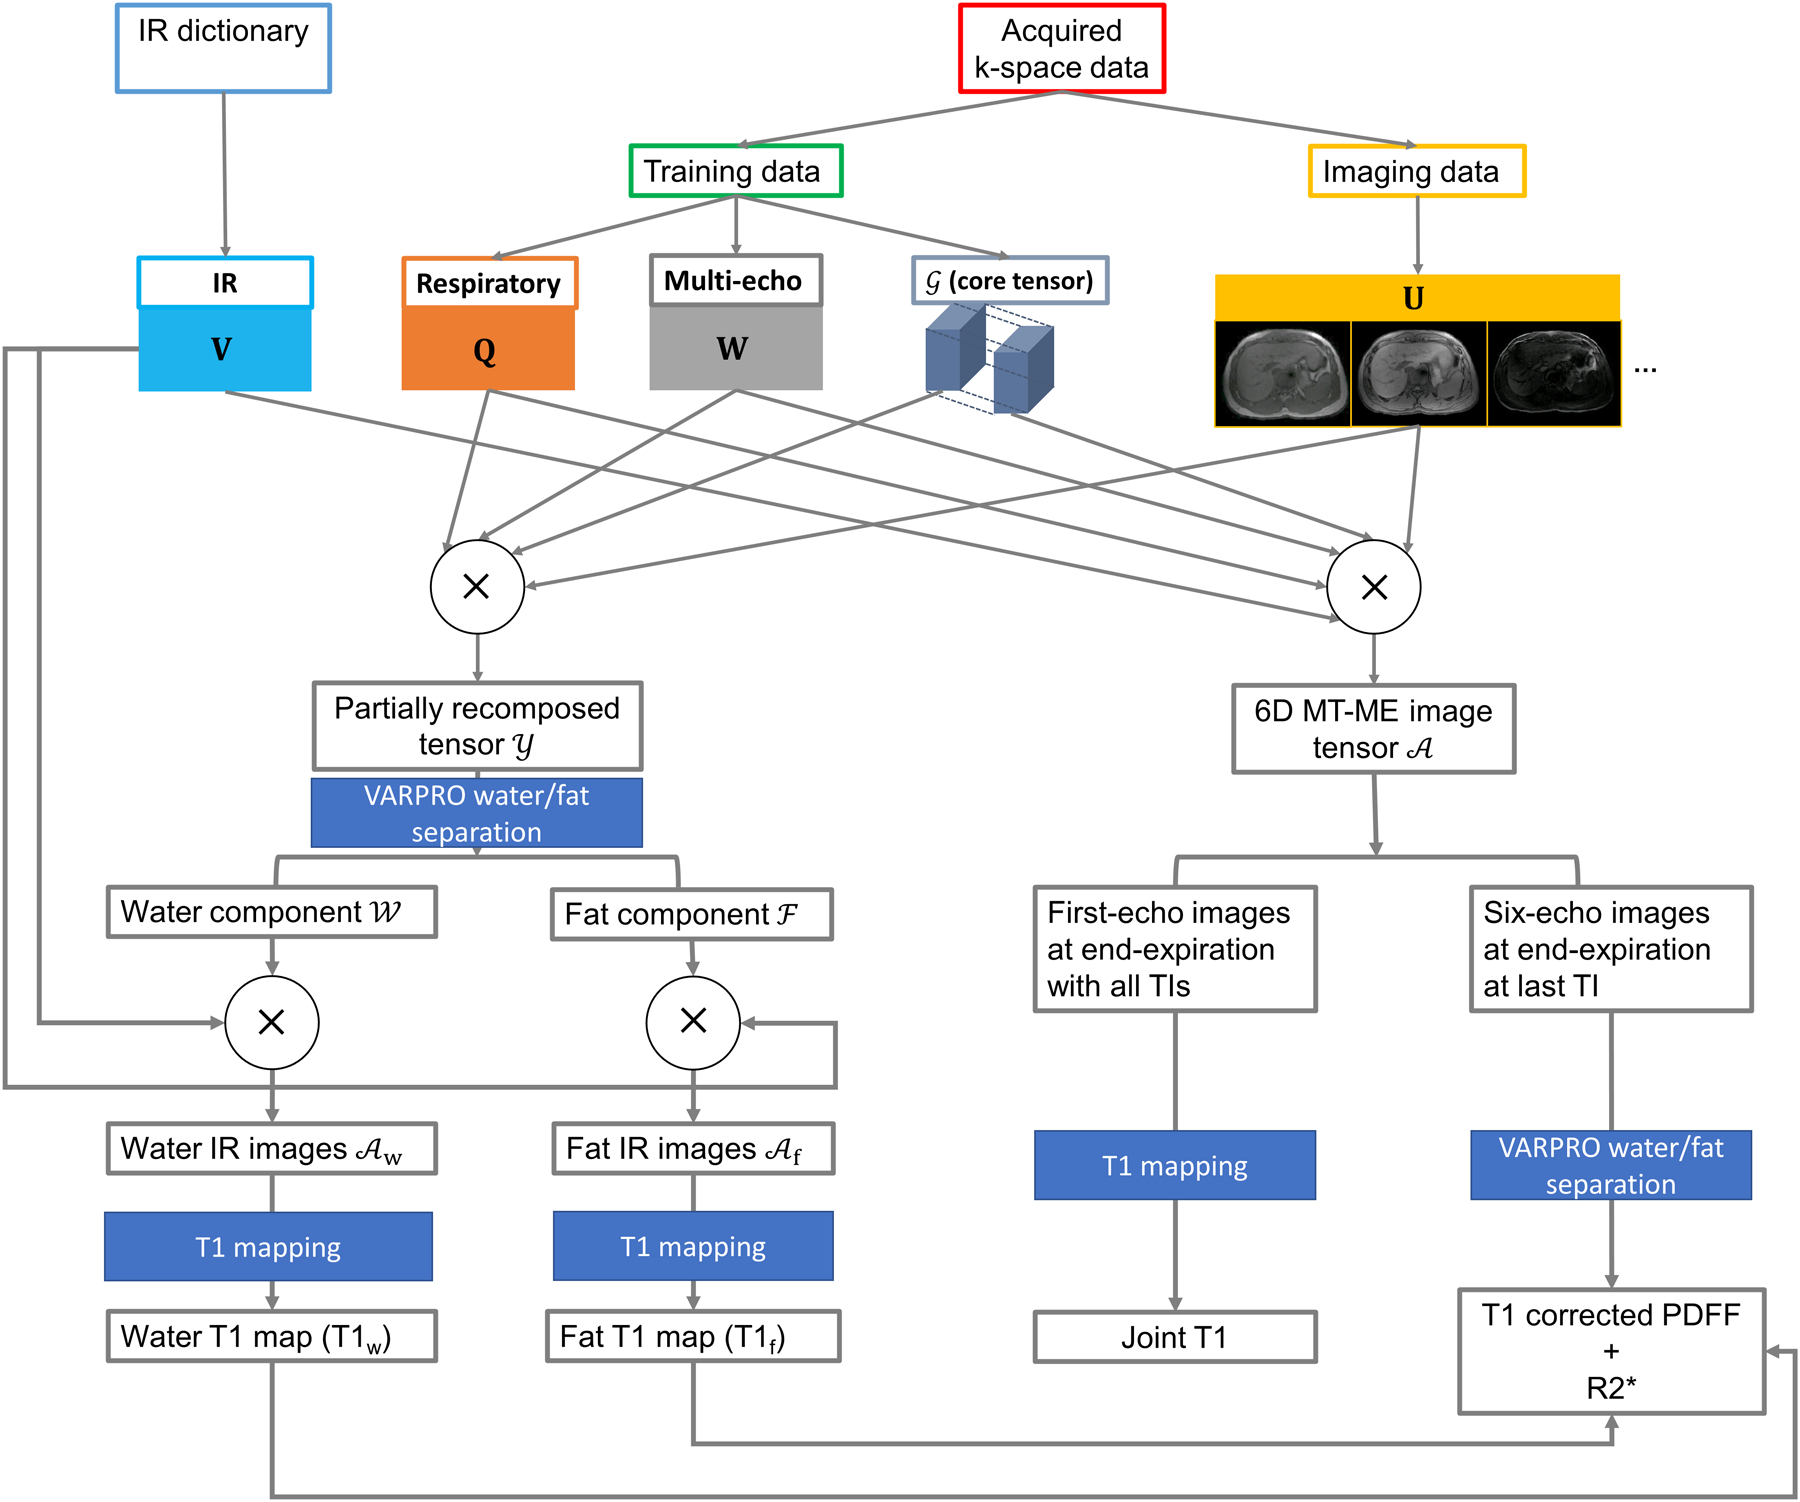
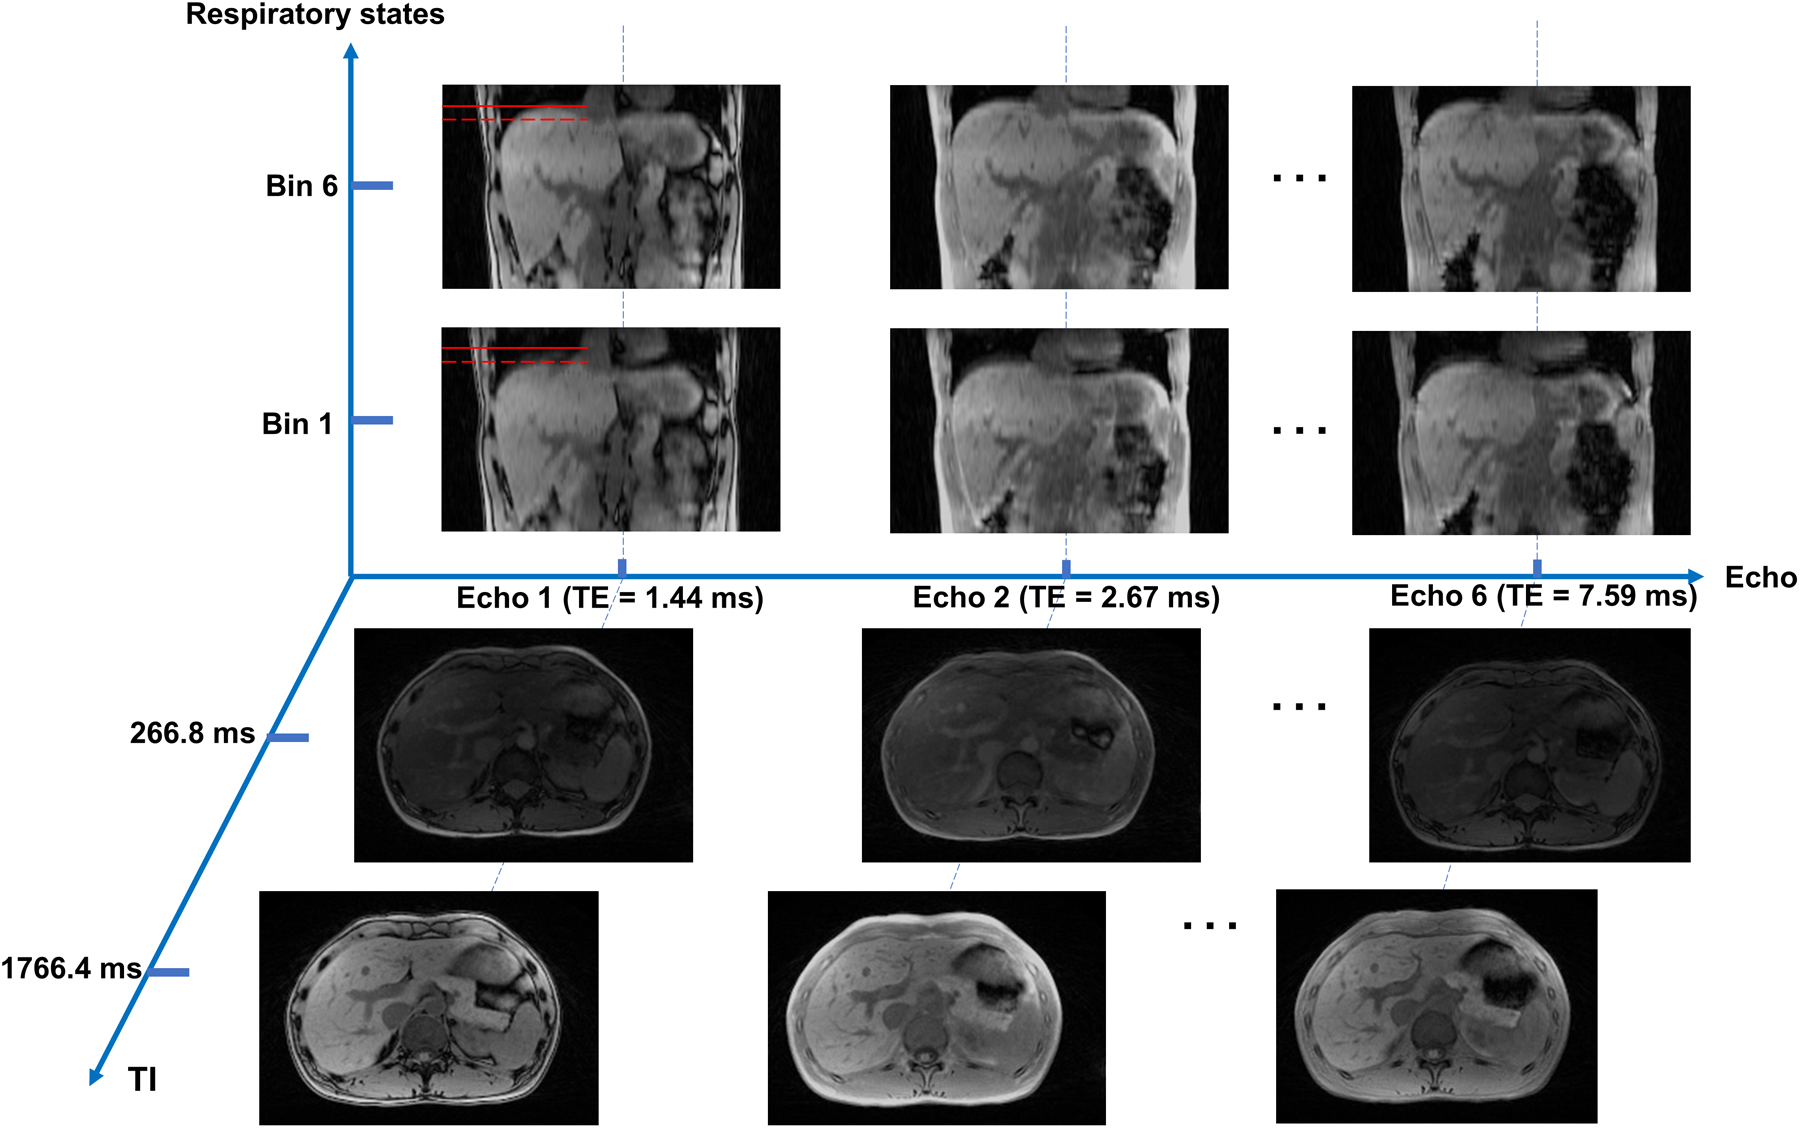
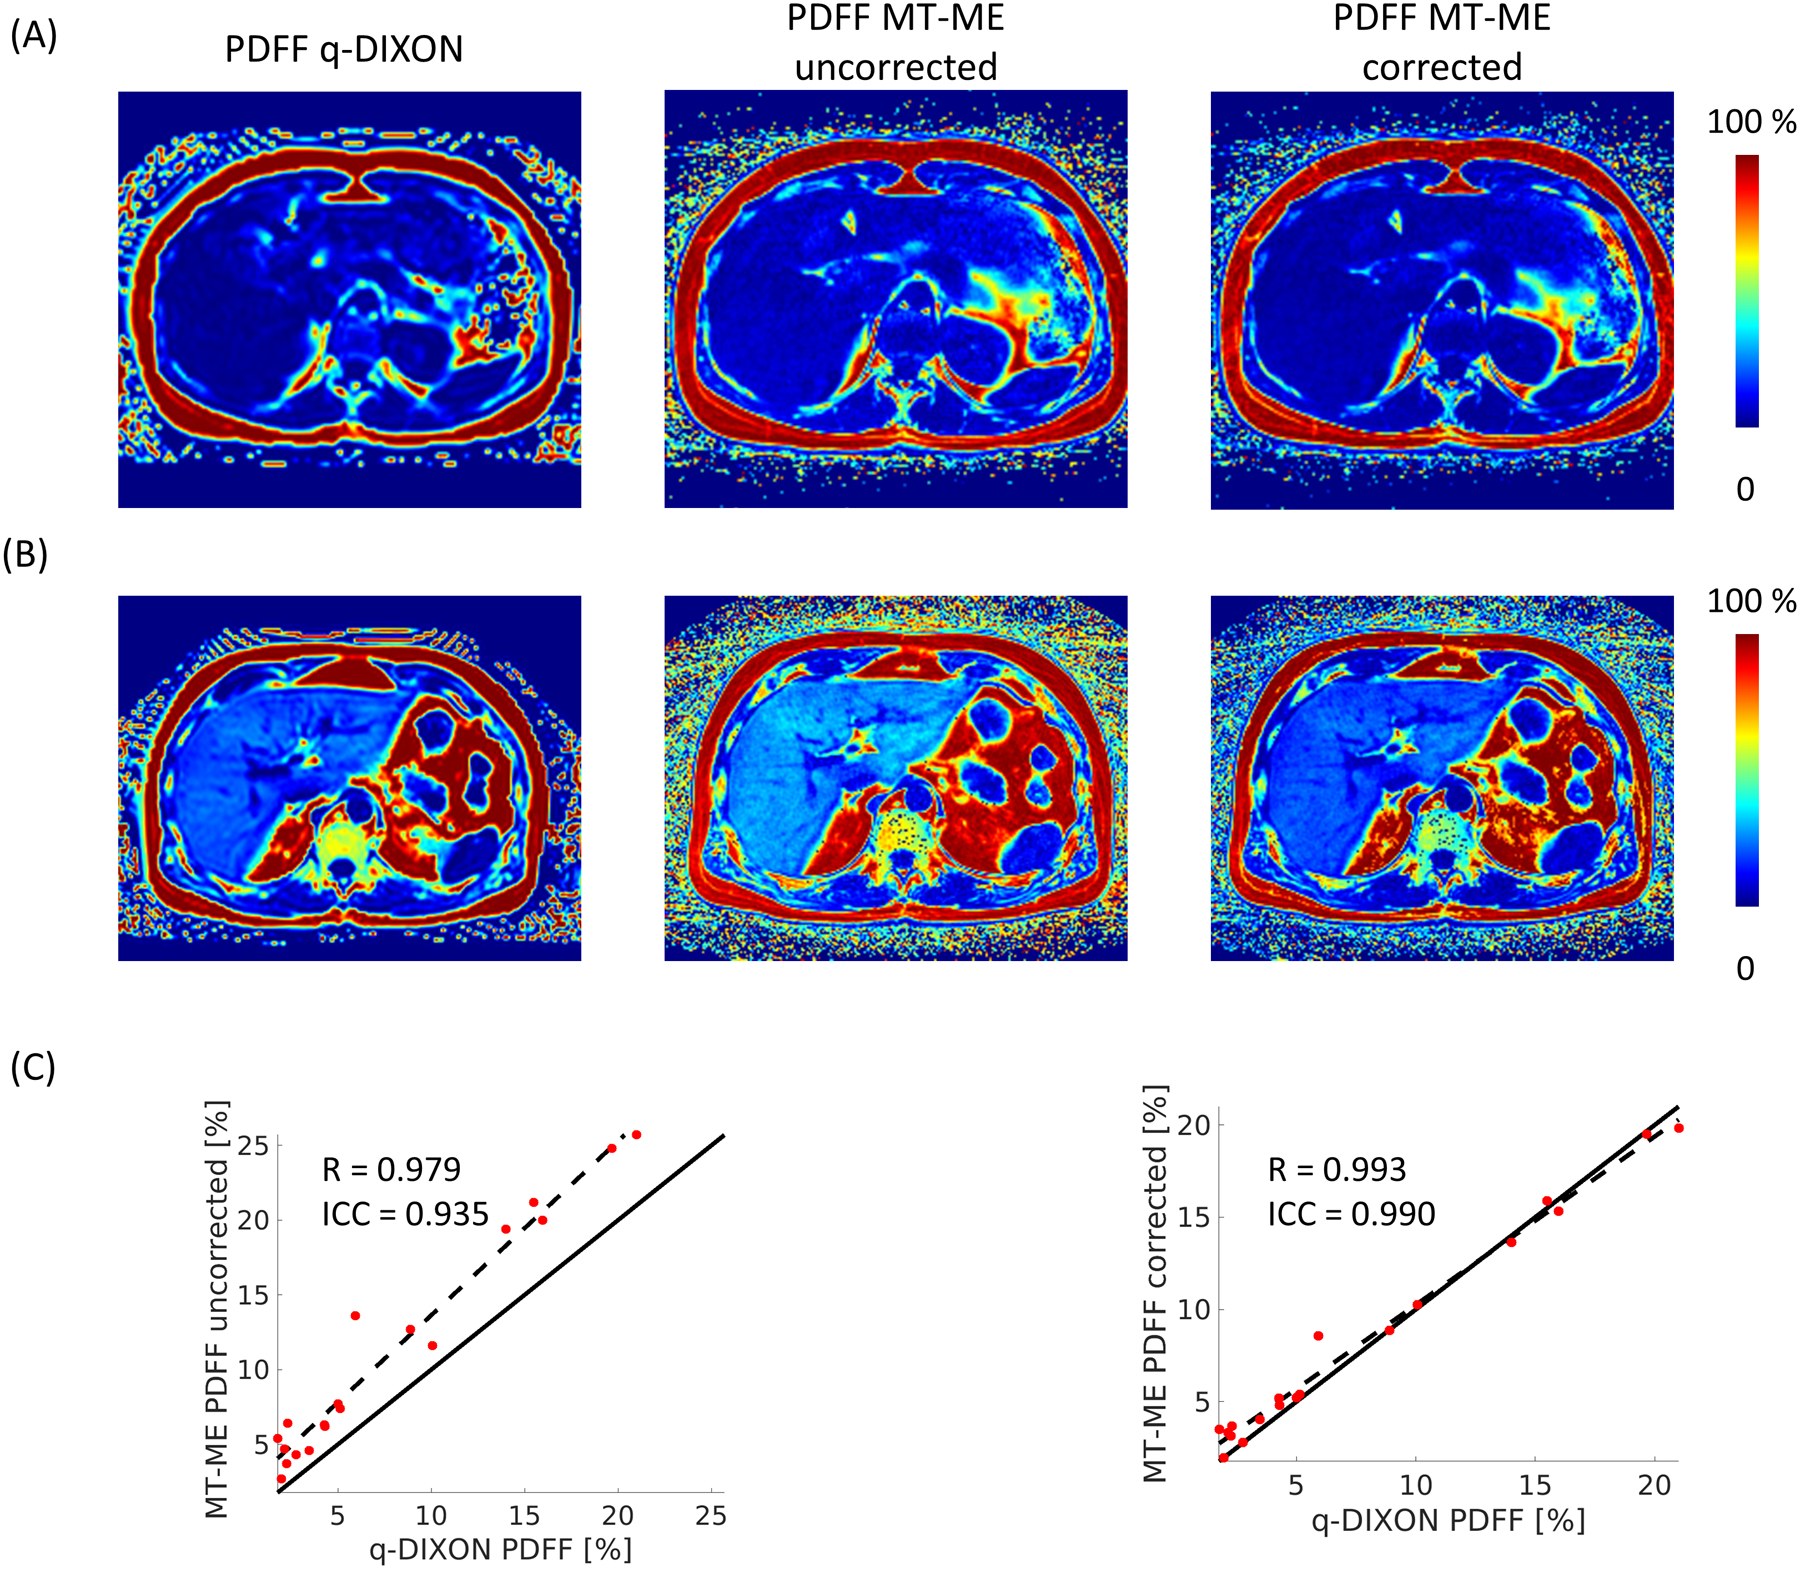
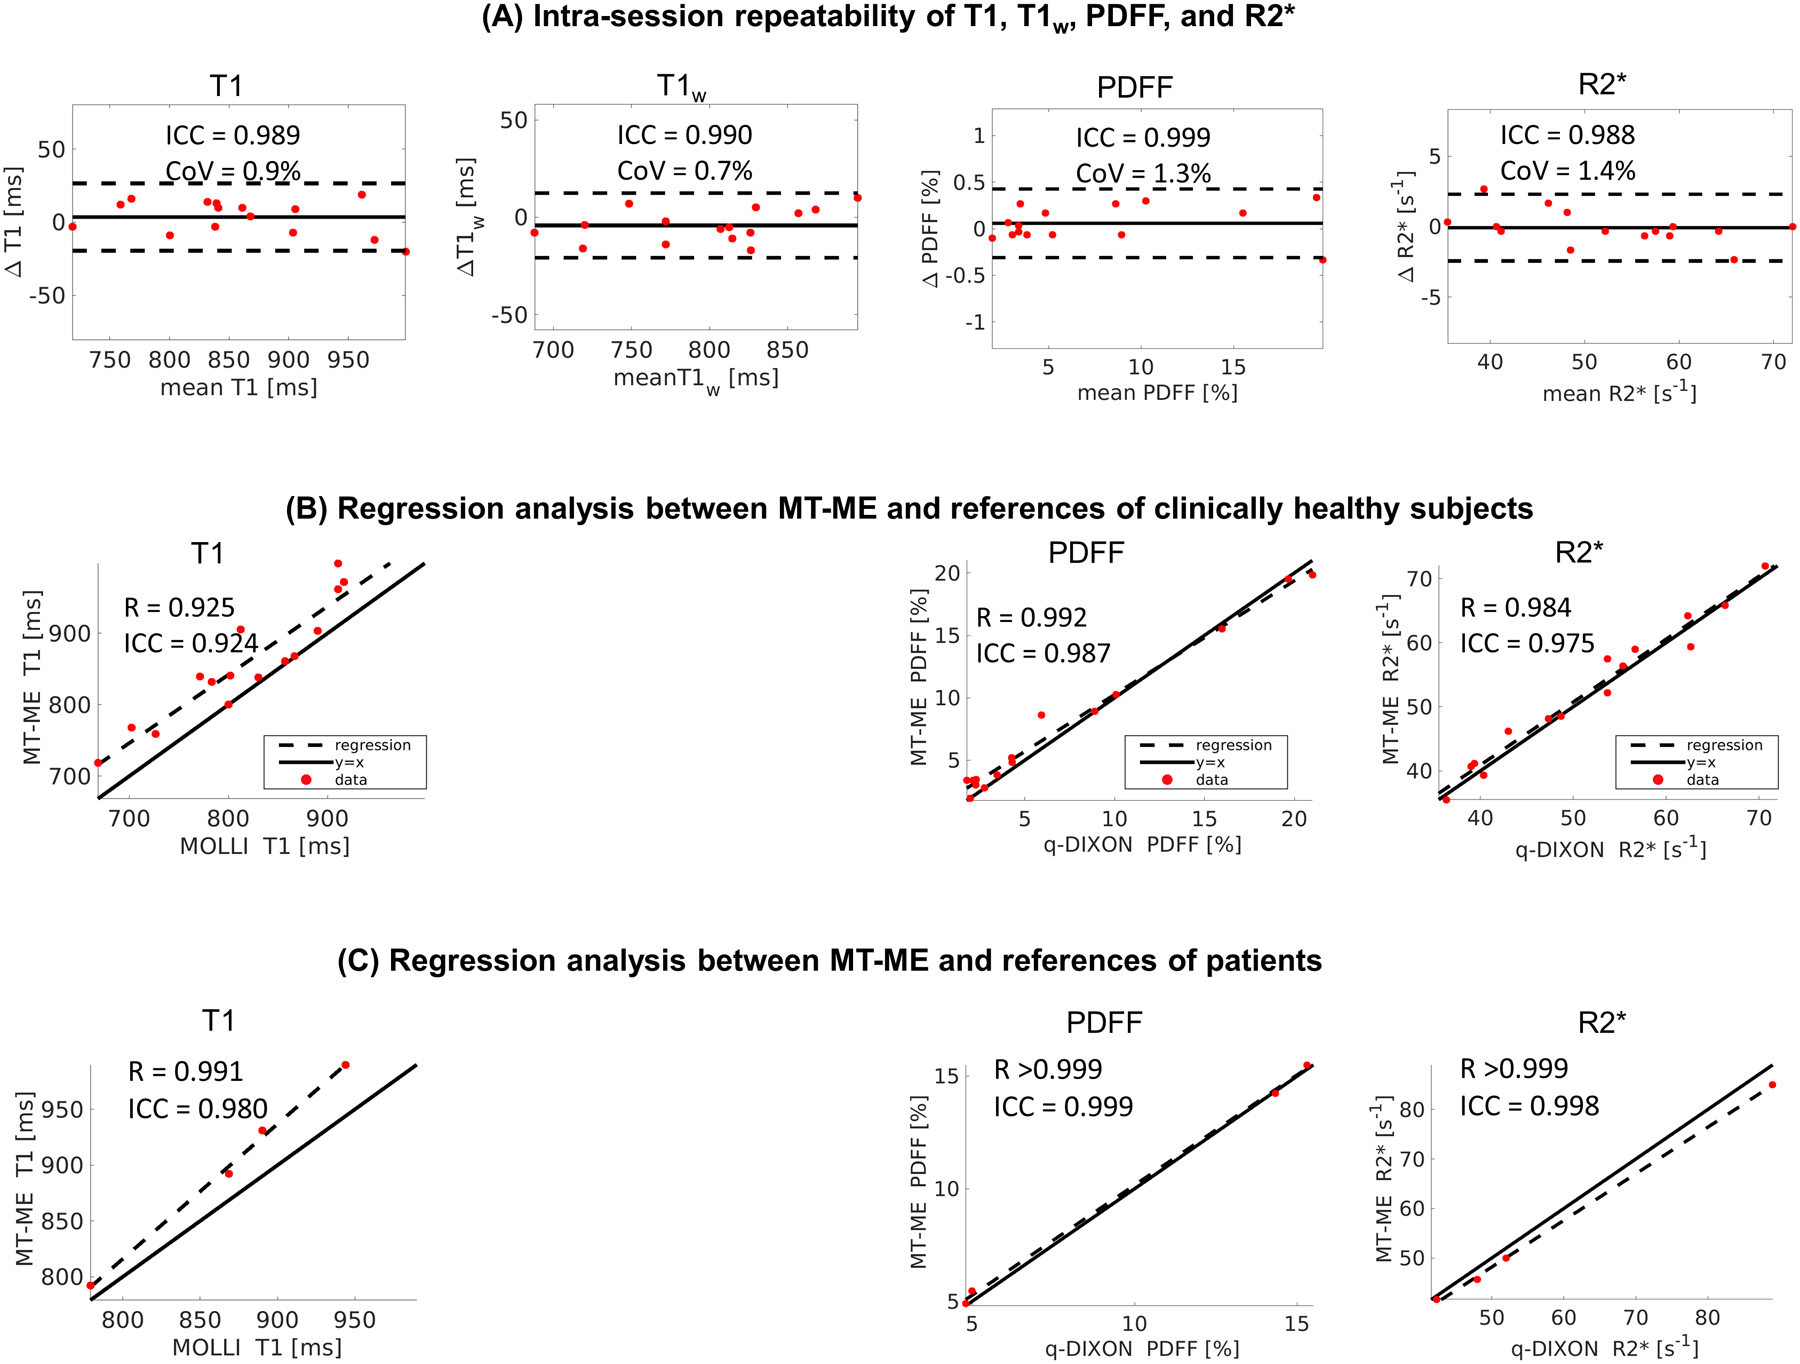
Methods: Six-echo bipolar spoiled gradient echo readouts following inversion recovery preparation was performed to generate T1 , water/fat, and R2 contrast. MR multitasking was used to reconstruct the MT-ME images with 3 spatial dimensions: 1 T1 recovery dimension, 1 multi-echo dimension, and 1 respiratory dimension. A basis function-based approach was developed for T1w quantification, followed by the estimation of R2 and T1 -corrected PDFF. The intrasession repeatability and agreement against references of MT-ME measurements were tested on a phantom and 15 clinically healthy subjects. In addition, 4 patients with confirmed liver diseases were recruited, and the agreement between MT-ME measurements and references was assessed.

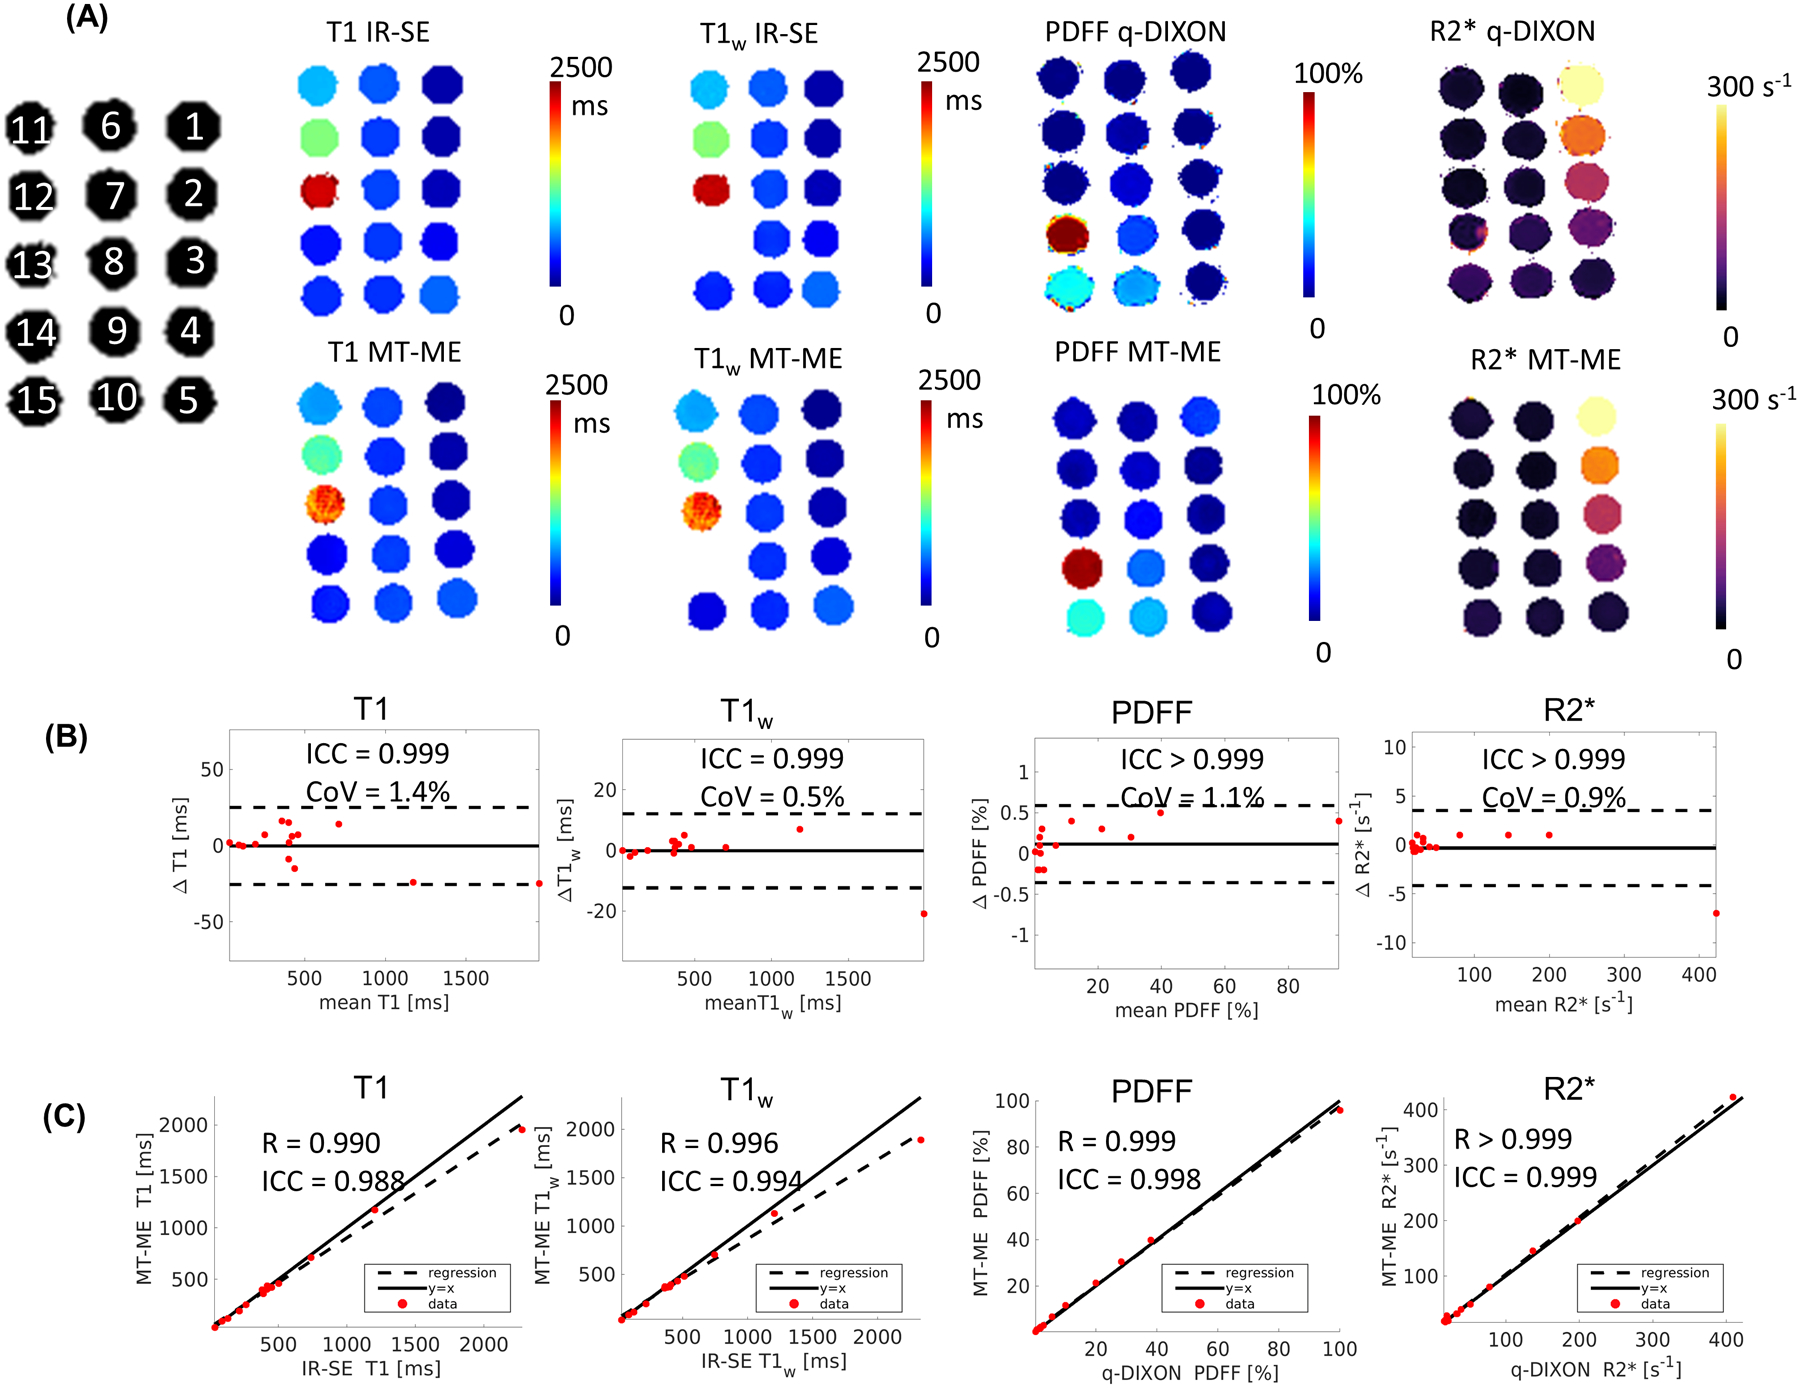
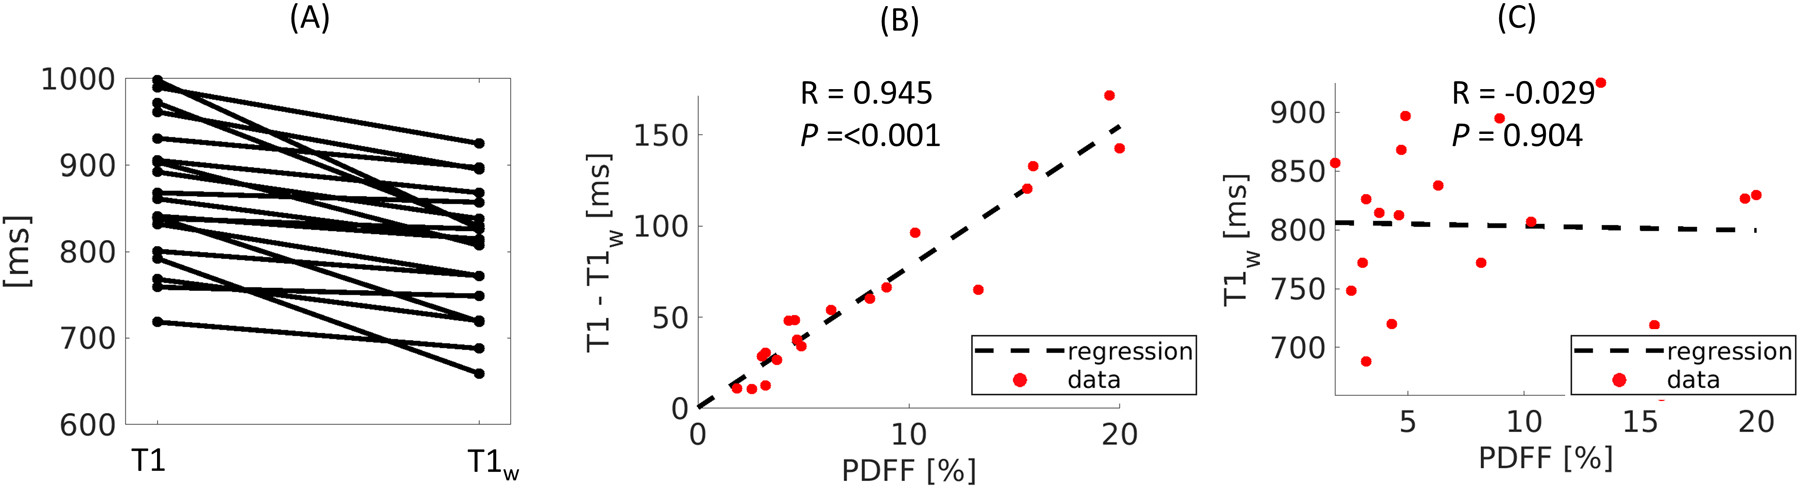
Results: MT-ME produced high-quality, coregistered T1 , T1w , PDFF, and R2 maps with good intrasession repeatability and substantial agreement with references on phantom and human studies. The intra-class coefficients of T1 , T1w , PDFF, and R2 from the repeat MT-ME measurements on clinically healthy subjects were 0.989, 0.990, 0.999, and 0.988, respectively. The intra-class coefficients of T1 , PDFF, and R2 between the MT-ME and reference measurements were 0.924, 0.987, and 0.975 in healthy subjects and 0.980, 0.999, and 0.998 in patients. The T1w was independent to PDFF (R = -0.029, P = .904).

Conclusion: The proposed MT-ME technique quantifies T1 , T1w , PDFF, and R2 simultaneously and is clinically promising for the comprehensive characterization of liver tissue properties.

Keywords: MR multitasking; free-breathing acquisition; liver T1/PDFF/R2 mapping; low-rank tensor; water-specific T1.


Figures

Figure 1:
Figure 1:
(A) Pulse sequence diagram for the proposed MT-ME technique. Non-selective inversion recovery(IR) preparation pulse is applied periodically followed by 3D SPGR readouts. Six-echo bipolar gradients were used for data collection. The center k-space readout was set on kz (superior-inferior) direction. Pre-phaser and spoiler of readout was not included in the simplified figure. (B): Simplified illustration of k-space sampling strategy. A stack-of-star sampling pattern with golden-angle in-plane and Gaussian-density randomized reordering in kz direction was implemented. The training data formed with center k-space lines was acquired every 8 readouts in kz (superior-inferior) direction for better capture of respiratory motion. Rest of the data forms the imaging data.
Figure 2:
Figure 2:
Flow chart of the reconstruction of MT-ME images and the quantification of T1, T1w, PDFF, and R2*.
Figure 3:
Figure 3:
Phantom Measurements. (A) T1, T1w, PDFF, and R2* maps from reference sequences and MT-ME. The Inversion-recovery spin-echo (IR-SE) sequence without and with water excitation were used as reference for joint and water-specific T1. q-DIXON provided the reference for PDFF and R2*. The quantitative maps from MT-ME showed great agreement with references. (B) Bland-Altman plots shows good repeatability of T1, T1w, PDFF, and R2* estimated with MT-ME. (C) Good correlation was demonstrated of T1, T1w, PDFF, and R2* from MT-ME and reference with high Pearson correlation coefficient R and ICC, as labeled on each plot.
Figure 4:
Figure 4:
Demonstration of MT-ME images with three spatial dimensions and three temporal dimensions (IR dimension, multi-echo dimension, and respiratory dimension). The images of end-inspiration and end-expiration were displayed in coronal view at the last TI of echo1, echo 2, and echo 6. The red solid reference line on images of echo 1 is the position of liver dome at end-expiration, while the dashed reference line is the position at end-inspiration. Images of different TI times (266.8 ms and 1766.4 ms) were displayed in axial view. The liver and vessels were well delineated.
Figure 5:
Figure 5:
Representative anatomical water/fat images and T1, T1w, PDFF, and R2* maps from a clinically healthy 29-year-old volunteer. (A) Water and fat images from q-DIXON, VIBE-DIXON, and MT-ME. Vessels can be well defined on water images of MT-ME and VIBE-DIXON. (B) Good consistency was showed between MT-ME maps and references. The in vivo T1 reference was 2D MOLLI with a 11-second breath-hold, while the PDFF and R2* reference was q-DIXON with 12-second breath hold. The T1w reference was not available.
Figure 6:
Figure 6:
Representative water/fat images and T1, T1w, PDFF, and R2* maps from a 64-year-old patient with NASH. (A) Water and fat images from q-DIXON, VIBE-DIXON, and MT-ME. (B) T1, T1w, PDFF and R2* maps. The mean T1, PDFF, and R2* of reference were 779 ms, 15.5%, 89 s−1, respectively, while the mean T1, T1w, PDFF, and R2* measured from MT-ME were 785 ms, 643 ms, 15.5%, and 85 s−1.
Figure 7:
Figure 7:
The significance of T1 correction in the estimation of PDFF. Two in vivo examples are display in (A) and (B). Without T1 correction (middle panel of A and B), the PDFF estimated from MT-ME is higher than q-DIXON reference. With correction (right panel of A and B), the PDFF estimated from MT-ME matches well with q-DIXON results. (C) the regression analysis between uncorrected MT-ME PDFF and q-DIXON shows R = 0.979, ICC = 0.935; the regression between corrected MT-ME PDFF and q-DIXON shows improved correlation R = 0.993 and increased ICC = 0.990.
Figure 8:
Figure 8:
(A) Bland-Altman plots demonstrated a good intra-session repeatability of the multiparametric mapping from MT-ME. The overall intra-session differences for T1 and T1w were less than 3%, while the differences for PDFF and R2* were less than 10%. (B) The regression analysis of T1, PDFF, and R2* measured with MT-ME and references showed good agreement in the clinically healthy subjects. The Pearson correlation coefficient R was 0.990, 0.976, and 0.953, respectively. (C) The regression analysis of T1, PDFF, and R2* measured with MT-ME and references showed good agreement in patients. The Pearson correlation coefficient R was 0.998, >0.999, and >0.999, respectively.
Figure 9:
Figure 9:
(A) Dot-line diagram of the relation between T1 and T1w estimated on all subjects using MT-ME. The T1w appears lower than joint T1 in all subjects. (B) regression of the differences of T1 and T1w against PDFF. A significantly strong correlation with R = 0.960, P < 0.001 is demonstrated. (C) No correlation was found between T1w against PDFF, with R = 0.016, P = 0.781.

References

    1. Younossi Z, Anstee QM, Marietti M, et al. Global burden of NAFLD and NASH: trends, predictions, risk factors and prevention. Nat Rev Gastro Hepat. January 2018; 15(1):11–20. - PubMed
    1. Younossi Z, Tacke F, Arrese M, et al. Global Perspectives on Nonalcoholic Fatty Liver Disease and Nonalcoholic Steatohepatitis. Hepatology. June 2019;69(6):2672–2682. - PubMed
    1. Tsochatzis EA, Bosch J, Burroughs AK. Liver cirrhosis. Lancet. May 17 2014; 383(9930):1749–61. - PubMed
    1. Schuppan D, Afdhal NH. Liver cirrhosis. Lancet. March 8 2008;371(9615):838–851. - PMC - PubMed
    1. Rockey DC, Caldwell SH, Goodman ZD, Nelson RC, Smith AD, American Association for the Study of Liver D. Liver biopsy. Hepatology. March 2009;49(3):1017–44. - PubMed

Publication types