. 2021 Sep 7;33(9):1853-1868.e11.
doi: 10.1016/j.cmet.2021.08.002. Epub 2021 Aug 20.

Extracellular vesicle-based interorgan transport of mitochondria from energetically stressed adipocytes

Affiliations

Extracellular vesicle-based interorgan transport of mitochondria from energetically stressed adipocytes

Clair Crewe et al. Cell Metab. .

Abstract

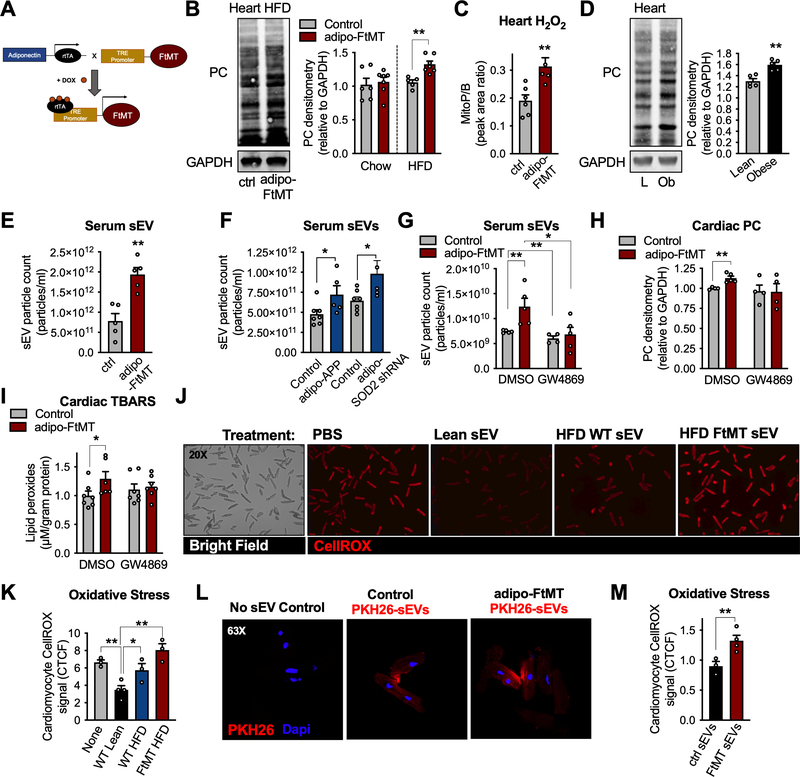
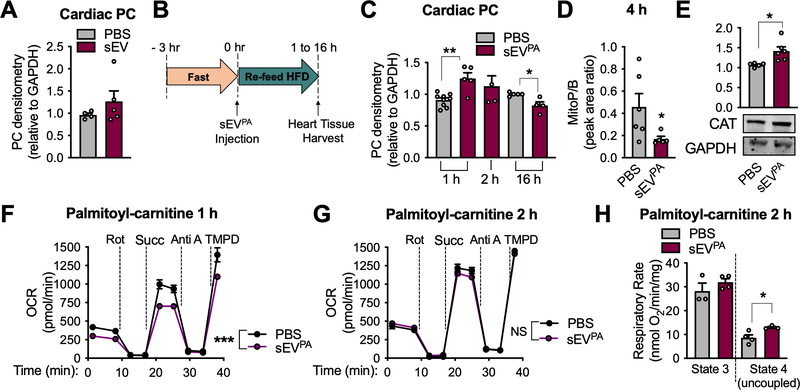
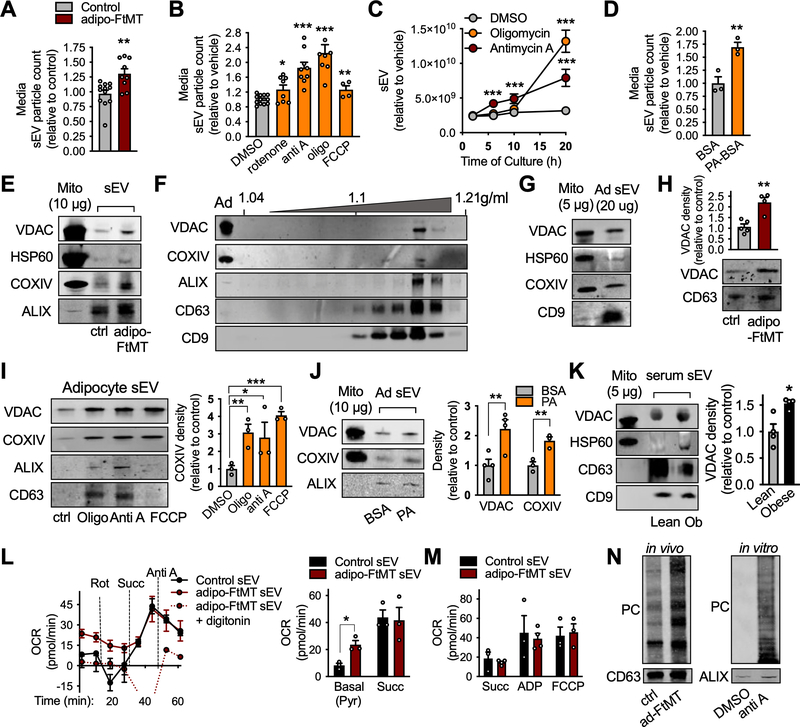
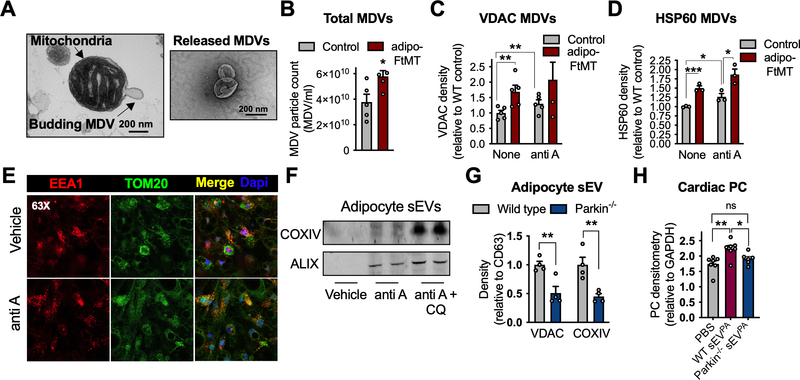
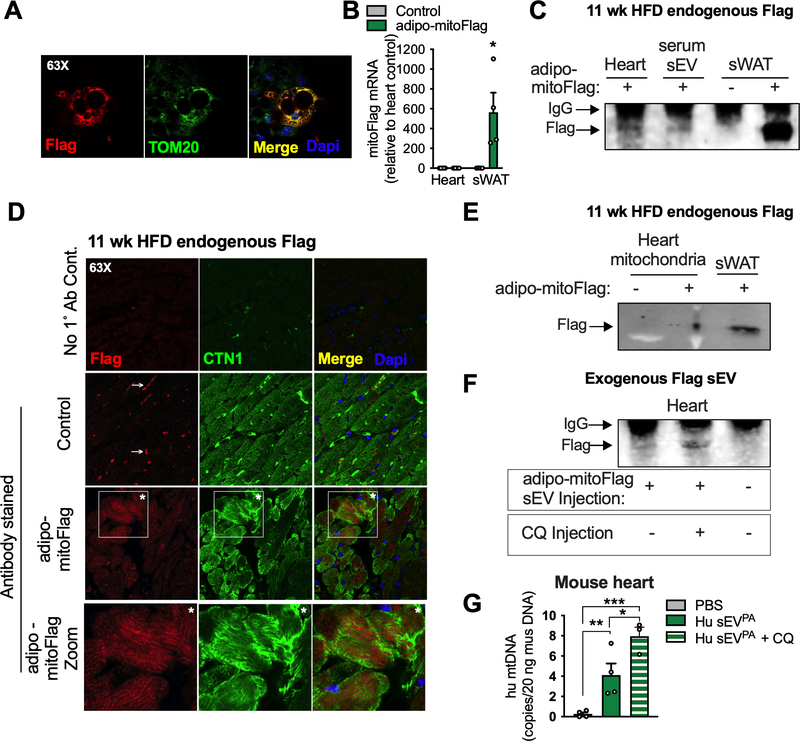
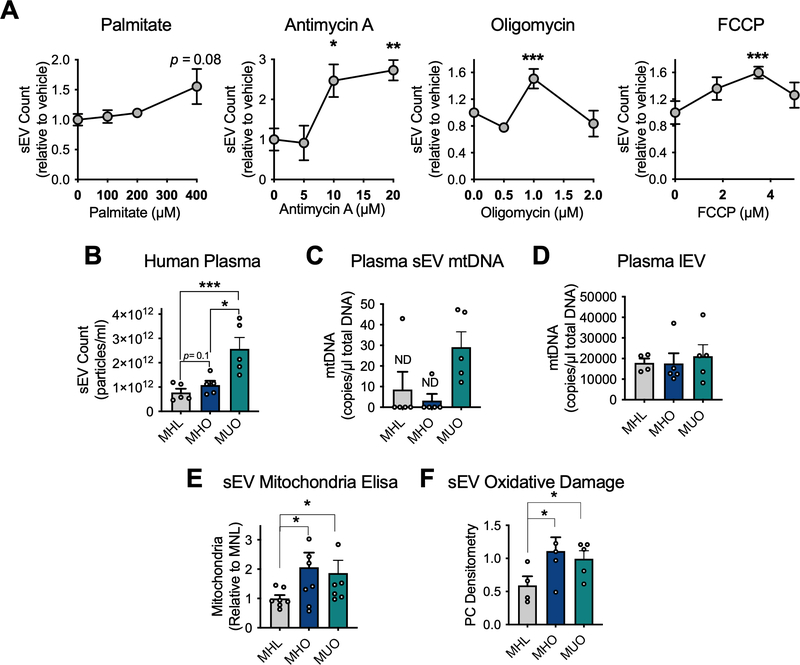
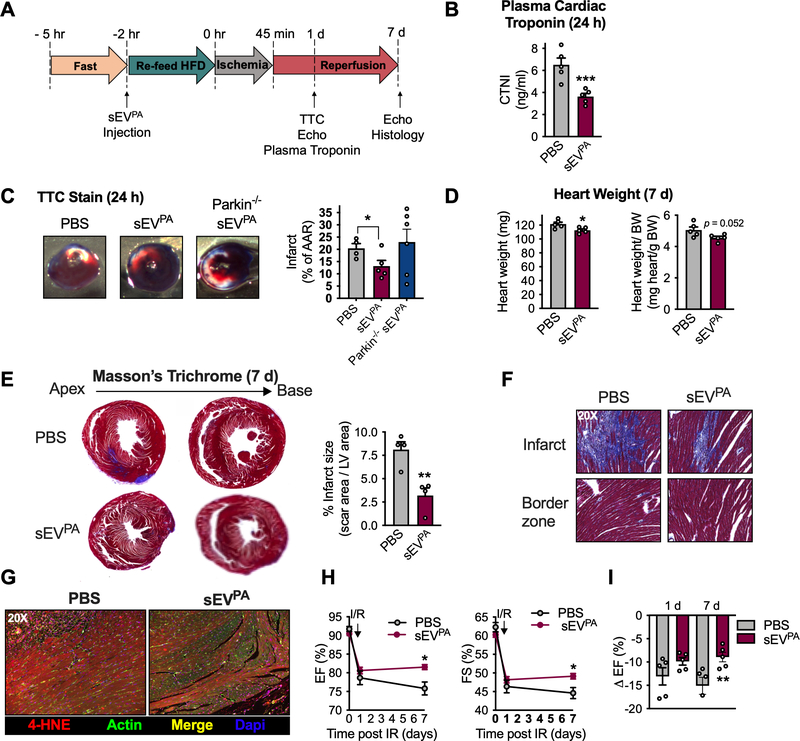
Adipocytes undergo intense energetic stress in obesity resulting in loss of mitochondrial mass and function. We have found that adipocytes respond to mitochondrial stress by rapidly and robustly releasing small extracellular vesicles (sEVs). These sEVs contain respiration-competent, but oxidatively damaged mitochondrial particles, which enter circulation and are taken up by cardiomyocytes, where they trigger a burst of ROS. The result is compensatory antioxidant signaling in the heart that protects cardiomyocytes from acute oxidative stress, consistent with a preconditioning paradigm. As such, a single injection of sEVs from energetically stressed adipocytes limits cardiac ischemia/reperfusion injury in mice. This study provides the first description of functional mitochondrial transfer between tissues and the first vertebrate example of "inter-organ mitohormesis." Thus, these seemingly toxic adipocyte sEVs may provide a physiological avenue of potent cardio-protection against the inevitable lipotoxic or ischemic stresses elicited by obesity.

Keywords: adipocyte; cardiovascular disease; diabetes; exosomes; extracellular vesicles; mitochondria; mitochondrial dysfunction; mitohormesis; obesity; stress response.


Conflict of interest statement

Declaration of interests The authors declare no competing interests.

Figures

Figure 1:
Figure 1:. Adipocyte-specific mitochondrial dysfunction induces mitochondrial oxidative stress in the heart via extracellular vesicles.
A, Mouse model schematic of adipocyte-specific, doxycycline (dox)-inducible overexpression of mitochondrial ferritin (FtMT). B, cardiac protein carbonylation (PC) assay, representative of n = 5, and quantification. Adipo-FtMT PC levels were normalized to their controls on respective diets so no comparisons can be made between dox-chow and dox-HFD. C, MitoB/P measurements in cardiac tissue following 3 weeks dox-HFD. D, PC measurements in cardiac tissue from lean and obese mice (20 wk HFD) E, Serum sEV quantification following 3 weeks of dox-HFD. F, Serum sEV count from adipo-APPβ or adipo-SOD2 shRNA mice on dox-HFD diet for 2 weeks. G-I, Control and adipo-FtMT mice were placed on dox-HFD for 4 hours and given an injection of either DMSO or GW4869. J and K, representative microscopy images and quantification (corrected total cell fluorescence; CTCF) of isolated cardiomyocytes stained with CellROX following 2 hours of sEV treatment as indicated. L, A representative confocal image and quantification of PHK26-labeled adipocyte-derived sEV uptake by mature cardiomyocytes in vitro. M, Quantification of CellROX signal in isolated cardiomyocytes 2 hours post sEV treatment as indicated. Data are presented as mean ± s.e.m. *P < 0.05, ** P < 0.01. See also Figure S1 and S2.
Figure 2:
Figure 2:. sEVs from palmitate-stressed adipocytes induce cardiac ROS in vivo
A, Protein carbonylation (PC) assay on cardiac tissue from chow-fed wild-type mice treated 2 hours after injection of sEVs from healthy adipocytes. B, Experimental design for C-H. C, PC determination in heart tissue post sEVPA injection at the indicated timepoints. D, mitoP/B ratio in cardiac tissue 4 hours post sEVPA injection. E, Catalase (CAT) protein expression in whole cardiac tissue 2 hours following a sEVPA injection. F and G, Seahorse Analysis of cardiac mitochondria isolated from mice 1 hour (F) or 2 hours (G) following the indicated injections. Palmitoyl-carnitine and malate were provided as energetic substrates. H, Palmitoyl-carnitine oxidation in isolated cardiac mitochondria 2 hours post sEVPA injection as measured by optical oxygen respirometry. Data are presented as mean ± s.e.m. *P < 0.05, ** P < 0.01, *** P < 0.001. See also Figure S3 and S4.
Figure 3:
Figure 3:. Adipocytes undergoing energetic stress release respiration-competent but oxidatively damaged mitochondria in sEVs.
A, sEVs released from dox-treated, in vitro-differentiated, control and adipo-FtMT adipocytes. B-D, sEV production by in vitro-differentiated wild type adipocytes treated with the indicated compounds. Media was harvested for sEV quantification after 24 hours of treatment (B and D) or the timepoints indicated in C. E, Western blot was performed for mitochondrial proteins in sEVs isolated from the serum of control or adipo-FtMT mice on dox-HFD for 3 weeks (representative of n=3). F, Optiprep density gradient purification of serum sEVs isolated from adipo-FtMT mice fed dox-HFD for 3 weeks. G and H, Mitochondrial proteins were assessed in sEVs from wild type in vitro-differentiated adipocytes (G; representative of n=3) and dox-treated in vitro-differentiated control and adipo-FtMT adipocytes (H; representative of n=5). I and J, Western blot and densitometry for mitochondrial proteins in sEVs produced by primary in vitro-differentiated adipocytes treated as shown. K, Mitochondrial protein content in serum sEVs from lean and obese (20 weeks HFD) wild-type mice. L and M, Seahorse Flux Analysis of isolated serum sEVs from control or adipo-FtMT mice fed dox-HFD for 3 weeks. N, Protein carbonylation (PC) assay on isolated sEVs from control and adipo-FtMT mice on dox-HFD for 3 weeks or conditioned media from adipocytes treated as indicated. sEVs recovered from equal amounts of media or serum were loaded into the SDS-PAGE gels. Abbreviations: oligo, oligomycin; Anti A, antimycin A; PA, palmitate; Ad, adipocyte. Data are presented as mean ± s.e.m. *P < 0.05, ** P < 0.01, *** P < 0.001. See also Figure S5 and S6.
Figure 4:
Figure 4:. Mitochondrial-derived vesicles are packaged into sEVs.
A, Electron micrograph of a mitochondrion displaying a budding structure (left) and released MDVs (right). B, Nanoparticle tracking (NTA) quantification of MDVs released from isolated mitochondria from control and adipo-FtMT sWAT. C and D, VDAC and HSP60 protein content in MDVs released from isolated sWAT mitochondria under the specified conditions. E Immunofluorescent co-stain for TOM20 (mitochondria) and EEA1 (endosomes) with or without antimycin A exposure. F, COXIV content in sEVs isolated from in vitro-differentiated adipocytes treated as indicated (anti-A, antimycin A; CQ, chloroquine). G, Mitochondrial proteins in sEVs isolated from the media of in vitro-differentiated adipocytes of the respective genotypes. sEVs recovered from equal amounts of media were analyzed by Western blot. H, Cardiac PC 1 hour following sEVPA injections from adipocytes with the indicated genotypes. Data are presented as mean ± s.e.m. *P < 0.05, ** P < 0.01, *** P < 0.001.
Figure 5:
Figure 5:. Mitochondria released from adipocytes enter circulation and incorporate into the cardiomyocyte mitochondrial network.
A, Confocal microscopy image that demonstrates the mitochondrial localization (TOM20) of the Flag tag in dox-treated, in vitro-differentiated adipocytes from adipo-mitoFlag mice. B and C, mitoFlag detection by gene expression (B) and immunoprecipitation (C) in heart or sWAT tissue from adipo-mitoFlag mice fed dox-HFD for 11 weeks. D, Confocal microscopy images demonstrating the localization of the Flag tag in cardiomyocytes (CTN1 positive) with no primary antibody control and no mitoFlag transgene control. Arrow specifies non-specific signal and asterisks are supplied for orientation. E, Immunoprecipitated Flag tag in isolated cardiac mitochondria or whole sWAT from the adipo-mitoFlag mice on dox-HFD for 11 weeks. F, sEVs from in vitro differentiated adipocytes expressing mitoFlag and treated with palmitate were injected into WT mice. Where indicated, mice were injected with chloroquine (CQ) 3 hours prior to sEV injection. The Flag tag was immunoprecipitated from heart tissue 1 hour following sEV injection. G, sEVs from primary human (Hu) adipocytes treated with palmitate were injected into wild type mice with or without a CQ pre-injection. Human mtDNA was quantified in mouse heart tissue 1 hour following sEV injection and extensive perfusion with PBS. Data are presented as mean ± s.e.m. *P < 0.05, ** P < 0.01, *** P < 0.001. See also Figure S7.
Figure 6:
Figure 6:. Obese, metabolically unhealthy humans display high circulating sEVs that carry mitochondrial DNA.
A, sEV quantification of conditioned media from human SGBS cells differentiated into mature adipocytes under the indicated conditions (n=3–6). sEVs were isolated from the plasma of metabolically healthy lean (MHL), metabolically healthy obese (MHO) and metabolically unhealthy obese (MUO) human patients. In these samples EVs were: B, counted (n=5), C-D, mitochondrial DNA (mtDNA) was quantified (n=5), E, Mitochondrial protein was quantified (n=8) and F, oxidatively damaged proteins were assessed by the PC assay (n=4). Data are presented as mean ± s.e.m. *P < 0.05, ** P < 0.01, *** P < 0.001.
Figure 7:
Figure 7:. Adipocyte sEVs produced under palmitate stress protect the heart from ischemia/reperfusion injury.
A. Experimental design for ischemia/reperfusion experiments (IR) in B-I. B, plasma cardiac troponin (CTNI) measurements and C, TTC stain of cardiac tissue 24 hours after IR. D, Absolute (left) and normalized (right) heart weight 7 days post IR. E, representative Masson’s Trichrome stain of cardiac histological sections and quantification of infarct size 7 days after IR. F, 20 x magnification of cardiac Masson’s Trichrome stain at the specified regions. G, 4-hydroxynonenal (4-HNE) stain in heart tissue at 7 days post IR. H, Cardiac functional parameters before (day 0) and at the denoted times after IR. I, Percentage drop in ejection fraction from before to 1 day and 7 days following IR. Data are presented as mean ± s.e.m. *P < 0.05, ** P < 0.01, *** P < 0.001.

Comment in

References

    1. Ackers-Johnson M, Li PY, Holmes AP, O’Brien SM, Pavlovic D, and Foo RS (2016). A Simplified, Langendorff-Free Method for Concomitant Isolation of Viable Cardiac Myocytes and Nonmyocytes From the Adult Mouse Heart. Circ Res 119, 909–920. - PMC - PubMed
    1. An YA, Crewe C, Asterholm IW, Sun K, Chen S, Zhang F, Shao M, Funcke JB, Zhang Z, Straub L, et al. (2019). Dysregulation of Amyloid Precursor Protein Impairs Adipose Tissue Mitochondrial Function and Promotes Obesity. Nat Metab 1, 1243–1257. - PMC - PubMed
    1. Antonucci S, Mulvey JF, Burger N, Di Sante M, Hall AR, Hinchy EC, Caldwell ST, Gruszczyk AV, Deshwal S, Hartley RC, et al. (2019). Selective mitochondrial superoxide generation in vivo is cardioprotective through hormesis. Free Radic Biol Med 134, 678–687. - PMC - PubMed
    1. Aoyagi T, Higa JK, Aoyagi H, Yorichika N, Shimada BK, and Matsui T (2015). Cardiac mTOR rescues the detrimental effects of diet-induced obesity in the heart after ischemia-reperfusion. Am J Physiol Heart Circ Physiol 308, H1530–1539. - PMC - PubMed
    1. Bank IE, Timmers L, Gijsberts CM, Zhang YN, Mosterd A, Wang JW, Chan MY, De Hoog V, Lim SK, Sze SK, et al. (2015). The diagnostic and prognostic potential of plasma extracellular vesicles for cardiovascular disease. Expert Rev Mol Diagn 15, 1577–1588. - PubMed

Publication types