. 2021 Dec;161(6):1998-2013.e7.
doi: 10.1053/j.gastro.2021.08.023. Epub 2021 Aug 19.

Pancreatic Tumor Microenvironment Factor Promotes Cancer Stemness via SPP1-CD44 Axis

Affiliations

Pancreatic Tumor Microenvironment Factor Promotes Cancer Stemness via SPP1-CD44 Axis

Palanisamy Nallasamy et al. Gastroenterology. 2021 Dec.

Abstract

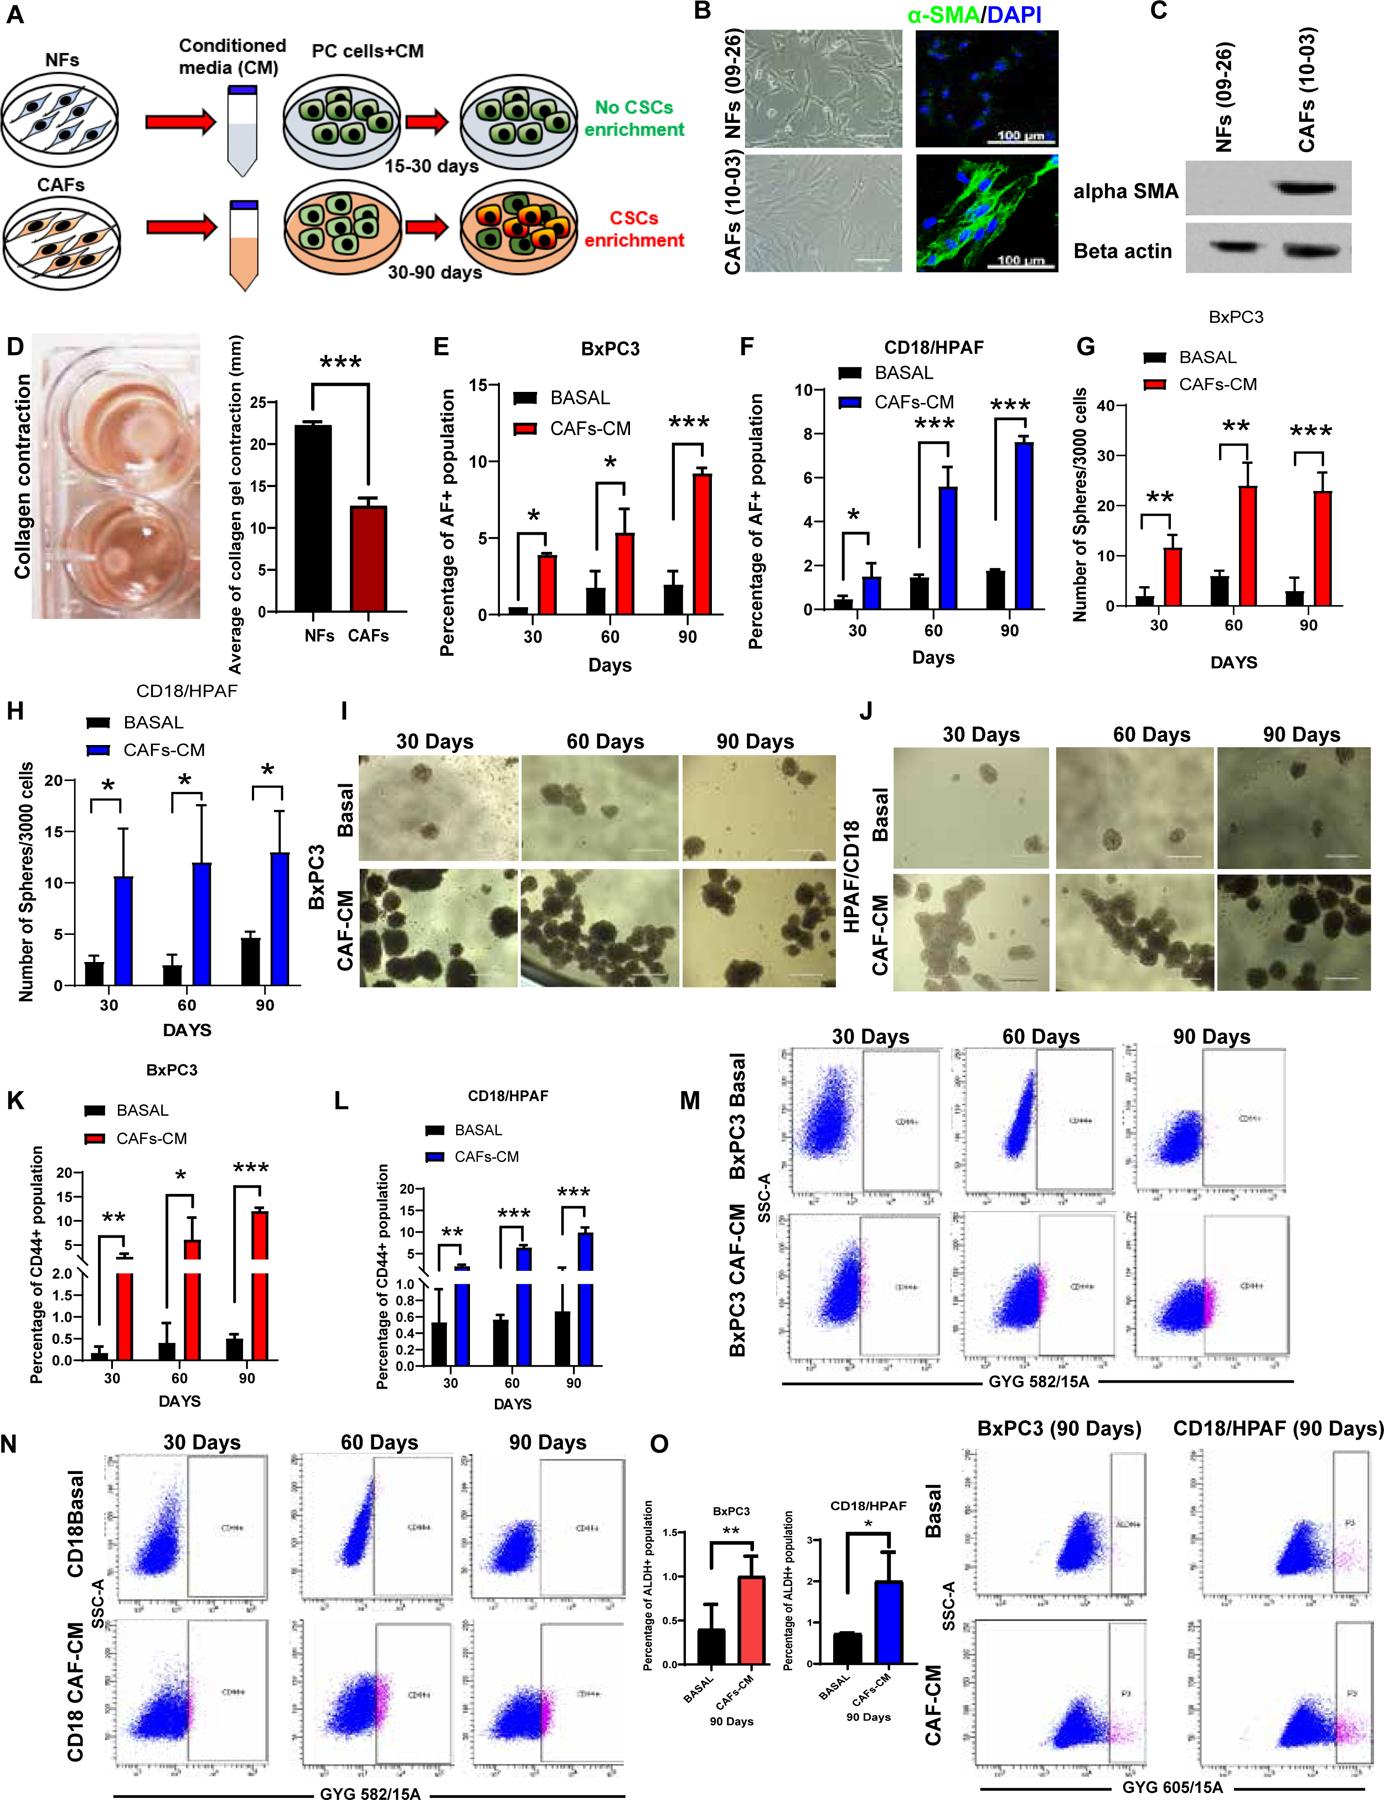
Background & aims: Tumor-microenvironment factors and cancer stem cells (CSCs) play a critical role in the aggressiveness of pancreatic cancer (PC). However, the degree to which tumor-microenvironment factors promote stemness remains unexplored. Here, we examined whether cancer-associated fibroblasts (CAFs) promote CSC features in PC.

Methods: PC cells were treated long-term (30, 60, and 90 days) with conditioned media (CM)-derived from normal human fibroblasts (NFs) and CAFs. The stemness features of tumorsphere formation and stemness populations, along with CSCs markers, were analyzed using 2-dimensional and 3-dimensional sodium alginate bead-based co-culture models. Immunohistochemistry and immunofluorescence staining were performed for CSCs and fibroblast markers in autochthonous KrasG12D/+; Trp53R172H/+; Pdx1-Cre mice and human pancreatic tumors. Polymerase chain reaction array and gene knockdown were performed to identify the mechanism of stemness enrichment.

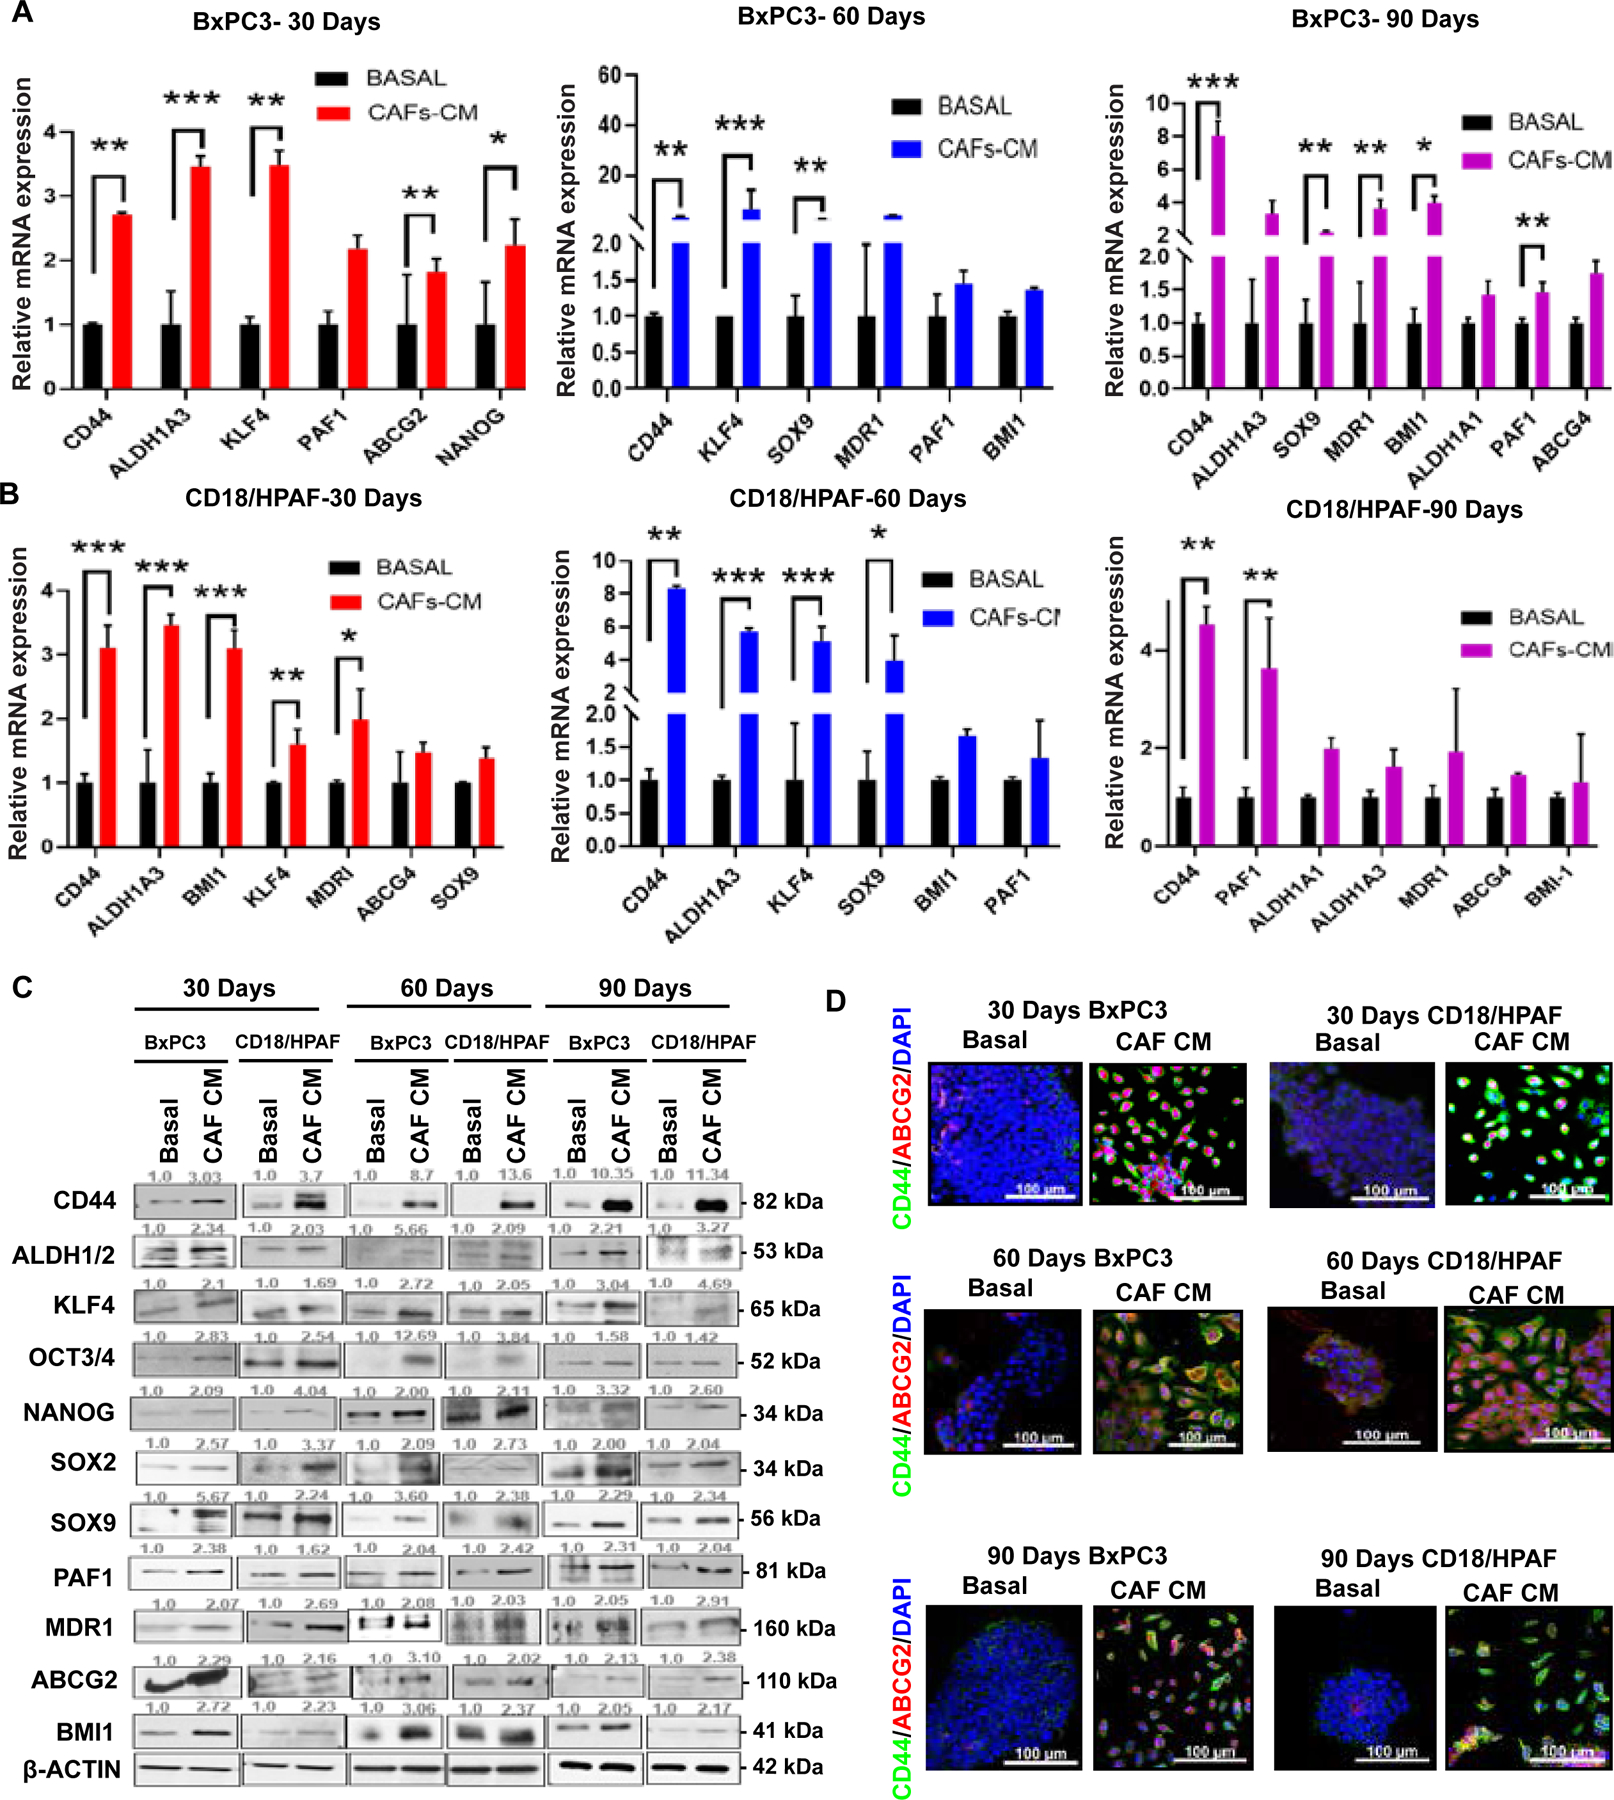
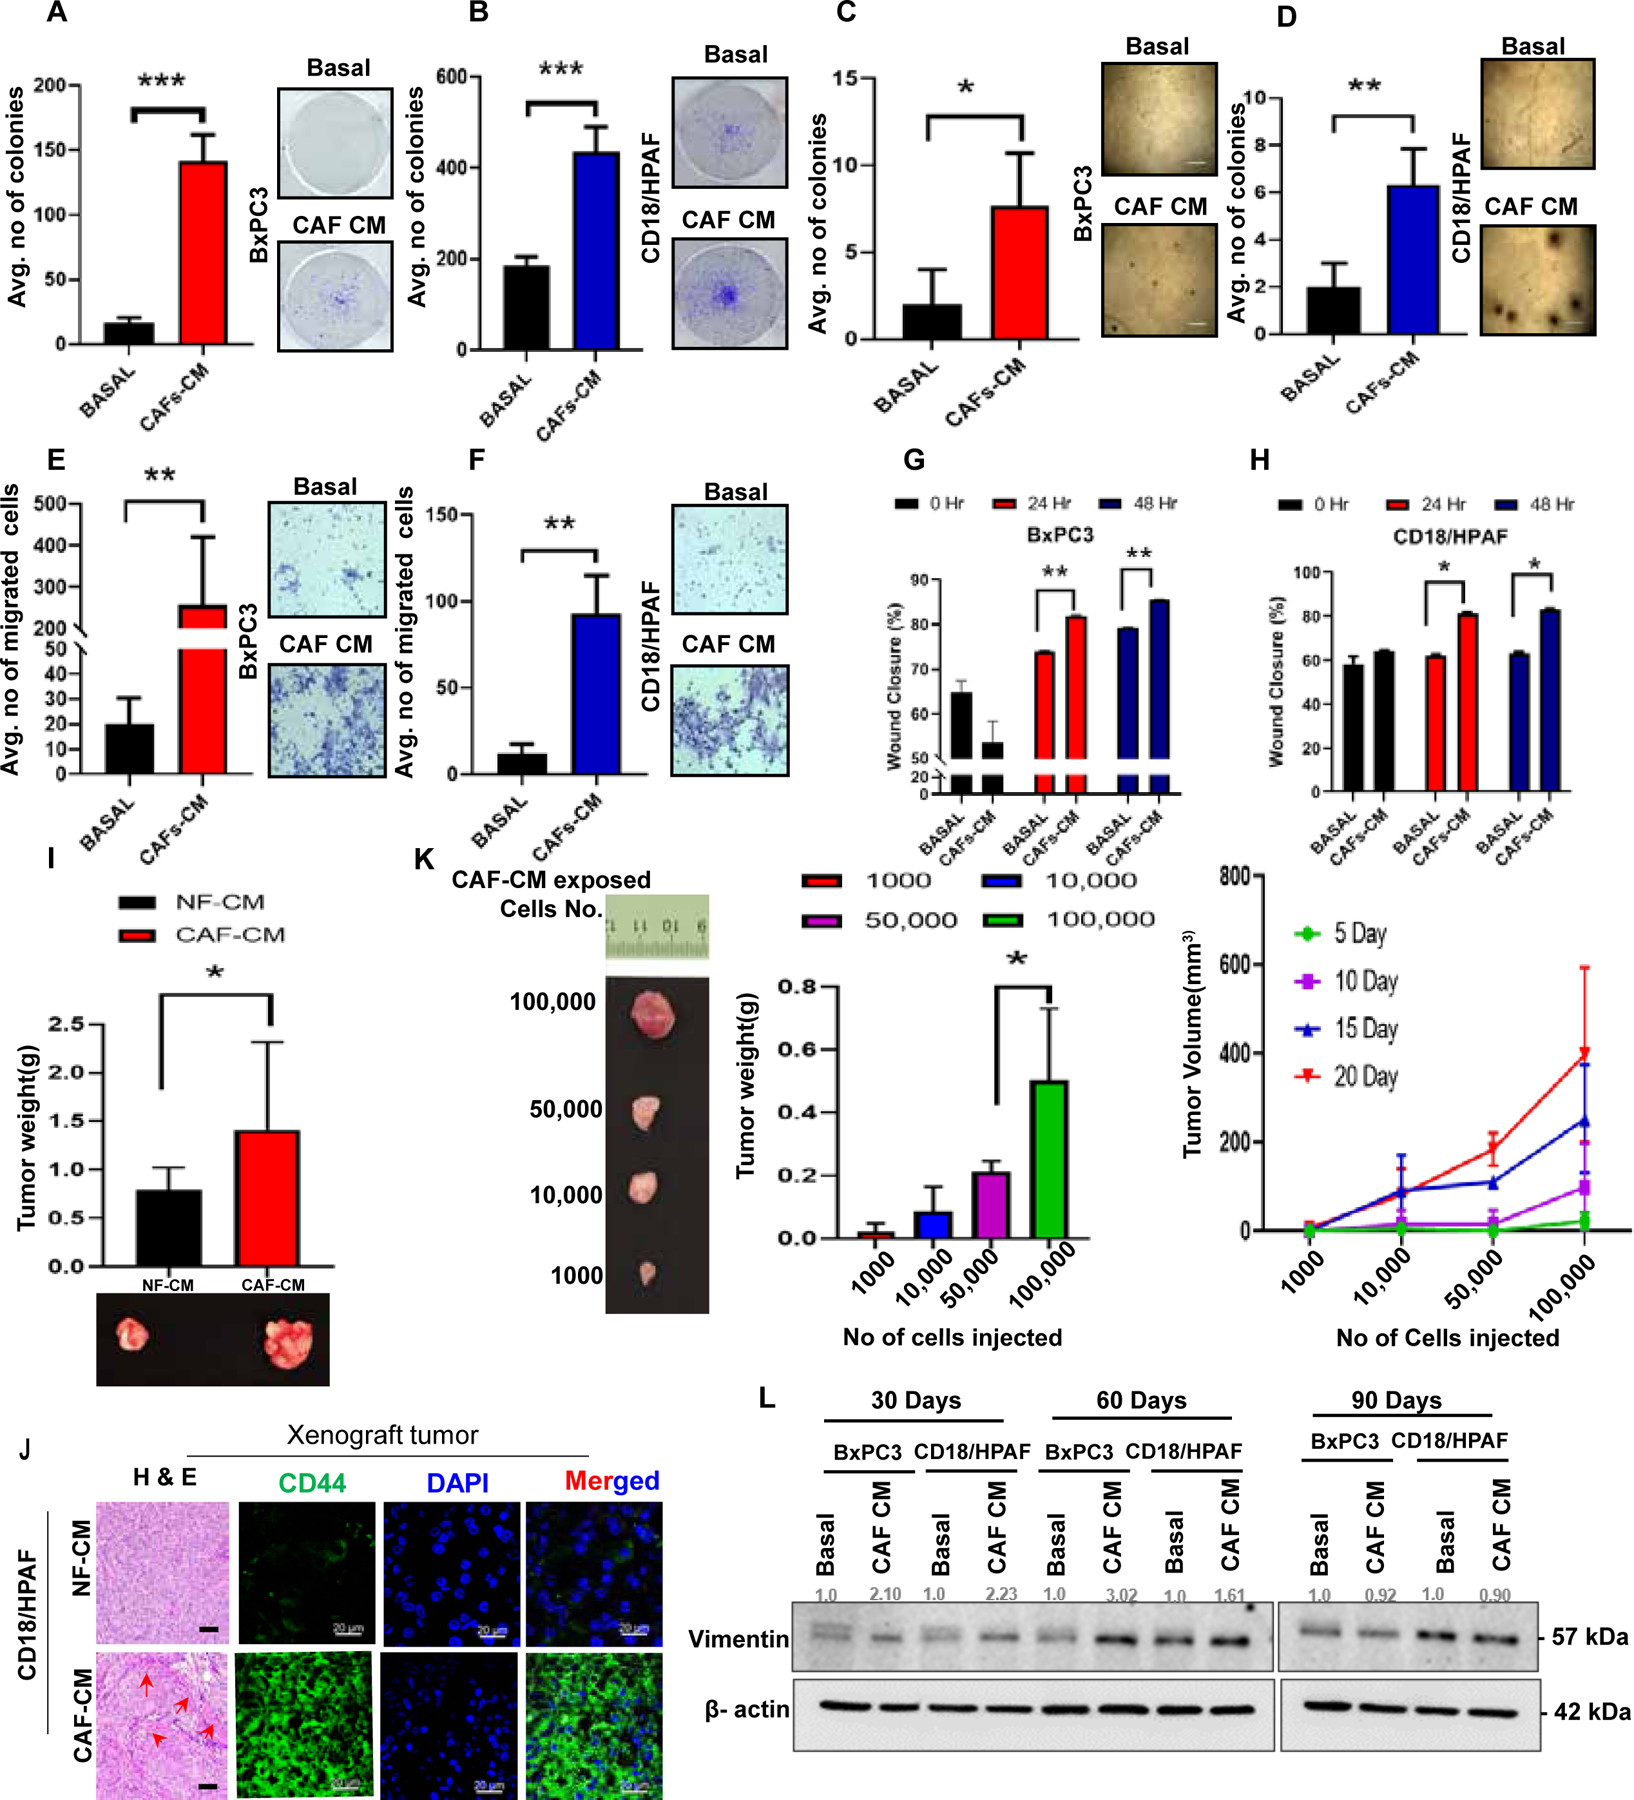
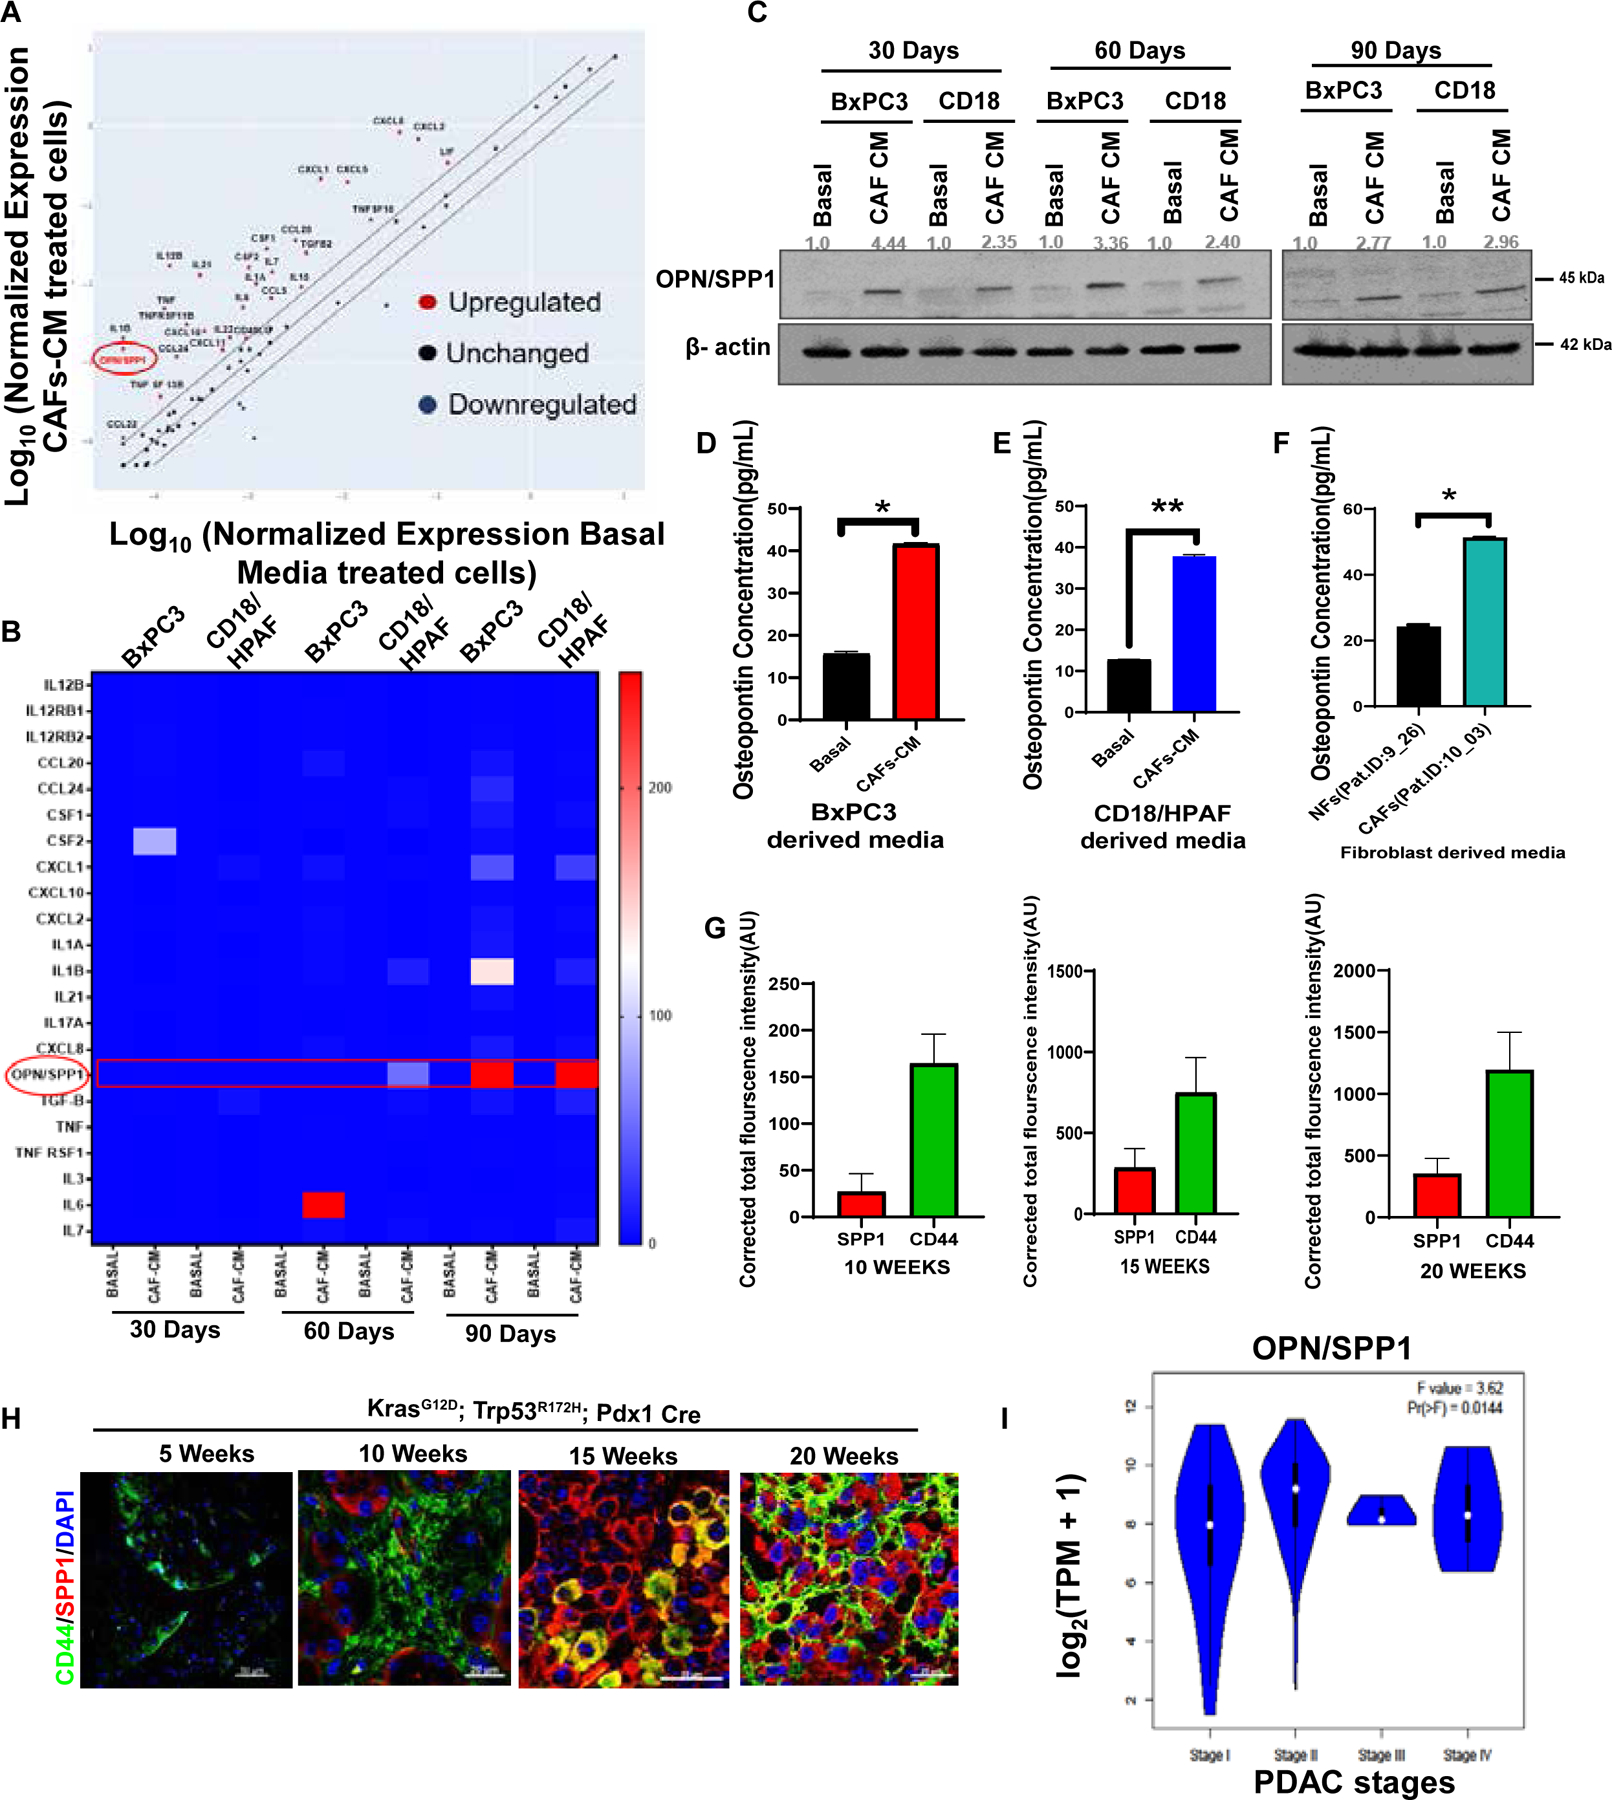
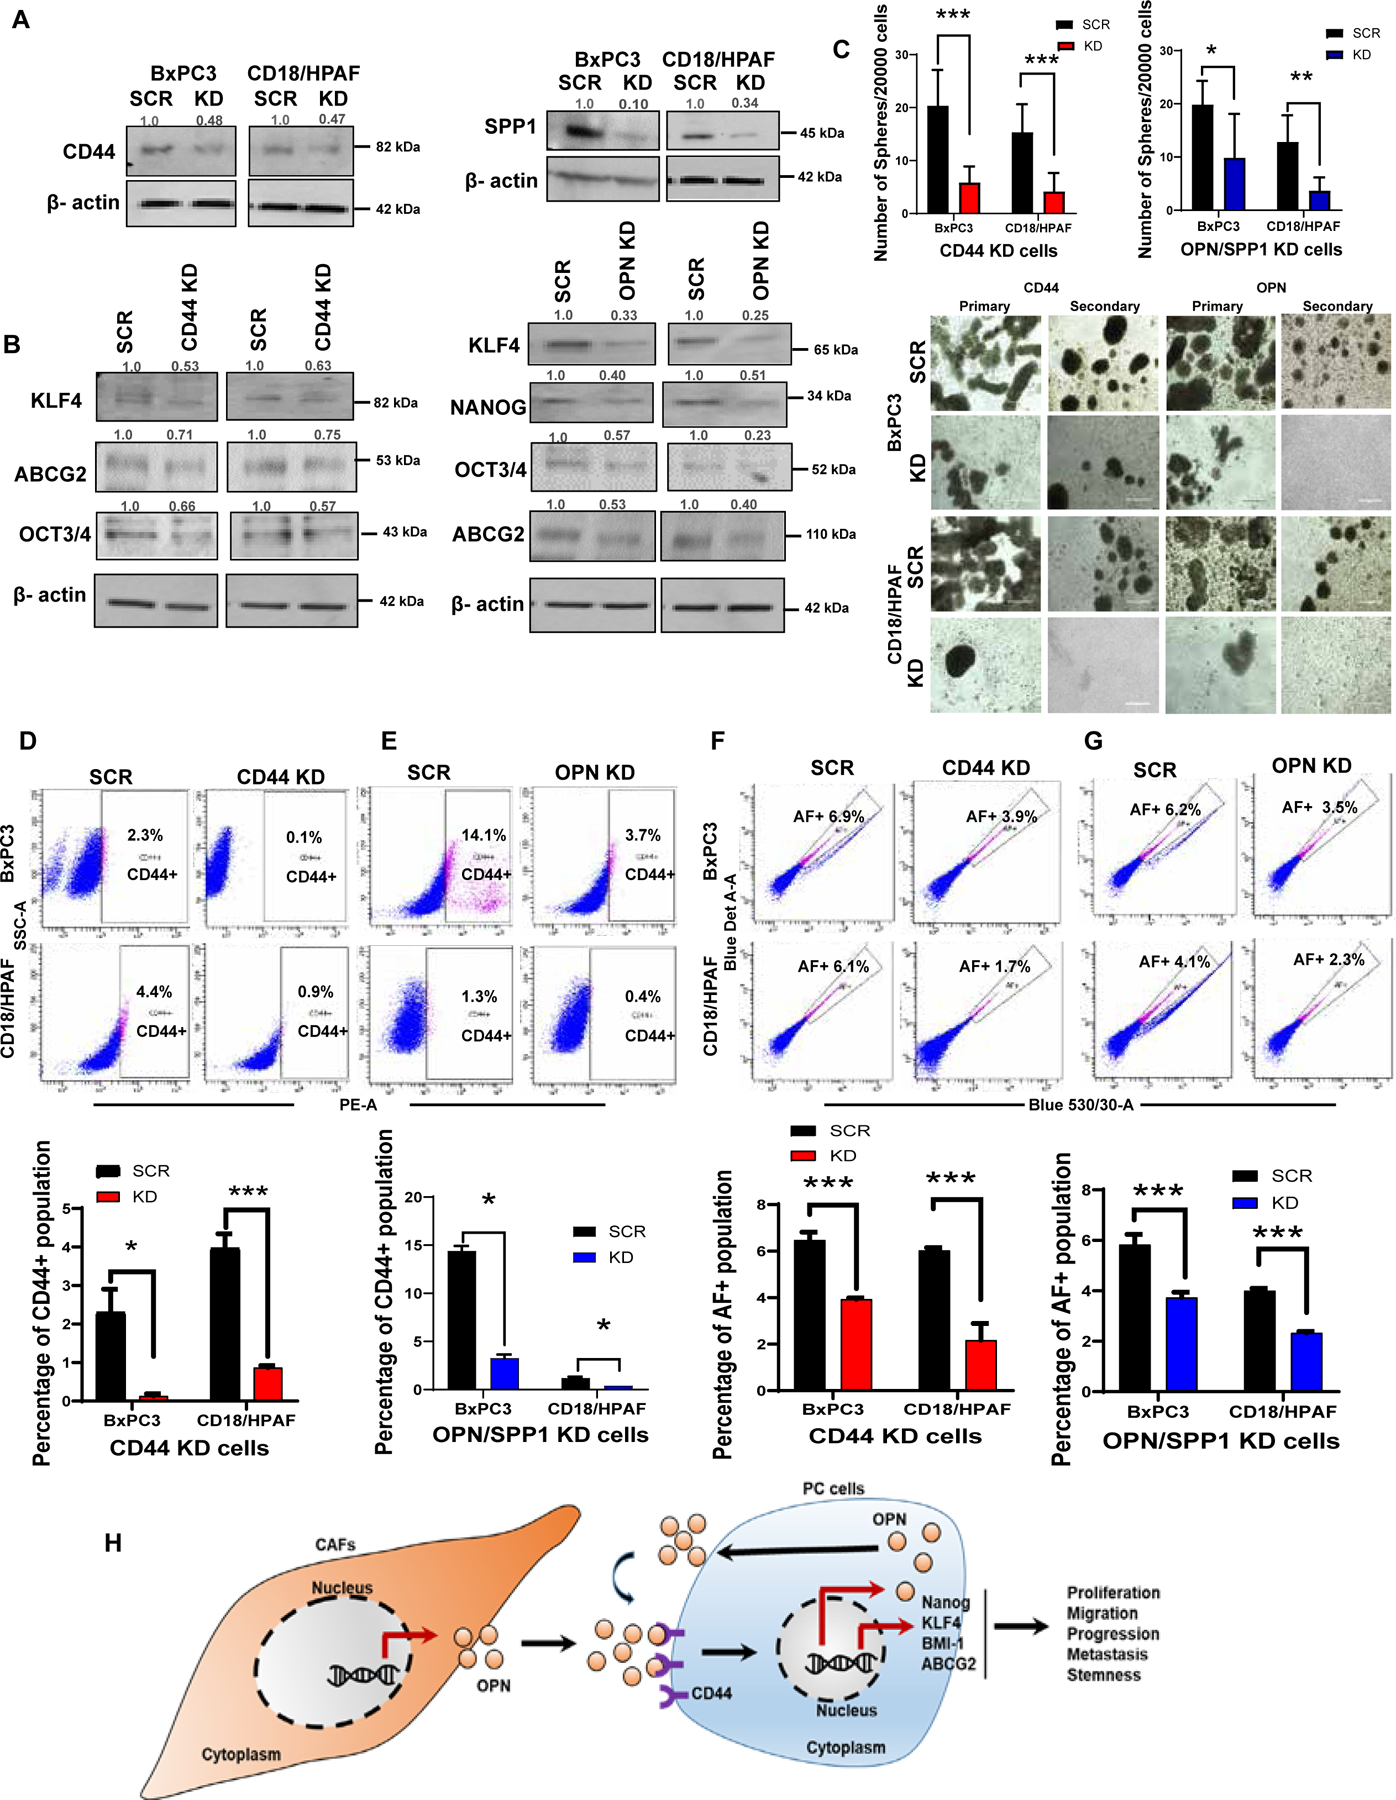
Results: Long-term treatment of PC cells with CAF-CM enriched stemness, as indicated by significantly higher CD44+, ALDH+, and AF+ populations in PC cells. Increased tumorsphere formation and elevated CSC, self-renewal, and drug-resistance markers in CAF-CM-treated PC cells were observed. In addition, CAFs co-cultured with PC cells in the 3-dimensional model showed a substantial increase in stemness features. CD44 and α-smooth muscle actin were positively correlated and their expressions progressively increased from the early to late stages of KrasG12D/+; Trp53R172H/+; Pdx1-Cre mouse and human pancreatic tumors. Osteopontin/secreted phosphoprotein 1 was identified as the top differentially overexpressed gene in CAF-CM-treated PC cells and knockdown of osteopontin/secreted phosphoprotein 1 significantly reduced stemness characteristics in CAF-CM-treated PC cells.

Conclusions: Our data uncovered novel insight into the interplay between CAF and enrichment of stemness population through the osteopontin/secreted phosphoprotein 1-CD44 axis in PC.

Keywords: CD44; Cancer Stem Cells; Cancer-Associated Fibroblast; OPN/SPP1; Pancreatic Cancer.


Conflict of interest statement

Conflicts of interest

SKB is one of the co-founders of Sanguine Diagnostics and Therapeutics, Inc. The other authors disclosed no potential conflicts of interest.

Figures

Figure1.
Figure1.. Exposure to CAF-CM promotes pancreatic stemness.
(A) Schematic diagram showing the generation of PC cells treated with NFs-CM/CAF-CM. (B) Microscopic examination of NFs (09–26) and CAFs (10–03); confocal imaging showing α-SMA (green) and DAPI nuclei staining; (C) Immunoblot analysis for α-SMA expression in NFs/CAFs. β-actin was used as a loading control. (D)Images showing collagen contraction and bar diagram represents collagen contraction (mm) (n=3); Scale bars = 100um. (E-F) Bar diagram showing the percentage of AF+ population in 30, 60, and 90-dayCAF-CM treated PC cells. (G-J) Sphere formation assay was performed on CAF-CM and basal media-incubated BxPC3, and CD18/HPAF cells; 3000/well were seeded in 96-well ultra-low attachment plates in stem cell medium. Images have shown the morphology of 7–14-days-old spheres. Scale bar = 400 um. (n=3). (K-N) Flow cytometry analysis of CD44 positive population in 30, 60, and 90-day CAF-CM-treated PC cells. The bar diagrams signify the CD44+ population in 30, 60, and 90-day CAF-CM exposed PC cells. (O) Bar diagram denoted that the percentage of the ALDH+ population in 90 days CAF-CM exposed PC cells. Representative flow cytometry plots showing ALDH positive population in 90-day CAF-CM-treated PC cells as analyzed by AldeRed assay. For all panels, data represent mean ± SD (P values were calculated by Student t-test.) *P <0 .05, **P <0 .01 ***P < 0.001.
Figure 2.
Figure 2.. Co-culture or mixed PC cells with CAFs fosters pancreatic stemness.
(A) Schematic diagram showing the strategy used to generate 3D sodium alginate beads. (B) Light microscopy images showing the cells growing in 3D beads. Scale bar = 200 um. (C) Hematoxylin and eosin (H&E) staining of sodium alginate CAFs beads alone; CAFs beads co-cultured of BxPC3 and CD18/HPAF cells beads with appropriate controls. Scale bar = 200 um. (D) The bar diagram represents the percentage of the CD44+ population in PC cell bead co-cultured with CAFs beads. (E-F) Representative flow cytometry plots of CD44+ population analysis. (G) Immunoblotting analysis of stemness markers from cells harvested after 6 days of PC/CAFs co-cultured beads or PC beads alone. β-actin used as a housekeeping control. (H, I) Bar graph shows corrected total immunofluorescence staining intensity of CD44 (red) and DAPI (blue) in 0, 2, 4, 6, and 10 days of NFs/CAFs cells mixed with/without PC cells in sodium alginate beads. Scale bar = 50um (n =3). Representative confocal images demonstrating CD44 expression upon NFs and CAFs-derived CM treatment on PC cells. Data represent mean ± SD (P values were calculated by Student t-test.) *P <0 .05, **P <0 .01, ***P < 0.001.
Figure 3.
Figure 3.. CAF-CM-exposed PC cells upsurge the stemness markers.
(A-B) qRT-PCR analysis of stemness marker expressions in 30, 60, and 90-day CAF-CM/Basal-treated PC cells. Data shown are normalized with β-actin expression (n =3). (C) Immunoblotting assays for stemness markers expressions in 30, 60, and 90-day CAF-CM/Basal-treated PC cells. β-actin was used as a loading control. (D) Immunofluorescence staining of 30, 60, and 90-day CAF-CM/Basal-exposed PC cells for stemness marker CD44 (Green) and ABCG2 (Red). Nuclei were stained in DAPI (blue). Scale bar = 100um. Data represent mean ± SD (P values were calculated by Student t-test.) *P <0 .05, **P <0 .01, ***P < 0.001.
Figure 4.
Figure 4.. CAF-CM-exposed PC cells augmented cell proliferation, migration, wound healing ability and promote pancreatic tumorogenesis in in vivo model.
(A-B) CAF-CM treated cells were fixed with methanol and stained with 0.5% crystal violet. Scale bars=100um. The bar diagram shows the average number of colonies/well in CAF-CM/Basal-treated PC cells. (C-D) Images representing that CAF-CM-treated cells made colonies in soft agar anchorage-independent manner. The bar diagram denoted the average number of colonies/fields in CAF-CM/Basal-treated PC cells. (E-F) Representative images showing the CAF-CM exposed PC cells migrated in the inlet membrane. Scale bars=200um.The bar diagram denoted the average number of migrated cells/field in CAF-CM/Basal-treated PC cells. (G-H) The bar diagram depicting the average percentage of wound area in CAF-CM/Basal-treated PC cells. (I) Bar Graph shows the quantification of tumor weights generated using orthotopic implantation of NFs/CAFs-exposed PC cells in the pancreas of athymic nude mice. (n =4) and representative image displaying the size of each xenograft tumors. (J) Represented images displayed the H&E staining and immunofluorescence staining of CD44 (green) and DAPI (blue) in NF-CM/CAF-CM exposed PC cells xenograft tumor tissue. DAPI was used for nuclear staining; (n=3). (K) Images represented xenograft tumor of subcutaneous implantation of serially diluted CAF-CM exposed CD18/HPAF cells in athymic nude mice. (n=2). and bar graphs showing the tumor weight and tumor volume of CAF-CM exposed CD18/HPAF cells by in vivo limiting dilution assay. (L) Western blot experiment for Vimentin expression in 30, 60, and 90 days CAF-CM/Basal- treated PC cells. β-actin was used as a housekeeping control. (n=3). For all bar graphs, data represent mean ± SD (P values were calculated by Student t-test.) *P <0 .05, **P <0 .01, ***P < 0.001.
Figure 5.
Figure 5.. Human/KPC in vivo models show a progressive increase in the stemness, and CAF shows at different PC stages.
(A) The schematic diagram illustrating the PC stages expression of CD44 and α-SMA in mice and human tissue samples. (B) Bar diagram represented as corrected total fluorescence intensity in different stages of KPC mice and normal mice tissues expression of CD44 and α-SMA (n=3). Scale bars=50um; 20 week-20um. (C) Representative images show the immunofluorescence staining of CD44 and α-SMA from 10, 15, and 20 weeks old KPC (KrasG12D; p53R172H; Pdx1Cre) mice tissues. (D) The Box plot representing the corrected total fluorescence intensity in PDAC and normal tissues of CD44 and α-SMA expressions (n=8). (E) Representative images show the immunofluorescence staining of CD44 and α-SMA from human PDAC stage IIA, IIB, and normal tissues. Scale bars=50um (F) The Box plot showing the H score of PDAC and normal tissues of CD44 and α-SMA expressions (n=8). (G) Immunohistochemical staining of CD44 and α-SMA from human PDAC stage IIA, IIB, and normal tissues (Scale bars=20 um). (n=8). (H) TCGA database analysis expression pattern of CD44, α-SMA in different pancreatic adenocarcinoma stages (PAAD)using the Gene Expression Profiling Interactive Analysis tool (GEPIA). Images are represented as a violin plot. CD44 expressions on different stages of PAAD, and α-SMA (ACTA2) expressions on different stages of PAAD; n(T) =179; n(N)=171.Data represent mean ± SD (P values were calculated by Student t-test.) *P <0 .05, **P <0 .01, ***P < 0.001.
Figure 6.
Figure 6.. CAF-CM subsidizes the up-regulation of OPN/SPP1 in PC cells.
(A) PCR array for receptors and ligands molecules associated with stemness signaling from CAF-CM/Basal-exposed PC cells. (B) Heatmap of top differentially expressed genes of PCR array (cut off < 5 fold). (C) Immunoblotting of OPN/SPP1 protein expression in 30, 60, and 90-dayCAF-CM/Basal-exposed PC cells. β-actin was used as a housekeeping control. (D-F) The OPN/SPP1levels in culture media. Bar diagrams depict the OPN/SPP1levels in pg/mL in the serum-free culture media of NFs/CAF-CM-exposed cells. (G-H) Representative bar graphs and images are showing immunofluorescence staining of CD44 (green) and OPN/SPP1 (red) in 5, 10, 15, and 20 weeks old KPC (KrasG12D; p53R172H; Pdx1Cre) mice tissues. Nuclei were stained in DAPI (blue). n=3; Scale Bar= 20um. (I) Representative violin plot showing the OPN/SPP1 expressions on different stages of PAAD; n (T) =179; n (N) =171. Data represent mean ± SD (P values were calculated by Student t-test) *P <0 .05, **P <0 .01, ***P < 0.001.
Figure 7.
Figure 7.. Small interfering RNA knockdown of OPN/SPP1and CD44 in CAF-CM-induced PC cells diminished stemness features.
(A) Immunoblot blot analysis shows OPN/SPP1, CD44 knockdown efficiency in CAF-CM-treated PC cells. (B) Western blot analysis for stemness markers expressions in OPN/SPP1 and CD44 knockdown PC cells. β-actin was used as a housekeeping control (n=3). (C) The bar diagram showing the number of spheres per 2000 cells in OPN/SPP1 and CD44 knockdown PC cells; Sphere formation assays executed on OPN/SPP1 and CD44 knockdown PC cells; 2000/well were seeded in 96-well ultra-low attachment plates in stem cell medium; Images have shown the morphology of 7–14-days-old spheres. Scale bar = 400 um. (D-G) The bar diagram depicts the percentage of CD44+ and AF+ population in OPN/SPP1 and CD44 knockdown PC cells; Flow cytometry analysis of CD44+ and AF+ in CD44 and OPN/SPP1 knockdown PC cells. (H) Diagram illustrating how the CAFs regulate the OPN/SPP1-CD44 axis-mediated stemness enrichment in PC cells (n=3); Data represent mean ± SD (P values were calculated by Student t-test) *P <0 .05, **P <0 .01, ***P < 0.001.

Comment in

References

    1. Ho WJ, Jaffee EM, Zheng L. The tumour microenvironment in pancreatic cancer - clinical challenges and opportunities. Nat Rev Clin Oncol 2020;17:527–540. - PMC - PubMed
    1. Hosein AN, Brekken RA, Maitra A. Pancreatic cancer stroma: an update on therapeutic targeting strategies. Nat Rev Gastroenterol Hepatol 2020;17:487–505. - PMC - PubMed
    1. Helms E, Onate MK, Sherman MH. Fibroblast Heterogeneity in the Pancreatic Tumor Microenvironment. Cancer Discov 2020;10:648–656. - PMC - PubMed
    1. Kalluri R The biology and function of fibroblasts in cancer. Nat Rev Cancer 2016;16:582–98. - PubMed
    1. Chen X, Song E. Turning foes to friends: targeting cancer-associated fibroblasts. Nat Rev Drug Discov 2019;18:99–115. - PubMed

Publication types

MeSH terms