. 2021 Nov;113(6):3461-3475.
doi: 10.1016/j.ygeno.2021.08.013. Epub 2021 Aug 19.

HIV-1 Tat and cocaine impact astrocytic energy reservoir influence on miRNA epigenetic regulation

Affiliations

HIV-1 Tat and cocaine impact astrocytic energy reservoir influence on miRNA epigenetic regulation

Mayur Doke et al. Genomics. 2021 Nov.

Abstract

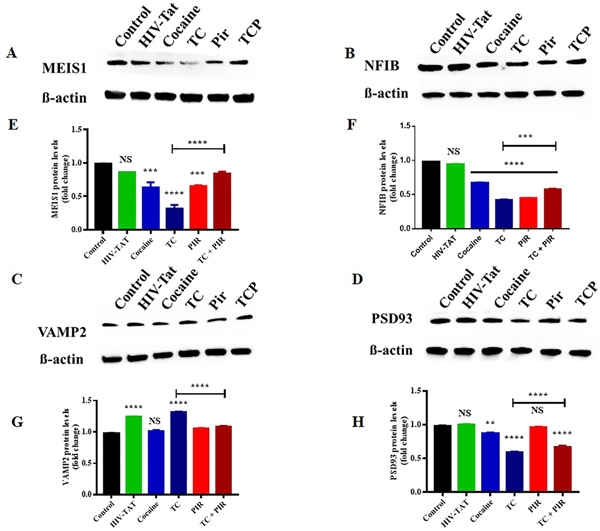
Astrocytes are the primary regulator of energy metabolism in the central nervous system (CNS), and impairment of astrocyte's energy resource may trigger neurodegeneration. HIV infections and cocaine use are known to alter epigenetic modification, including miRNAs, which can target gene expression post-transcriptionally. However, miRNA-mediated astrocyte energy metabolism has not been delineated in HIV infection and cocaine abuse. Using next-generation sequencing (NGS), we identified a total of 1900 miRNAs, 64 were upregulated and 68 miRNAs were downregulated in the astrocytes by HIV-1 Tat with cocaine exposure. Moreover, miR-4727-3p, miR-5189-5p, miR-5090, and miR-6810-5p expressions were significantly impacted, and their gene targets were identified as VAMP2, NFIB, PPM1H, MEIS1, and PSD93 through the bioinformatic approach. In addition, the astrocytes treated with the nootropic drug piracetam protects these miRNAs. These findings provide evidence that the miRNAs in the astrocytes may be a potential biomarker and therapeutic target for HIV and cocaine abuse-induced neurodegeneration.

Keywords: Astrocyte and cocaine; HIV-1 Tat; Piracetam; miRNA.


Figures

Figure-1
Figure-1
Summary of small RNAs in control and treated (HIV-1Tat, cocaine, piracetam, HIV + cocaine (TC) and HIV + cocaine + Piracetam (TCP)) human primary astrocytes. A) For size distributions of small RNAs across sample groups, size selected small RNAs of 18–50 nts were given different colors to represent control and treated groups. Length distribution of small RNA sequences demonstrated 24 and 21 nt length are most abundant reads among the small RNAs. B) Frequency of unique small RNA classes of different categories present in small RNA seq samples. The unique sequences were subjected to searches for the types and numbers of sRNA using the sRNAtools webserver (miRNA, piRNA, tRFs, siRNA, snRNA, snoRNA, and rRNA). These small RNAs were classified on B) the basis of unique tags and C) on the basis of total read counts.
Figure-2
Figure-2
Identification of miRNAs differentially expressed in control vs HIV-1 Tat comparison in astrocytes. (A) The unnormalized counts of control and HIV-1 Tat groups presented in box-whisker plot which were then transformed to normalized counts for both the groups. B) Volcano plot presents differential expression of miRNAs. The X axis corresponds to fold changes of −2 (downregulation) and +2 (upregulation). The Y axis represents a -log10 of P value. The red and green points in the plot represent the differentially expressed miRNAs with statistical significance. The table represent top up-and down-regulated miRNAs with log2fold change. (C) MD plot presents differential expression of miRNAs. The X axis corresponds to average log CPM. The Y axis represents a log2foldchange. The red and green points in the plot represent the differentially expressed miRNAs with statistical significance. The table represent top up-and down-regulated miRNAs with logCPM change. D) The stripcharts showing significantly expressed miRNAs with their individual expression values in each sample. The expression of miR346, miR4734 and miR5008 was downregulated in the HIV-1 Tat group compared with the control group (p<0.05). miR200A, miR4290HG and miR7703 was upregulated in the HIV-1 Tat group. (E) The heatmap shows top upregulated miRNAs colored red, and downregulated miRNAs colored green.
Figure-3
Figure-3
Identification of miRNAs differentially expressed in control vs Cocaine treated astrocytes. (A) The unnormalized counts of control and Cocaine groups presented in box-whisker plot which were then transformed to normalized counts for both the groups. B) Volcano plot presents differential expression of miRNAs. The X axis corresponds to fold changes of −2 (downregulation) and +2 (upregulation). The Y axis represents a -log10 of P value. The red and green points in the plot represent the differentially expressed miRNAs with statistical significance. The table represent top up-and down-regulated miRNAs with log2fold change. (C) MD plot presents differential expression of miRNAs. The X axis corresponds to average log CPM. The Y axis represents a log2fold change. The red and green points in the plot represent the differentially expressed miRNAs with statistical significance. The table represent top up-and down-regulated miRNAs with logCPM change. D) The stripcharts showing significantly expressed miRNAs with their individual expression values in each sample. The expression of miR597, miR4483 and miR4734 were downregulated in the Cocaine group compared with the control group (p<0.05). miR548E and miR6800 was upregulated in the Cocaine group. (E) The heatmap shows top upregulated miRNAs colored red, and downregulated miRNAs colored green.
Figure-4
Figure-4
Identification of miRNAs differentially expressed in control vs HIV-1 Tat + Cocaine comparison in astrocytes. (A) The unnormalized counts of control and HIV-1 Tat + Cocaine groups presented in box-whisker plot which were then transformed to normalized counts for both the groups. B) Volcano plot presents differential expression of miRNAs. The X axis corresponds to fold changes of −2 (downregulation) and +2 (upregulation). The Y axis represents a -log10 of P value. The red and green points in the plot represent the differentially expressed miRNAs with statistical significance. The table represent top up-and down-regulated miRNAs with log2fold change. (C) MD plot presents differential expression of miRNAs. The X axis corresponds to average log CPM. The Y axis represents a log2foldchange. The red and green points in the plot represent the differentially expressed miRNAs with statistical significance. The table represent top up-and down-regulated miRNAs with logCPM change. D) The stripcharts showing significantly expressed miRNAs with their individual expression values in each sample. The expression of miR551A was downregulated in the HIV-1 Tat + Cocaine group compared with the control group (p<0.05). miR548E, miR3115, miR607 and miR4482 was upregulated in the HIV-1 Tat + Cocaine group. (E) The heatmap shows top upregulated miRNAs are colored red, and downregulated miRNAs colored green.
Figure-5
Figure-5
A) The Venn diagram represents differentially expressed miRNAs were analyzed among comparisons of groups and 6 miRNAs were shared between all three comparisons-control vs HIV-1Tat, control vs cocaine and control vs TC. B) HIV-1 Tat and cocaine co-treatment induces aberrant up and downregulation of miRNAs. However, treatment with piracetam protected these drastic miRNA level changes. The number above the bars indicates fold change. Effects of cocaine, HIV-1 Tat, PIR, HIV-1 Tat + Cocaine and HIV-1 Tat + Cocaine + PIR on hsa-miR-4727–3p, hsa-miR-5189–5p, hsa-miR-5090, and hsa-miR-6810–5p. Gene expression in human primary astrocytes. Human primary astrocytes were exposed to cocaine (1 μM) and HIV-1 Tat (50 ng/ml) either alone or in combination with piracetam (10 μM) for 24 h. Controls were maintained in drug-free medium (without drug exposure). (C) hsa-miR-4727–3p, (D) hsa-miR-5189–5p, (E) hsa-miR-5090, and (F) hsa-miR-6810–5p miRNA expression levels in astrocytes determined by qRT-PCR analysis using the housekeeping gene, U6 snRNA as a loading control. The data are expressed as the mean ± standard error mean of the transcript accumulation index (TAI) of three independent experiments. N=3. ****P<0.0001, ***P<0.001, **P<0.01, *P<0.05, NS - nonsignificant
Figure-6
Figure-6
Identification of miRNA targeted genes. A) Gene targets identification workflow. Schematic of workflow for analyzing and determining the miRNA specific gene targets with the help of miRWalk 2.0 webserver B) The Venn diagram represents comparison between differentially significant expressed miRNAs of HIV-1 Tat, cocaine and HIV-1 Tat + Cocaine groups. It showed 13 common gene targets which shared by all 3 groups. C) The circos plot represents linkages between differentially significant expressed miRNAs and their identified common gene targets.
Figure-7
Figure-7
Effects of the cocaine, HIV-1 Tat, PIR, HIV-1 Tat + Cocaine and HIV-1 Tat + Cocaine + PIR on miRNA targeted proteins in human primary astrocytes. Cells were exposed to cocaine (1 μM) and HIV-1 Tat (50 ng/ml) either alone or in combination with piracetam (10 μM) for 24 h. The protein expression levels of different classes of MEIS1, NFIB, VAMP2 and PSD93 in astrocytes were determined by western blot analysis using ß-Actin as a loading control. Western blot showing (A) MEIS1, (B) NFIB, (C) VAMP2 and (D) PSD93. The densitometric analysis results in E, F, G and H represent the protein levels (fold-change control) of MEIS1, NFIB, VAMP2 and PSD93, respectively. The data are expressed as the mean ± standard error mean of three independent experiments. N=3. ****P<0.0001, ***P<0.001, **P<0.01, NS - nonsignificant.

References

    1. World Health Organization, U.S. Statistics | HIV.gov, Underst. Addressing Violence against Women. (2018) 1–12. https://www.hiv.gov/hiv-basics/overview/data-and-trends/statistics (accessed January 13, 2021).
    1. Troyer RM, Collins KR, Abraha A, Fraundorf E, Moore DM, Krizan RW, Toossi Z, Colebunders RL, Jensen MA, Mullins JI, Vanham G, Arts EJ, Changes in Human Immunodeficiency Virus Type 1 Fitness and Genetic Diversity during Disease Progression, J. Virol 79 (2005) 9006–9018. 10.1128/jvi.79.14.9006-9018.2005. - DOI - PMC - PubMed
    1. Valcour V, Sithinamsuwan P, Letendre S, Ances B, Pathogenesis of HIV in the central nervous system, Curr. HIV/AIDS Rep 8 (2011) 54–61. 10.1007/s11904-010-0070-4. - DOI - PMC - PubMed
    1. Brabers NACH, Nottet HSLM, Role of the pro-inflammatory cytokines TNF-α and IL-1β in HIV-associated dementia, Eur. J. Clin. Invest 36 (2006) 447–458. 10.1111/j.1365-2362.2006.01657.x. - DOI - PubMed
    1. Xing HQ, Hayakawa H, Izumo K, Kubota R, Gelpi E, Budka H, Izumo S, In vivo expression of proinflammatory cytokines in HIV encephalitis: An analysis of 11 autopsy cases: Original Article, Neuropathology. 29 (2009) 433–442. 10.1111/j.1440-1789.2008.00996.x. - DOI - PubMed

Publication types