

Effects of COVID-19 pandemic restrictions on coral reef fishes at eco-tourism sites in Bora-Bora, French Polynesia
- PMID: 34418732
- PMCID: PMC9272407
- DOI: 10.1016/j.marenvres.2021.105451
Effects of COVID-19 pandemic restrictions on coral reef fishes at eco-tourism sites in Bora-Bora, French Polynesia
Abstract
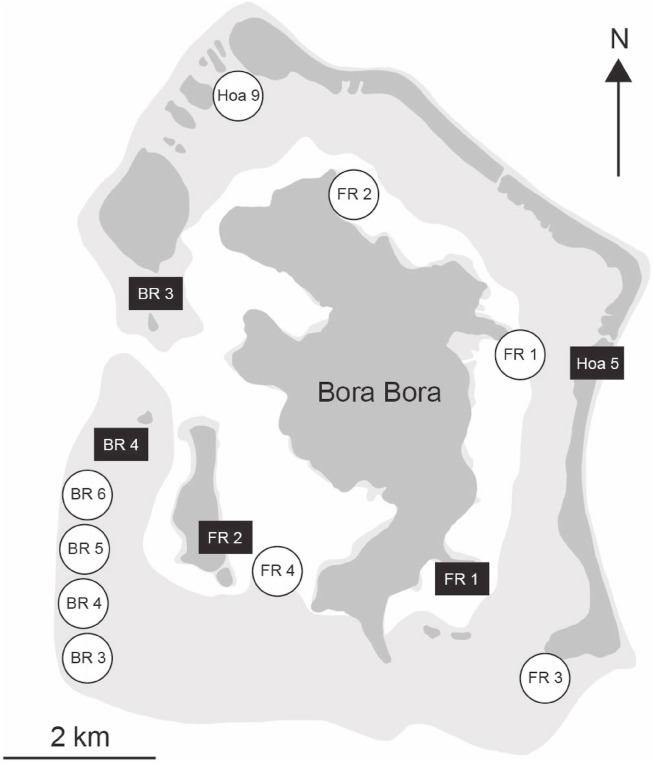
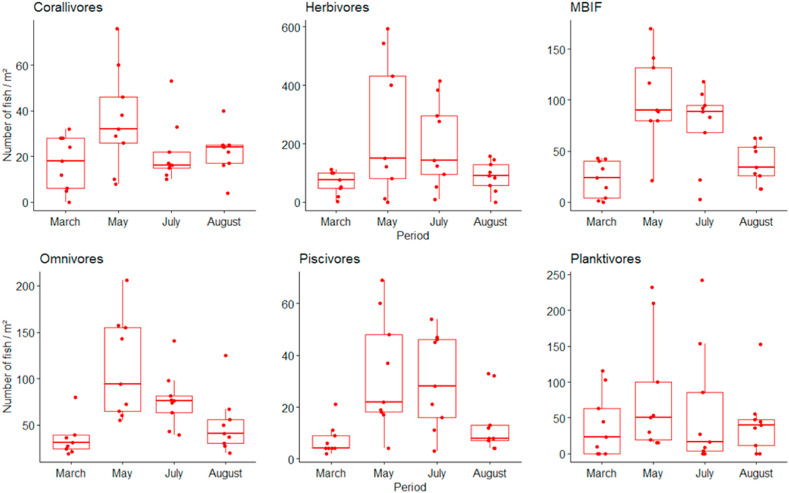
The COVID-19 pandemic led to a global lockdown in mid-2020, leading to a rapid decline in international travel and tourism. In French Polynesia, marine-based tourism activities ceased in March 2020 with the suspension of international flights (i.e., 45 days - between 20th March and 04th May 2020), slowly restarting between May-July as domestic and international visitors returned. The impacts of this rapid change in human activity at reef tourism sites on associated reef fishes was examined at Bora-Bora Island through underwater surveys of five control and nine eco-tourism sites. Our results showed that fish density significantly increased from March to May (i.e., the overall density of fishes increased by 143% and harvested species by 215%), but returned to pre-lockdown levels by August 2020. At the usually busy eco-tourism sites, fish diversity, notably of piscivores, omnivores, and benthic feeders, was higher in the absence of tourists. The impact observed is almost certainly related to short term changes in fish behavior, as any density fluctuations at the population level are unlikely to have happened over such a short time frame. Overall, these findings highlight the influence of human activities on fish communities and underline the need for further research to evaluate the environmental impacts of eco-tourism.
Keywords: COVID-19; Coral reef; Eco-tourism sites; Fishes; Future management; Human activities.
Copyright © 2021 Elsevier Ltd. All rights reserved.
Conflict of interest statement
The authors declare that they have no known competing financial interests or personal relationships that could have appeared to influence the work reported in this paper.
Figures


References
-
- Albuquerque T., et al. In situ effects of human disturbances on coral reef-fish assemblage structure: temporary and persisting changes are reflected as a result of intensive tourism. Mar. Freshw. Res. 2014;66(1):23–32.
-
- Altman-Kurosaki N.T., Priest M.A., Golbuu Y., Mumby P.J., Marshell J. Microherbivores are significant grazers on Palau's forereefs. Mar. Biol. 2018;165:74–86.
-
- Bell C.M., Needham M.D., Szuster B.W. Congruence among encounters, norms, crowding, and management in a marine protected area. Environ. Manag. 2011;48(3):499–513. - PubMed
-
- Bennett N.J., et al. The COVID-19 pandemic, small-scale fisheries and coastal fishing communities. Coast. Manag. 2020;48(4):336–347.
MeSH terms
LinkOut - more resources
Full Text Sources
Medical
