

Estimating the cause-specific relative risks of non-optimal temperature on daily mortality: a two-part modelling approach applied to the Global Burden of Disease Study
- PMID: 34419204
- PMCID: PMC8387975
- DOI: 10.1016/S0140-6736(21)01700-1
Estimating the cause-specific relative risks of non-optimal temperature on daily mortality: a two-part modelling approach applied to the Global Burden of Disease Study
Erratum in
-
Department of Error.Lancet. 2021 Sep 11;398(10304):956. doi: 10.1016/S0140-6736(21)01996-6. Lancet. 2021. PMID: 34509231 Free PMC article. No abstract available.
Abstract
Background: Associations between high and low temperatures and increases in mortality and morbidity have been previously reported, yet no comprehensive assessment of disease burden has been done. Therefore, we aimed to estimate the global and regional burden due to non-optimal temperature exposure.
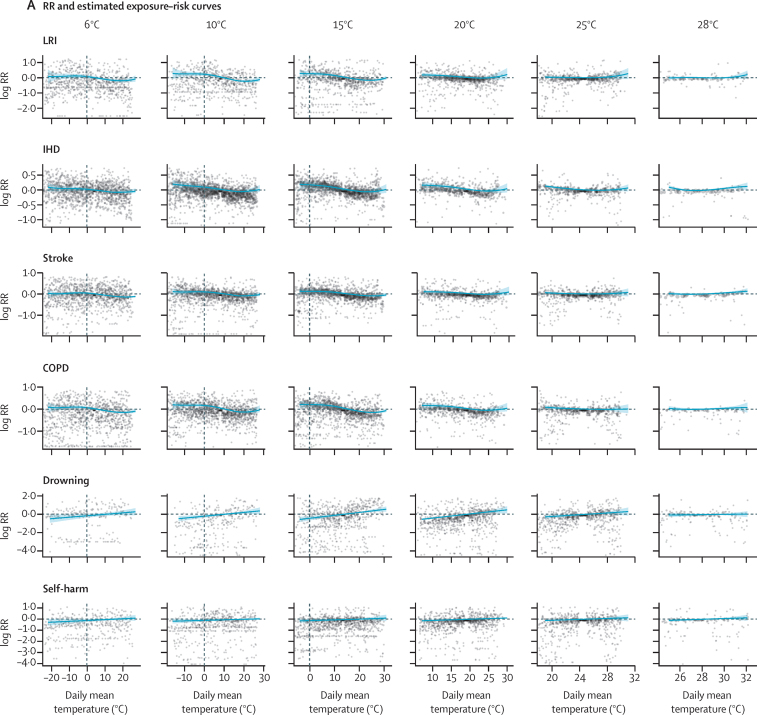
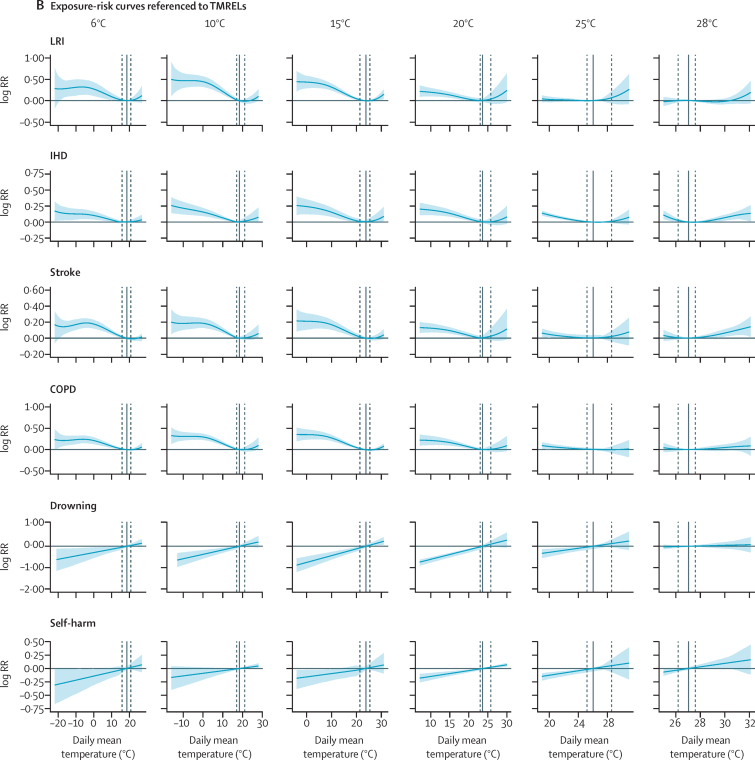
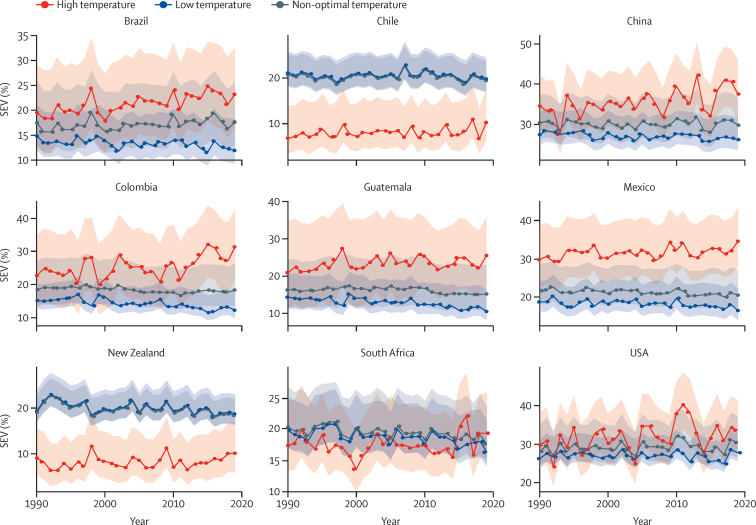
Methods: In part 1 of this study, we linked deaths to daily temperature estimates from the ERA5 reanalysis dataset. We modelled the cause-specific relative risks for 176 individual causes of death along daily temperature and 23 mean temperature zones using a two-dimensional spline within a Bayesian meta-regression framework. We then calculated the cause-specific and total temperature-attributable burden for the countries for which daily mortality data were available. In part 2, we applied cause-specific relative risks from part 1 to all locations globally. We combined exposure-response curves with daily gridded temperature and calculated the cause-specific burden based on the underlying burden of disease from the Global Burden of Diseases, Injuries, and Risk Factors Study, for the years 1990-2019. Uncertainty from all components of the modelling chain, including risks, temperature exposure, and theoretical minimum risk exposure levels, defined as the temperature of minimum mortality across all included causes, was propagated using posterior simulation of 1000 draws.
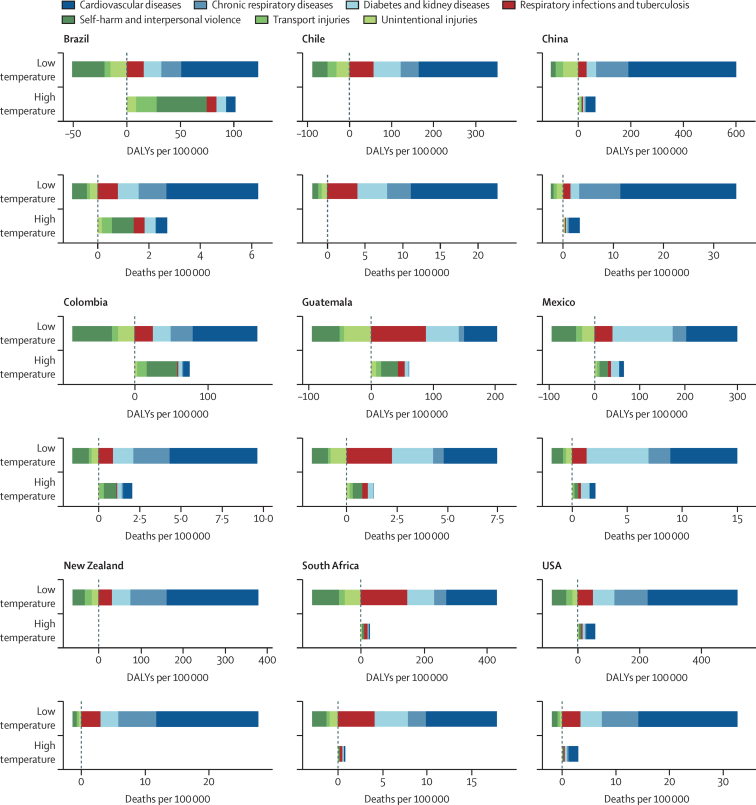
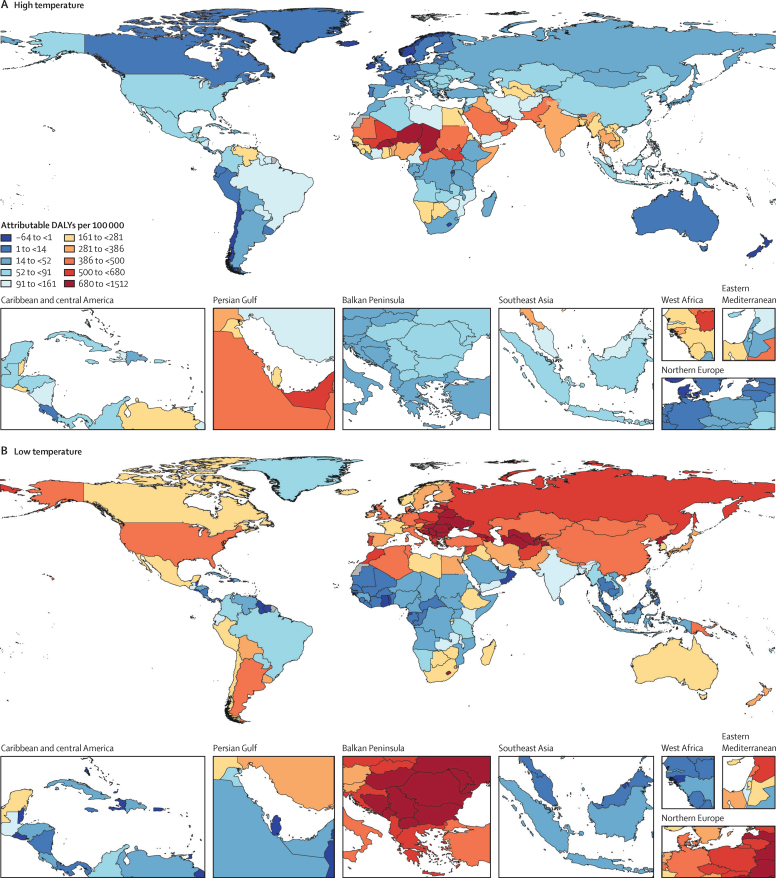
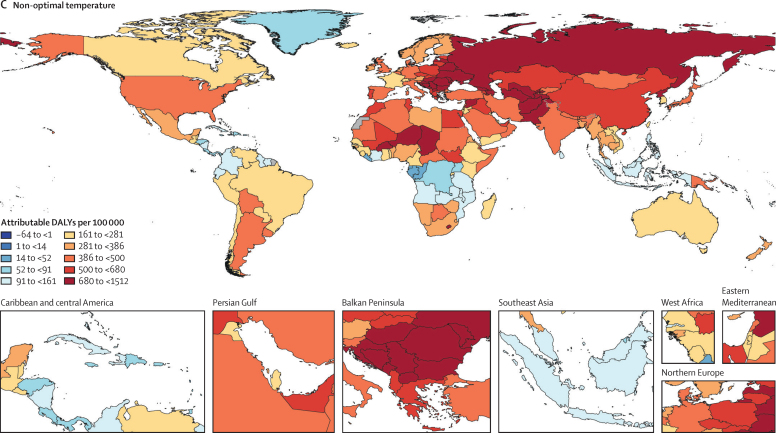
Findings: We included 64·9 million individual International Classification of Diseases-coded deaths from nine different countries, occurring between Jan 1, 1980, and Dec 31, 2016. 17 causes of death met the inclusion criteria. Ischaemic heart disease, stroke, cardiomyopathy and myocarditis, hypertensive heart disease, diabetes, chronic kidney disease, lower respiratory infection, and chronic obstructive pulmonary disease showed J-shaped relationships with daily temperature, whereas the risk of external causes (eg, homicide, suicide, drowning, and related to disasters, mechanical, transport, and other unintentional injuries) increased monotonically with temperature. The theoretical minimum risk exposure levels varied by location and year as a function of the underlying cause of death composition. Estimates for non-optimal temperature ranged from 7·98 deaths (95% uncertainty interval 7·10-8·85) per 100 000 and a population attributable fraction (PAF) of 1·2% (1·1-1·4) in Brazil to 35·1 deaths (29·9-40·3) per 100 000 and a PAF of 4·7% (4·3-5·1) in China. In 2019, the average cold-attributable mortality exceeded heat-attributable mortality in all countries for which data were available. Cold effects were most pronounced in China with PAFs of 4·3% (3·9-4·7) and attributable rates of 32·0 deaths (27·2-36·8) per 100 000 and in New Zealand with 3·4% (2·9-3·9) and 26·4 deaths (22·1-30·2). Heat effects were most pronounced in China with PAFs of 0·4% (0·3-0·6) and attributable rates of 3·25 deaths (2·39-4·24) per 100 000 and in Brazil with 0·4% (0·3-0·5) and 2·71 deaths (2·15-3·37). When applying our framework to all countries globally, we estimated that 1·69 million (1·52-1·83) deaths were attributable to non-optimal temperature globally in 2019. The highest heat-attributable burdens were observed in south and southeast Asia, sub-Saharan Africa, and North Africa and the Middle East, and the highest cold-attributable burdens in eastern and central Europe, and central Asia.
Interpretation: Acute heat and cold exposure can increase or decrease the risk of mortality for a diverse set of causes of death. Although in most regions cold effects dominate, locations with high prevailing temperatures can exhibit substantial heat effects far exceeding cold-attributable burden. Particularly, a high burden of external causes of death contributed to strong heat impacts, but cardiorespiratory diseases and metabolic diseases could also be substantial contributors. Changes in both exposures and the composition of causes of death drove changes in risk over time. Steady increases in exposure to the risk of high temperature are of increasing concern for health.
Funding: Bill & Melinda Gates Foundation.
Copyright © 2021 The Author(s). Published by Elsevier Ltd. This is an Open Access article under the CC BY 4.0 license. Published by Elsevier Ltd.. All rights reserved.
Conflict of interest statement
Declaration of interests We declare no competing interests.
Figures
Comment in
-
Health in a world of extreme heat.Lancet. 2021 Aug 21;398(10301):641. doi: 10.1016/S0140-6736(21)01860-2. Lancet. 2021. PMID: 34419190 No abstract available.
-
Global mortality burden attributable to non-optimal temperatures.Lancet. 2022 Mar 19;399(10330):1113. doi: 10.1016/S0140-6736(22)00179-9. Lancet. 2022. PMID: 35305734 No abstract available.
-
Eight year study on evolution of antimicrobial resistance in an antimicrobial-naïve trauma population.Indian J Med Microbiol. 2023 Jul-Aug;44:100355. doi: 10.1016/j.ijmmb.2023.01.013. Epub 2023 May 11. Indian J Med Microbiol. 2023. PMID: 37356848
References
-
- Luber G, Knowlton K, Balbus J. In: Human Health. Climate change impacts in the United States: the third national climate assessment. Melillo JM, Richmond T, Yohe GW, editors. Cambridge University Press; Cambridge: 2014. Climate change impacts in the United States: Chapter 9 human health; pp. 220–256.
-
- McMichael AJ, WHO. World Meteorological Organization. United Nations Environment Programme . World Health Organization; Geneva: 2003. Climate change and human health: risks and responses: summary.
-
- Burkart K, Khan MMH, Schneider A. The effects of season and meteorology on human mortality in tropical climates: a systematic review. Trans R Soc Trop Med Hyg. 2014;108:393–401. - PubMed
Publication types
MeSH terms
LinkOut - more resources
Full Text Sources
Medical
Research Materials
Miscellaneous
