. 2021 Nov;14(11):2265-2267.
doi: 10.1016/j.jcmg.2021.06.017. Epub 2021 Aug 18.

Intravascular Molecular-Structural Assessment of Arterial Inflammation in Preclinical Atherosclerosis Progression

Intravascular Molecular-Structural Assessment of Arterial Inflammation in Preclinical Atherosclerosis Progression

Eric A Osborn et al. JACC Cardiovasc Imaging. 2021 Nov.
No abstract available


Figures

FIGURE 1
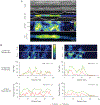
FIGURE 1. Intravascular Molecular-Structural NIRF-OCT Arterial Plaque Inflammation Imaging in Vivo
(A) Representative multimodal images at 12 weeks after balloon injury. X-ray angiography demonstrates mild atherosclerosis in the balloon-injured zone (white line). Longitudinal optical coherence tomography (OCT) and 1-dimensional (1D) average near-infrared fluorescence (NIRF) inflammation image overlay (yellow/green is high; blue is low). In vivo 2-dimensional (2D) near-infrared fluorescence maps reveal heterogeneous near-infrared fluorescence inflammation across the catheter pull back, corroborated by ex vivo fluorescence reflectance imaging (FRI) near-infrared fluorescence. (Scale = 5 mm.) (B) Serial intravascular near-infrared fluorescence–optical coherence tomography imaging. The color bar indicates regions of high (yellow/green) and low (blue) near-infrared fluorescence inflammation. Quantitative 1-dimensional near-infrared fluorescence and near-infrared fluorescence ratio (integrated near-infrared fluorescence signal at 16 weeks divided by 8 weeks) and 1-dimensional plaque burden (PB) plot and percent atheroma volume (PAV) ratio (16 weeks/8 weeks). (C) Baseline near-infrared fluorescence inflammation is associated with change in plaque burden plaque progression. Representative axial slice at 8 weeks showing high near-infrared fluorescence inflammatory protease activity followed by high intravascular ultrasound (IVUS) plaque progression from 8 weeks-12 weeks (v = vessel, fiducial). External elastic membrane (yellow) minus lumen (white) contours define the atheroma cross-sectional area (CSA). (Scale = 1 mm.) (D) Baseline near-infrared fluorescence inflammation is associated with change in percent atheroma volume plaque progression. Univariable regression per animal comparing 8-week near-infrared fluorescence inflammation and intravascular ultrasound change in percent atheroma volume plaque progression between 8 weeks and 12 or 16 weeks. **P < 0.01.

References

    1. Azen SP, Mack WJ, Cashin-Hemphill L, et al. Progression of coronary artery disease predicts clinical coronary events. Long-term follow-up from the Cholesterol Lowering Atherosclerosis Study. Circulation. 1996;93:34–41. - PubMed
    1. Osborn EA, Jaffer FA. The advancing clinical impact of molecular imaging in CVD. J Am Coll Cardiol Img. 2013;6:1327–1341. - PMC - PubMed
    1. Jaffer FA, Vinegoni C, John MC, et al. Real-time catheter molecular sensing of inflammation in proteolytically active atherosclerosis. Circulation. 2008;118:1802–1809. - PMC - PubMed
    1. Ughi GJ, Wang H, Gerbaud E, et al. Clinical characterization of coronary atherosclerosis with dual-modality OCT and near-infrared autofluorescence imaging. J Am Coll Cardiol Img. 2016;9:1304–1314. - PMC - PubMed
    1. Whitley MJ, Cardona DM, Lazarides AL, et al. A mouse-human phase 1 co-clinical trial of a protease-activated fluorescent probe for imaging cancer. Sci Transl Med. 2016;8:320ra4. - PMC - PubMed