

Nasopharyngeal metabolomics and machine learning approach for the diagnosis of influenza
- PMID: 34419924
- PMCID: PMC8385175
- DOI: 10.1016/j.ebiom.2021.103546
Nasopharyngeal metabolomics and machine learning approach for the diagnosis of influenza
Abstract
Background: Respiratory virus infections are significant causes of morbidity and mortality, and may induce host metabolite alterations by infecting respiratory epithelial cells. We investigated the use of liquid chromatography quadrupole time-of-flight mass spectrometry (LC/Q-TOF) combined with machine learning for the diagnosis of influenza infection.
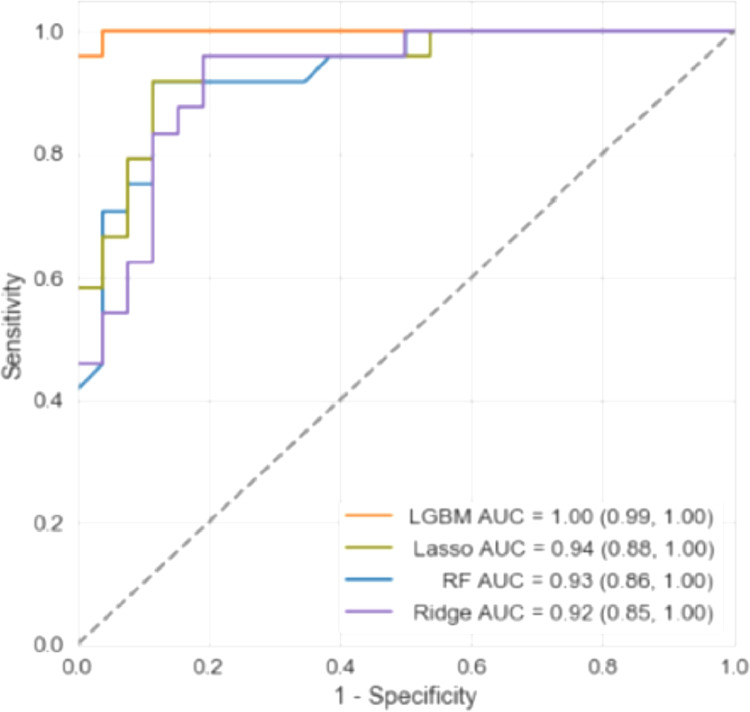
Methods: We analyzed nasopharyngeal swab samples by LC/Q-TOF to identify distinct metabolic signatures for diagnosis of acute illness. Machine learning models were performed for classification, followed by Shapley additive explanation (SHAP) analysis to analyze feature importance and for biomarker discovery.
Findings: A total of 236 samples were tested in the discovery phase by LC/Q-TOF, including 118 positive samples (40 influenza A 2009 H1N1, 39 influenza H3 and 39 influenza B) as well as 118 age and sex-matched negative controls with acute respiratory illness. Analysis showed an area under the receiver operating characteristic curve (AUC) of 1.00 (95% confidence interval [95% CI] 0.99, 1.00), sensitivity of 1.00 (95% CI 0.86, 1.00) and specificity of 0.96 (95% CI 0.81, 0.99). The metabolite most strongly associated with differential classification was pyroglutamic acid. Independent validation of a biomarker signature based on the top 20 differentiating ion features was performed in a prospective cohort of 96 symptomatic individuals including 48 positive samples (24 influenza A 2009 H1N1, 5 influenza H3 and 19 influenza B) and 48 negative samples. Testing performed using a clinically-applicable targeted approach, liquid chromatography triple quadrupole mass spectrometry, showed an AUC of 1.00 (95% CI 0.998, 1.00), sensitivity of 0.94 (95% CI 0.83, 0.98), and specificity of 1.00 (95% CI 0.93, 1.00). Limitations include lack of sample suitability assessment, and need to validate these findings in additional patient populations.
Interpretation: This metabolomic approach has potential for diagnostic applications in infectious diseases testing, including other respiratory viruses, and may eventually be adapted for point-of-care testing.
Funding: None.
Keywords: Diagnosis; Host response; Influenza; Mass spectrometry; Metabolomics.
Copyright © 2021 The Authors. Published by Elsevier B.V. All rights reserved.
Conflict of interest statement
Declaration of Competing Interest A provisional patent covering the metabolomics approach combined with machine learning to recognize a medical condition has been filed (C.A.H., P.R., A.T.L., T.M.C., B.P.). The authors declare no other competing interests.
Figures


References
MeSH terms
Substances
Grants and funding
LinkOut - more resources
Full Text Sources
Medical
