. 2021 Sep 24;6(9):3163-3169.
doi: 10.1021/acssensors.1c01085. Epub 2021 Aug 22.

A Protein-Based Biosensor for Detecting Calcium by Magnetic Resonance Imaging

A Protein-Based Biosensor for Detecting Calcium by Magnetic Resonance Imaging

Harun F Ozbakir et al. ACS Sens. .

Abstract

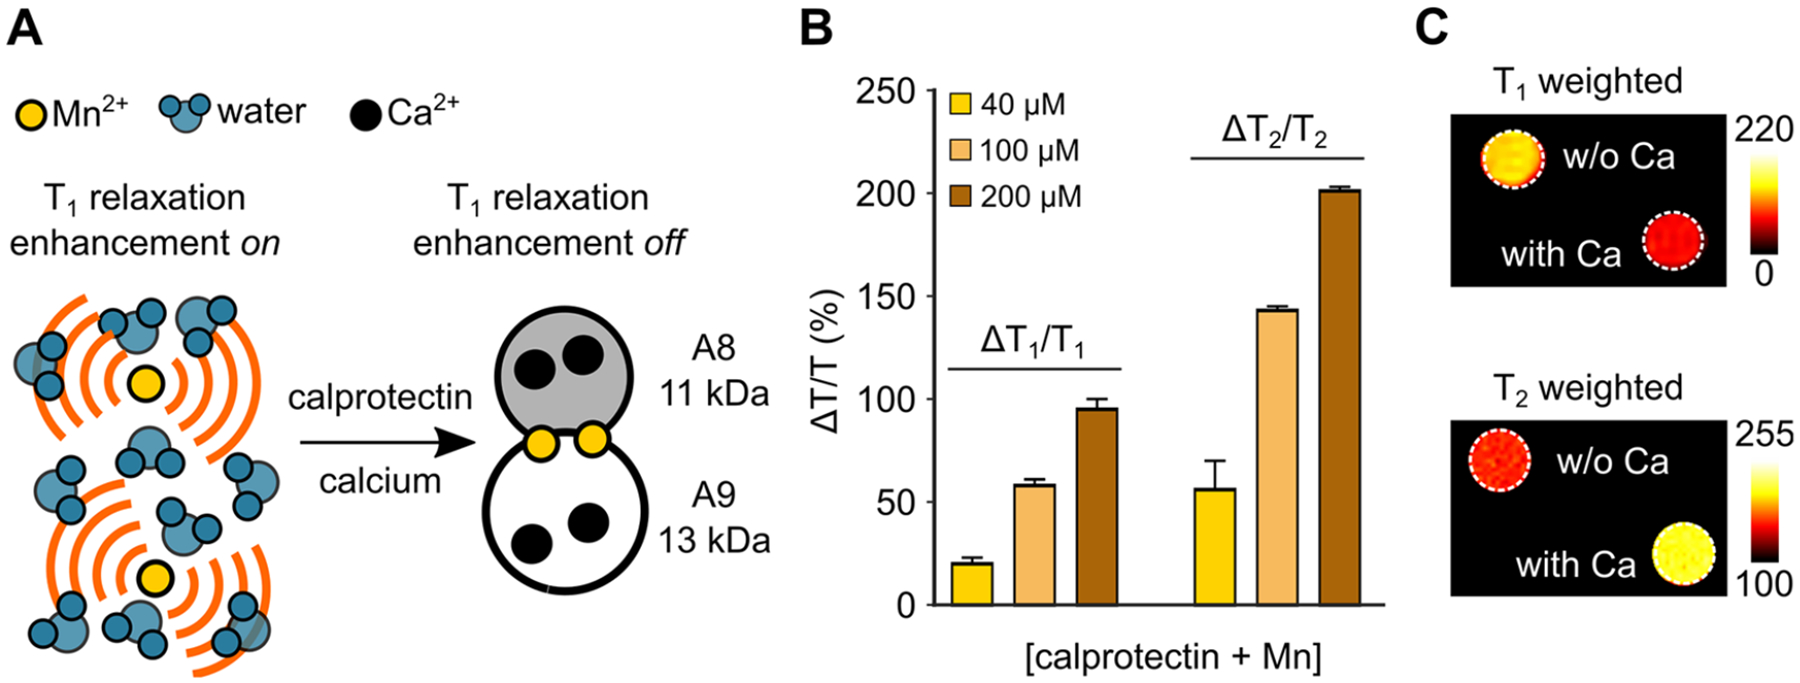
Calcium-responsive contrast agents for magnetic resonance imaging (MRI) offer a promising approach for noninvasive brain-wide monitoring of neural activity at any arbitrary depth. Current examples of MRI-based calcium probes involve synthetic molecules and nanoparticles, which cannot be used to examine calcium signaling in a genetically encoded form. Here, we describe a new MRI sensor for calcium, based entirely on a naturally occurring calcium-binding protein known as calprotectin. Calcium-binding causes calprotectin to sequester manganese ions, thereby limiting Mn2+ enhanced paramagnetic relaxation of nearby water molecules. We demonstrate that this mechanism allows calprotectin to alter T1 and T2 based MRI signals in response to biologically relevant calcium concentrations. The resulting response amplitude, i.e., change in relaxation time, is comparable to existing MRI-based calcium sensors as well as other reported protein-based MRI sensors. As a preliminary demonstration of its biological applicability, we used calprotectin to detect calcium in a lysed hippocampal cell preparation as well as in intact Chinese hamster ovary cells treated with a calcium ionophore. Calprotectin thus represents a promising path toward noninvasive imaging of calcium signaling by combining the molecular and cellular specificity of genetically encodable tools with the ability of MRI to image through scattering tissue of any size and depth.

Keywords: Mn2+ enhanced MRI; calcium imaging; genetically encoded reporters; magnetic resonance imaging; neuroimaging.


Conflict of interest statement

The authors declare no competing financial interest.

Figures

Figure 1.
Figure 1.
Principle of calcium imaging with calprotectins. (A) Proposed mechanism of MRI contrast induced by sequestration of paramagnetic Mn2+ ions by calprotectin in the presence of calcium. (B) Percent change in T1 and T2 relaxation times obtained for a binary mixture of calprotectin (40, 100, and 200 μM) and Mn2+ (30, 75, and 150 μM) in response to saturating amounts of calcium (2 mM) in HEPES buffer 9; pH 7.4). (C) T1 and T2 weighted images of calcium (2 mM) induced MRI contrast obtained with a binary mixture of 200 μM calprotectin and 150 μM Mn2+. All MRI measurements were performed at 7 T. Error bars represent standard error of mean from 5 independent replicates.
Figure 2.
Figure 2.
In vitro MRI relaxometry of calprotectin-based Ca2+ sensors. In the presence of calcium (2 mM), (A) T1 and (B) T2 relaxation times exhibit a significantly smaller decrease with increasing Mn2+ concentrations due to Mn2+ sequestration by calprotectin. The solid lines represent best fits to equilibrium binding isotherms. (C) Dissociation constants for Mn2+ binding to calprotectin (CP) and His3Asp variant (mut.) in the presence and absence of saturating calcium (2 mM), estimated from model-fitting of T1 titration results. (D) Calcium-induced percent change in T1 and T2 for calprotectin and the His3Asp mutant. (E) Calprotectin does not produce a change in T1 and T2 values or (F) detectable T1 and T2 weighted MRI contrast in response to saturating amounts of Mg2+ (2 mM). For all experiments, protein and calcium concentrations were 40 μM and 2 mM, respectively. Mn2+ was either titrated from 0 to 30 μM (A,B) or used at 30 μM (D–F). Relaxation rates were measured at 7 T. Error bars represent standard error of mean from 3–5 independent replicates. * denotes p < 0.05 and n.s. indicates p > 0.05 (Student’s t test).
Figure 3.
Figure 3.
MRI-based sensing of biologically relevant calcium concentrations. (A) Percent change in T1 and T2 relaxation times in response to calcium concentrations spanning 0.1 μM to 1 mM. Calprotectin and Mn2+ concentrations were 40 μM and 30 μM, respectively. (B) Percent change in relaxation times obtained by adding calprotectin (40 μM) and Mn2+ (30 μM) to a hippocampal cell lysate preparation treated with biologically relevant concentrations of calcium (1, 5, and 24 μM). (C) Change in T1 elicited by stimulating calcium entry in Chinese hamster ovary (CHO) cells lentivirally transduced with calprotectin-expressing vectors and treated with 10 μM calcimycin, a calcium ionophore. As ionophore treatment by itself alters cellular T1, all values are normalized to T1 values measured concurrently in identically treated CHO cells that have not been transduced to express calprotectin. Relaxation rates were measured at 7 T. Error bars represent standard error of mean from 3–5 independent replicates. * denotes p < 0.05 and ** indicates p < 0.01 (Student’s t test).

References

    1. Simons TJB Calcium and neuronal function. Neurosurg. Rev 1988, 11, 119–129. - PubMed
    1. Brini M; Cali T; Ottolini D; Carafoli E Neuronal calcium signaling: function and dysfunction. Cell. Mol. Life Sci 2014, 71 (15), 2787–814. - PMC - PubMed
    1. Grienberger C; Konnerth A Imaging calcium in neurons. Neuron 2012, 73 (5), 862–885. - PubMed
    1. Wang W; Kim CK; Ting AY Molecular tools for imaging and recording neuronal activity. Nat. Chem. Biol 2019, 15 (2), 101–110. - PubMed
    1. Tian L; Akerboom J; Schreiter ER; Looger LL Neural activity imaging with genetically encoded calcium indicators. Prog. Brain Res 2012, 196, 79–94. - PubMed

Publication types