Review
. 2022 Mar 1;21(1):168-181.
doi: 10.2463/mrms.rev.2021-0031. Epub 2021 Aug 21.

Diagnosis of Hepatocellular Carcinoma Using Gd-EOB-DTPA MR Imaging

Affiliations
Review

Diagnosis of Hepatocellular Carcinoma Using Gd-EOB-DTPA MR Imaging

Takamichi Murakami et al. Magn Reson Med Sci. .

Abstract

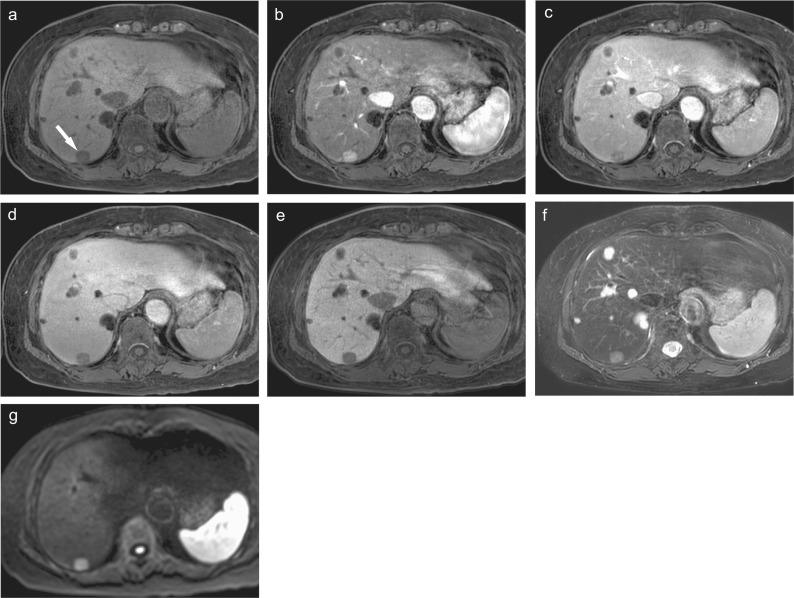
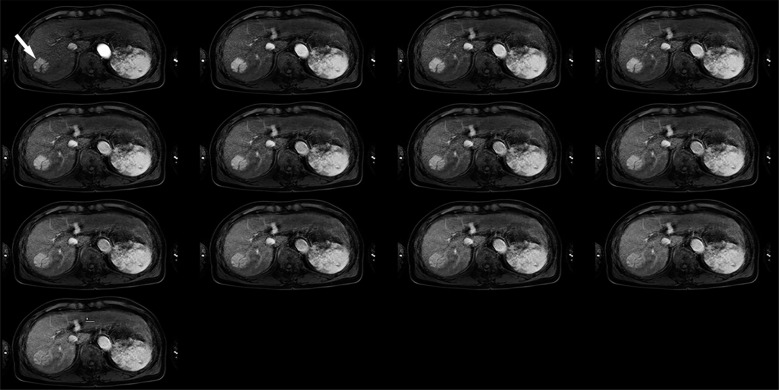
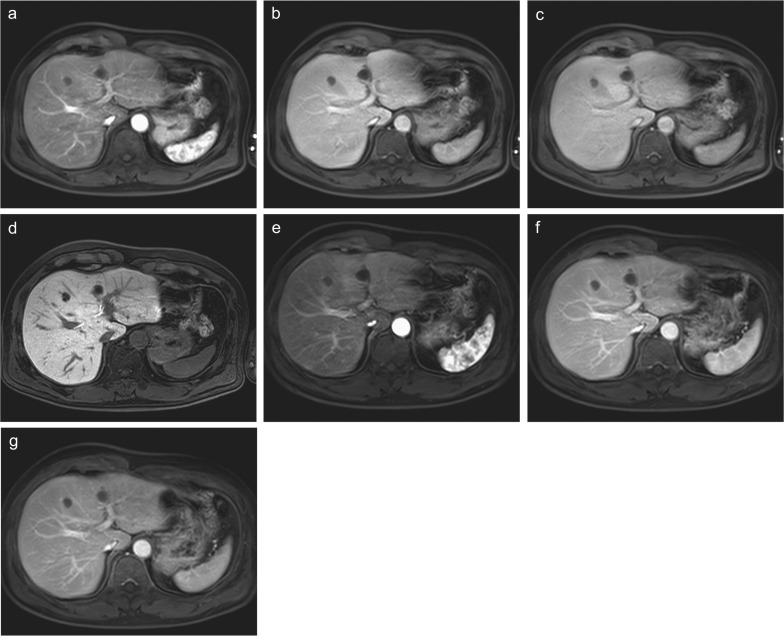
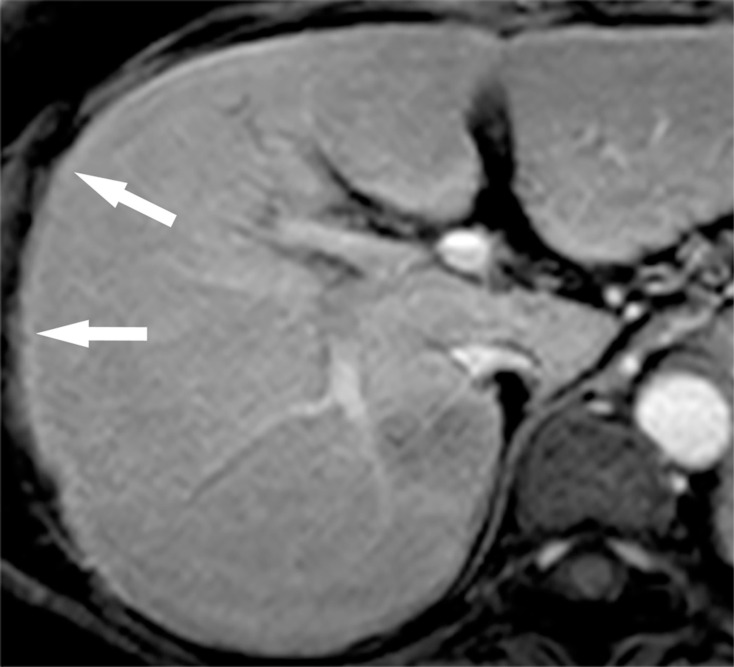
Gadolinium ethoxybenzyl diethylenetriamine pentaacetic acid (Gd-EOB-DTPA; Gadoxetic acid; Gadoxetate disodium) is a hepatocyte-specific MR contrast agent. It acts as an extracellular contrast agent in the early phase after intravenous injection, and then is taken up by hepatocytes later. Using this contrast agent, we can evaluate the hemodynamics of the liver and liver tumors, and can therefore improve the detection and characterization of hepatocellular carcinoma (HCC). Gd-EOB-DTPA helps in the more accurate detection of hypervascular HCC than by other agents. In addition, Gd-EOB-DTPA can detect hypovascular HCC, which is an early stage of the multi-stage carcinogenesis, with a low signal in the hepatobiliary phase. In addition to tumor detection and characterization, Gd-EOB-DTPA contrast-enhanced MR imaging can be applied for liver function evaluation and prognoses evaluation. Thus, Gd-EOB-DTPA plays an important role in the diagnosis of HCC. However, we have to employ optimal imaging techniques to improve the diagnostic ability. In this review, we aimed to discuss the characteristics of the contrast media, optimal imaging techniques, diagnosis, and applications.

Keywords: gadoxetic acid; hepatocellular carcinoma; liver; magnetic resonance; xetate disodium.


Conflict of interest statement

Conflicts of Interest

The authors declare that they have no conflicts of interest.

Figures

Fig. 1
Fig. 1
Gd-EOB-DTPA-enhanced MR images of hypervascular hepatocellular carcinoma. (a) Precontrast fat-suppressed 3D Fourier transformation T1-weighted MR image showing a small low-intensity lesion in the posterior lobe of the liver (arrow). (b) Arterial phase image showing the early enhanced tumor. (c) Portal venous phase and (d) transitional phase images showing the tumor as a hypointense area. (e) Hepatobiliary phase image showing a marked low-intensity tumor, suggesting the lack of hepatocellular function. (f) Fat-suppressed T2-weighted image and (g) diffusion-weighted image (b value = 800 s/mm2) showing the hyperintense tumor. These images show a characteristic finding of hypervascular hepatocellular carcinoma. Multiple cysts are also seen in the liver. Gd-EOB-DTPA, Gadolinium ethoxybenzyl diethylenetriamine pentaacetic acid.
Fig. 2
Fig. 2
Hypervascular hepatocellular carcinoma (arrow) in the right lobe of the liver. A 3D Fourier transformation gradient-echo sequence with a parallel imaging and keyhole data sampling techniques can show sequential enhancement of hypervascular hepatocellular carcinoma during the 20-second breath-holding without severe artifacts caused by respiratory motion.
Fig. 3
Fig. 3
A comparison of dynamic MR images between Gd-EOB-DTPA enhancement and extracellular Gd contrast enhancement in the same patient. Gd-EOB-DTPA-enhanced (a) arterial, (b) portal venous, (c) transitional, and (d) hepatobiliary phase images and extracellular Gd contrast-enhanced (e) arterial, (f) portal venous, and (g) equilibrium phase images are shown. Although arterial phase images are similar between the images using two contrast agents, the contrast between the liver parenchyma and vasculatures is better in (f) extracellular Gd contrast-enhanced images than in (b) Gd-EOB-DTPA-enhanced images in the portal venous phase. The difference is more prominent between (g) extracellular Gd contrast-enhanced equilibrium phase image and (c) Gd-EOB-DTPA-enhanced transitional phase image probably due to slight uptake of Gd-EOB-DTPA into hepatocytes. The hepatic parenchyma shows a high signal and the vasculature shows a low signal in (d) Gd-EOB-DTPA-enhanced hepatobiliary phase. Gd-EOB-DTPA, Gadolinium ethoxybenzyl diethylenetriamine pentaacetic acid.
Fig. 4
Fig. 4
Gd-EOB-DTPA-enhanced arterial phase image. High-intensity band is seen at the margin of the liver (arrows). This marginal high intensity is an artifact that is sometimes observed when k-space data collection is centrally ordered. Gd-EOB-DTPA, Gadolinium ethoxybenzyl diethylenetriamine pentaacetic acid.
Fig. 5
Fig. 5
T1 mapping images after intraarterial chemotherapy to the right lobe of the liver. T1 mapping images calculated using the Look-Locker sequence (TR, 12 ms; TE, 1.7 ms; flip angle, 7 deg) obtained (a) before Gd-EOB-DTPA administration and (b) 18 min after administration. Precontrast T1 relaxation times were 937.1 and 878.1 ms for the right and left lobe of the liver, respectively. Post-contrast times were 495.8 and 350.2 ms for the right and left lobe, respectively. The reduction rates of T1 relaxation time were 47.1% and 60.1%, respectively. This patient underwent arterial injection chemotherapy before MR imaging. Anti-cancer drug was injected only into the right hepatic artery. The reduction rate is higher in the left lobe than in the right lobe, suggesting better hepatocyte function in the left lobe of the liver. Gd-EOB-DTPA, Gadolinium ethoxybenzyl diethylenetriamine pentaacetic acid.
Fig. 6
Fig. 6
Moderately differentiated hepatocellular carcinoma. (a) Precontrast MR image showing a hypointense nodule (arrow). (b) Gd-EOB-DTPA-enhanced arterial phase image showing the tumor as a hypervascular one. (c) Gd-EOB-DTPA-enhanced transitional phase image. (d) Hepatobiliary phase image showing that the tumor that was more enhanced than the liver parenchyma. (e) Image showing the tumor that has a diffuse greenish color on the cut surface. These types of tumor take up Gd-EOB-DTPA through the OATP1 transporter but accumulate Gd-EOB-DTPA in the small bile ducts and pseudogland owing to an immature excretory system. Gd-EOB-DTPA, Gadolinium ethoxybenzyl diethylenetriamine pentaacetic acid; OATP, organic anion transporting polypeptide.
Fig. 7
Fig. 7
Pathologically confirmed well-differentiated hepatocellular carcinoma. (a) Precontrast fat-suppressed 3D Fourier transformation T1-weighted MR image showing a lesion in the lateral segment (arrow) that is almost iso-intense compared to the surrounding liver parenchyma. (Reprinted, with permission, from reference #7). Gd-EOB-DTPA-enhanced (b) arterial phase and (c) transitional phase images showing the tumor as iso- and hypointense nodules, respectively (arrows). (d) Hepatobiliary phase image showing a hypointense nodule (arrow). (e) Unenhanced T2*-weighted gradient-echo image showing the lesion as an iso-intense area compared to the surrounding liver parenchyma. (f) Superparamagnetic iron oxide (ferucarbotran)-enhanced T2*-weighted gradient-echo image (TR/TE/flip angle, 200/14/50 deg) obtained approximately 15 min after the injection (Kupffer phase) showing the nodule as an iso-intense area, indicating the similarity of intramodular Kupffer cell function between the nodule and the surrounding liver parenchyma. (g) CT during hepatic arteriography shows iso-attenuation, and (h) CT during arterial portography shows a slight low-attenuation compared to the surrounding liver parenchyma (arrow). Gd-EOB-DTPA, Gadolinium ethoxybenzyl diethylenetriamine pentaacetic acid.
Fig. 8
Fig. 8
Hemangioma of the liver. (a) Precontrast fat-suppressed 3D Fourier transformation T1-weighted MR image showing a hypointense small lesion in the lateral segment (arrow). Gd-EOB-DTPA-enhanced (b) arterial, (b) portal venous, and (d) transitional phase images showing peripheral globular enhancement pattern in the tumor. Gd-EOB-DTPA-enhanced (e) hepatobiliary phase image showing a hypointense nodule. Hemangiomas do not show prolonged enhancement that is usually shown in extracellular Gd contrast-enhanced MR imaging. (f) Fat-suppressed T2-weighted MR image showing the tumor as a strongly hyperintense tumor. It is important to detect characteristic findings such as peripheral globular enhancement, and a relatively stronger high signal on T2-weighted images to differentiate hepatocellular carcinoma from hemangioma. Gd-EOB-DTPA, Gadolinium ethoxybenzyl diethylenetriamine pentaacetic acid.

References

    1. Huppertz A, Balzer T, Blakeborough A, et al. European EOB study group. Improved detection of focal liver lesions at MR imaging: multicenter comparison of gadoxetic acid-enhanced MR images with intraoperative findings. Radiology 2004; 230:266–275. - PubMed
    1. Jung G, Breuer J, Poll LW, et al. Imaging characteristics of hepatocellular carcinoma using the hepatobiliary contrast agent Gd-EOB-DTPA. Acta Radiol 2006; 47:15–23. - PubMed
    1. Narita M, Hatano E, Arizono S, et al. Expression of OATP1B3 determines uptake of Gd-EOB-DTPA in hepatocellular carcinoma. J Gastroenterol 2009; 44:793–798. - PubMed
    1. Kitao A, Zen Y, Matsui O, et al. Hepatocellular carcinoma: signal intensity at gadoxetic acid-enhanced MR Imaging—correlation with molecular transporters and histopathologic features. Radiology 2010; 256:817–826. - PubMed
    1. Tsuboyama T, Onishi H, Kim T, et al. Hepatocellular carcinoma: hepatocyte-selective enhancement at gadoxetic acid-enhanced MR imaging—correlation with expression of sinusoidal and canalicular transporters and bile accumulation. Radiology 2010; 255:824–833. - PubMed

MeSH terms