. 2021 Aug 6:12:714897.
doi: 10.3389/fimmu.2021.714897. eCollection 2021.

Mitochondrial Reactive Oxygen Species Are Essential for the Development of Psoriatic Inflammation

Affiliations

Mitochondrial Reactive Oxygen Species Are Essential for the Development of Psoriatic Inflammation

Soichi Mizuguchi et al. Front Immunol. .

Abstract

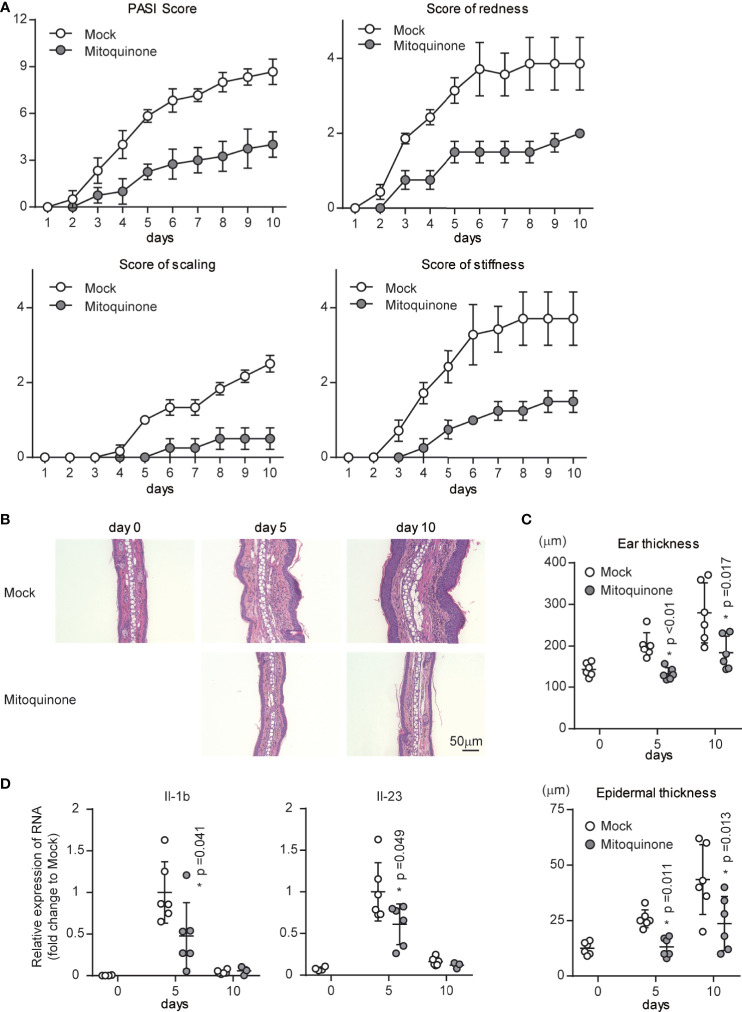
Psoriasis is a common immune-mediated, chronic, inflammatory skin disease that affects approximately 2-3% of the population worldwide. Although there is increasing evidence regarding the essential roles of the interleukin (IL)-23/IL-17 axis and dendritic cell (DC)-T cell crosstalk in the development of skin inflammation, the contributions of mitochondrial function to psoriasis are unclear. In a mouse model of imiquimod (IMQ)-induced psoriasiform skin inflammation, we found that hematopoietic cell-specific genetic deletion of p32/C1qbp, a regulator of mitochondrial protein synthesis and metabolism, protects mice from IMQ-induced psoriatic inflammation. Additionally, we demonstrate that p32/C1qbp is an important regulator of IMQ-induced DC activation, both in vivo and in vitro. We also found that p32/C1qbp-deficient DCs exhibited impaired production of IL-1β, IL-23, and mitochondrial reactive oxygen species (mtROS) after IMQ stimulation. Because the inhibition of mtROS suppressed IMQ-induced DC activation and psoriatic inflammation, we presume that p32/C1qbp and mtROS can serve as therapeutic targets in psoriasis.

Keywords: C1qbp/p32; IL-1β; dendritic cells; mitochondrial ROS; psoriasis.


Conflict of interest statement

The authors declare that the research was conducted in the absence of any commercial or financial relationships that could be construed as a potential conflict of interest.

Figures

Figure 1
Figure 1
Effects of p32/C1qbp deficiency on psoriatic inflammation. (A) Gene expression patterns of p32/C1qbp in lesions from patients with psoriasis (n = 9) versus healthy individuals (n = 8) from Gene Expression Omnibus (http://www.ncbi.nlm.nih.gov/geo; accession number GSE75890). (B–D) WT and p32cKO mice were topically treated with IMQ for 9 consecutive days. Representative gross appearances of ears from WT and p32cKO mice that were treated daily with topical IMQ (B). Cumulative Psoriasis Area Severity Index (PASI) scores (C) were calculated based on the individual scores for redness, scaling, and stiffness (D) daily until 9 days after IMQ application. Data are shown as means ± SDs (n = 8). (E–G) Microscope images of cross-sections of mouse ears stained with hematoxylin and eosin (E) and subjected to immunohistochemical analysis of Ki-67 (G). Changes in ear (F upper) and epidermal (F lower) thickness over time. Scale bars, 50 µm. Data are shown as means ± SDs (A, C, D, F). *p < 0.05 versus WT mice. Data are representative of at least three (A–G) independent experiments.
Figure 2
Figure 2
Roles of p32/C1qbp in psoriatic inflammation in vivo. (A–C) WT and p32cKO mice were treated with IMQ for 9 consecutive days. Real-time PCR analysis was performed to assess mRNA levels in IMQ-treated mouse ears on days 5 and 10 (n ≥ 3). The results were normalized to 18S expression and are shown as means ± SDs. (D–F) WT and p32cKO mice (n ≥ 3) were treated with IMQ for 4 consecutive days. Infiltration of neutrophils (D), IL-17+ γδ T cells (E), and CD40+ CD86+ DCs populations in the ears were analyzed by flow cytometry. IL-17+ γδ T cell numbers were analyzed before (E, left and middle lanes) and after (E, right lane) PMA/ionomycin (PI) stimulation in vitro. Expression levels of CD40 and CD86 were measured in DCs obtained from the ears of WT and p32 cKO mice. Results are expressed as means ± SDs. Data are shown as means ± SDs (A–F). *p < 0.05 versus WT mice. Data are representative of at least three (A–F) independent experiments.
Figure 3
Figure 3
Roles of p32/C1qbp in vitro. (A) Real-time PCR analyses of Il-1b, Il-23, Il-12b, and Ifnb1 expression levels in WT and p32−/− DCs stimulated with 5 μg/mL IMQ for the indicated intervals. Data are shown as means ± SEMs after normalization to expression of the gene encoding 18S ribosomal RNA (18S rRNA). (B, C) Levels of IL-1β (B) and IL-23 (C) in cell culture supernatants were compared between WT and p32−/− BMDCs (2×10⁵ cells/well) after 24 h of stimulation with IMQ. Data are shown as means ± SDs of triplicate wells. (D, E) WT and p32−/− DCs were stimulated with 5 μg/mL IMQ for the indicated intervals and analyzed for IL-1β p17, caspase-1 p20 (D), and phosphorylation of IKK-αβ (E). β-Actin was used as an internal control. (F) Expression levels of cell surface markers of CD86 and CD40 in WT (upper) and p32−/− (lower) BMDCs left untreated (−) or stimulated for 12 h with IMQ and analyzed using flow cytometry to quantify cell surface staining of CD86 and CD40. Numbers in top right corners indicate the percentages of CD86+ CD40+ cells. Data are representative of two (A) and three (B–F) independent experiments.
Figure 4
Figure 4
p32/C1qbp regulates mitochondrial metabolism and ROS after IMQ stimulation. (A–D) Real-time changes in the ECAR (A, B) or OCR (C, D) in WT (A, C) and p32−/− (B, D) DCs treated with 5 μg/mL IMQ. Vertical dotted lines indicate the initiation of treatment. Data are shown as means ± SDs of triplicate wells. (E) Comparisons of the amounts of metabolites between WT and p32−/− BMDCs with or without IMQ stimulation. Heat map of WT and p32−/− DC metabolites that exhibited statistically significant changes (P < 0.05). (F, G) Flow cytometry histograms (F) and quantification (G) of the expression of mitochondrial ROS (MitoSOX) in WT and p32−/− DCs treated with 5 or 25 μg/mL IMQ. Data are shown as means ± SDs of triplicate wells. Data are representative of two (E) and three (A–D, F–G) independent experiments.
Figure 5
Figure 5
Mitochondrial ROS are required for DC activation by IMQ stimulation. (A) WT DCs in the presence or absence of mitoquinone were stimulated with 5 or 25 μg/mL IMQ and analyzed for the expression of mitochondrial ROS (MitoSOX). Data are shown as means ± SDs (n = 4). (B, C) WT DCs in the presence or absence of mitoquinone were stimulated with IMQ and analyzed to quantify the expression of cell surface markers CD86 and CD40 (C). Numbers in the top right corners indicate the percentages of CD86+ CD40+ cells (B, left). Pooled results from three independent experiments are shown (B, right). Data are shown as means ± SDs of triplicate samples. (D, E) Cytokine production was compared among WT DCs exposed to mock treatment or mitoquinone. Cells were stimulated with 5 or 25 μg/mL IMQ for 24 h in the presence or absence of inhibitors. Data indicate the levels of IL-1β (D) and IL-23 (E) in cell culture supernatants (means ± SDs of triplicate wells). Data are shown as means ± SDs. *p < 0.05 versus mock treatment. Data are representative of three independent experiments.
Figure 6
Figure 6
Effects of a mitochondrial ROS inhibitor on psoriatic inflammation in vivo. WT mice were topically treated with IMQ for 9 consecutive days and received either mitoquinone or mock treatment every 2-3 days by intraperitoneal injection, beginning on day 0. (A) Cumulative Psoriasis Area Severity Index (PASI) scores were calculated based on the individual scores for redness, scaling, and stiffness daily until 9 days after IMQ application. Data are shown as means ± SDs (n = 4–6). (B, C) Microscopy of cross-sections of mouse ears stained with hematoxylin and eosin (B). Changes in ear (C upper) and epidermal (C lower) thickness over time. Scale bars, 50 µm. (D) Real-time PCR analysis was performed to assess mRNA levels in IMQ-treated mouse ears on days 5 and 10 (n ≥ 3). The results were normalized to 18S expression and are shown as means ± SDs. *p < 0.05 versus mock treatment. Data are representative of three independent experiments.

References

    1. Christophers E. Psoriasis–Epidemiology and Clinical Spectrum. Clin Exp Dermatol (2001) 26(4):314–20. 10.1046/j.1365-2230.2001.00832.x - DOI - PubMed
    1. Danielsen K, Olsen AO, Wilsgaard T, Furberg AS. Is the Prevalence of Psoriasis Increasing? A 30-Year Followup of a Population-Based Cohort. Br J Dermatol (2013) 168(6):1303–10. 10.1111/bjd.12230 - DOI - PubMed
    1. Parisi R, Symmons DPM, Griffiths CEM, Ashcroft DM, Management I. Global Epidemiology of Psoriasis: A Systematic Review of Incidence and Prevalence. J Invest Dermatol (2013) 133(2):377–85. 10.1038/jid.2012.339 - DOI - PubMed
    1. Egeberg A, Andersen YMF, Thyssen JP. Prevalence and Characteristics of Psoriasis in Denmark: Findings From the Danish Skin Cohort. BMJ Open (2019) 9(3):e028116. 10.1136/bmjopen-2018-028116 - DOI - PMC - PubMed
    1. Lowes MA, Bowcock AM, Krueger JG. Pathogenesis and Therapy of Psoriasis. Nature (2007) 445(7130):866–73. 10.1038/nature05663 - DOI - PubMed

Publication types