. 2021 Aug 2:2021:6142096.
doi: 10.1155/2021/6142096. eCollection 2021.

Peripheral Administration of NMU Promotes White Adipose Tissue Beiging and Improves Glucose Tolerance

Affiliations

Peripheral Administration of NMU Promotes White Adipose Tissue Beiging and Improves Glucose Tolerance

Yue Yuan et al. Int J Endocrinol. .

Abstract

Purpose: Targeting white adipose tissue (WAT) beiging has been proposed as an effective way to increase thermogenesis and improve glucose metabolism. Neuromedin U (NMU) is a neuropeptide that could increase energy expenditure, while its effects on WAT beiging and glucose homeostasis remain to be investigated.

Methods: Male C57BL/6 mice were fed with high fat diet (HFD) to induce obesity and hyperglycemia and then treated with chronic subcutaneous injection of NMU. Body weight and food intake were recorded daily. After 14 days of injection, intraperitoneal glucose tolerance tests and 18F-fluorodeoxyglucose micro-positron emission tomography/computed tomography (18F-FDG micro-PET/CT) scans were conducted. Subcutaneous WAT (sWAT) and interscapular brown adipose tissue were collected for the evaluation of adipocyte size, expression of uncoupling protein 1 (Ucp1), and other thermogenic-related genes. Stromal vascular fraction of subcutaneous WAT was extracted for the measurement of type 2 innate lymphocytes (ILC2s) proportions.

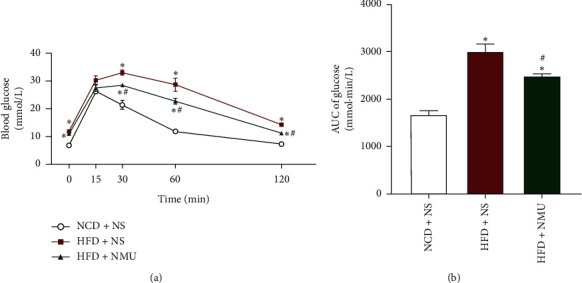
Results: Glucose tolerance was markedly improved by peripherally administered NMU. Micro-PET/CT suggested that NMU promoted WAT beiging, which was further confirmed by haematoxylin and eosin (H&E) staining and immunohistochemistry. In diet-induced-obese (DIO) mice, NMU activated thermogenic-related genes in WAT. In addition, NMU stimulated ILC2s in the stromal vascular fraction of WAT.

Conclusion: Taken together, our study indicates that peripheral administration of NMU is a potential therapeutic strategy for the promotion of WAT beiging and the improvement of impaired glucose tolerance.


Conflict of interest statement

The authors declare that they have no conflicts of interest.

Figures

Figure 1
Figure 1
Chronic subcutaneous administration of NMU improves glucose tolerance in DIO mice. (a) Blood glucose levels and (b) area under the curve of glucose levels of ipGTT after NMU administration (n = 5−6). p < 0.05 (compared to NCD + NS group). #p < 0.05 (compared to HFD + NS group).
Figure 2
Figure 2
NMU increases FDG-uptake in BAT and restores BAT morphology. (a) Sagittal view of micro-PET/CT image after cold stimulation and 18F-FDG injection. (b) Representative H&E staining of interscapular BAT. Scale bar, 50 μm. (c) Quantification of adipocytes of different diameters in interscapular BAT (n = 3). p < 0.05 (compared to the NCD + NS group). #p < 0.05 (compared to the HFD + NS group).
Figure 3
Figure 3
NMU stimulates the expression of thermogenic-related genes in BAT. (a) Quantification of Ucp1 stain of BAT (n = 3). (b) Gene expression profile in BAT (n = 5–6). p < 0.05 (compared to the NCD + NS group). #p < 0.05 (compared to the HFD + NS group).
Figure 4
Figure 4
NMU induces brown-like functional and morphological changes in WAT in DIO mice. (a) Coronal view of micro-PET/CT image after cold stimulation and 18F-FDG injection. (b) Representative H&E staining of sWAT. Scale bar, 100 μm. (c) Quantification of adipocytes of different diameters in sWAT (n = 3). p < 0.05 (compared to the NCD + NS group). #p < 0.05 (compared to the HFD + NS group).
Figure 5
Figure 5
NMU activates thermogenic-related gene profile in sWAT. (a) Representative of immunohistochemical images for Ucp1 (brown stain) of inguinal sWAT. Scale bar, 100 μm. (b) Quantification of Ucp1 stain of sWAT (n = 3). (c) Thermogenic-related gene expression profile in sWAT (n = 5–6). p < 0.05 (compared to the NCD + NS group). #p < 0.05 (compared to the HFD + NS group).
Figure 6
Figure 6
NMU increases ILC2 percentage in WAT in vivo. (a) Representative image of flow cytometry analysis showing the percentage of ILC2s in Lin-cells from mice SVF. (b) Quantification of the percentage of ILC2s in Lin- SVF cells from mice SVF (n = 3−4). p < 0.05 (compared to the NCD + NS group). #p < 0.05 (compared to the HFD + NS group).

References

    1. CDC. Maps of Diabetes and Obesity, by County. Atlanta, GA, USA: CDC; 2004, 2010, and 2016. https://www.cdc.gov/diabetes/data/center/slides.html.
    1. Cho N. H., Shaw J. E., Karuranga S., et al. IDF Diabetes Atlas: global estimates of diabetes prevalence for 2017 and projections for 2045. Diabetes Research and Clinical Practice. 2018;138:271–281. doi: 10.1016/j.diabres.2018.02.023. - DOI - PubMed
    1. WHO. Global Report on Diabetes. Geneva, Switzerland: WHO; 2016.
    1. Kahn C. R., Wang G., Lee K. Y. Altered adipose tissue and adipocyte function in the pathogenesis of metabolic syndrome. Journal of Clinical Investigation. 2019;129(10):3990–4000. doi: 10.1172/JCI129187. - DOI - PMC - PubMed
    1. Bragg F., Tang K., Guo Y., et al. Associations of general and central adiposity with incident diabetes in Chinese men and women. Diabetes Care. 2018;41(3):494–502. doi: 10.2337/dc17-1852. - DOI - PMC - PubMed