. 2020 Aug 19;7(1):veaa062.
doi: 10.1093/ve/veaa062. eCollection 2021 Jan.

Inference of Nipah virus evolution, 1999-2015

Affiliations

Inference of Nipah virus evolution, 1999-2015

Shannon L M Whitmer et al. Virus Evol. .

Abstract

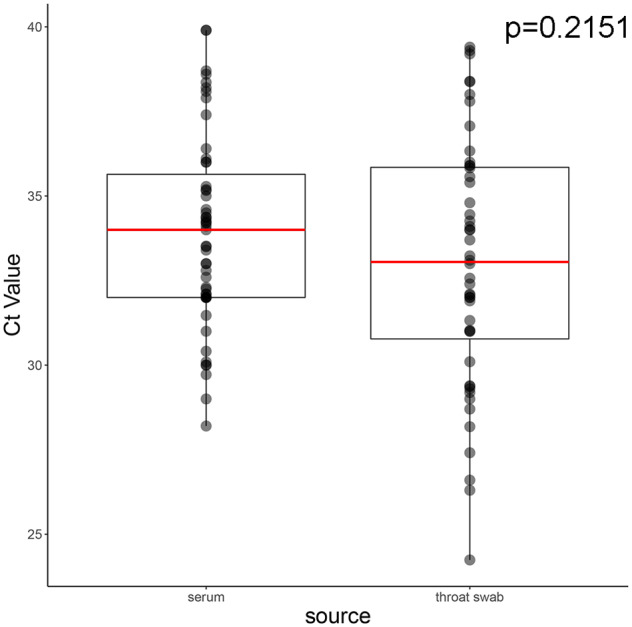
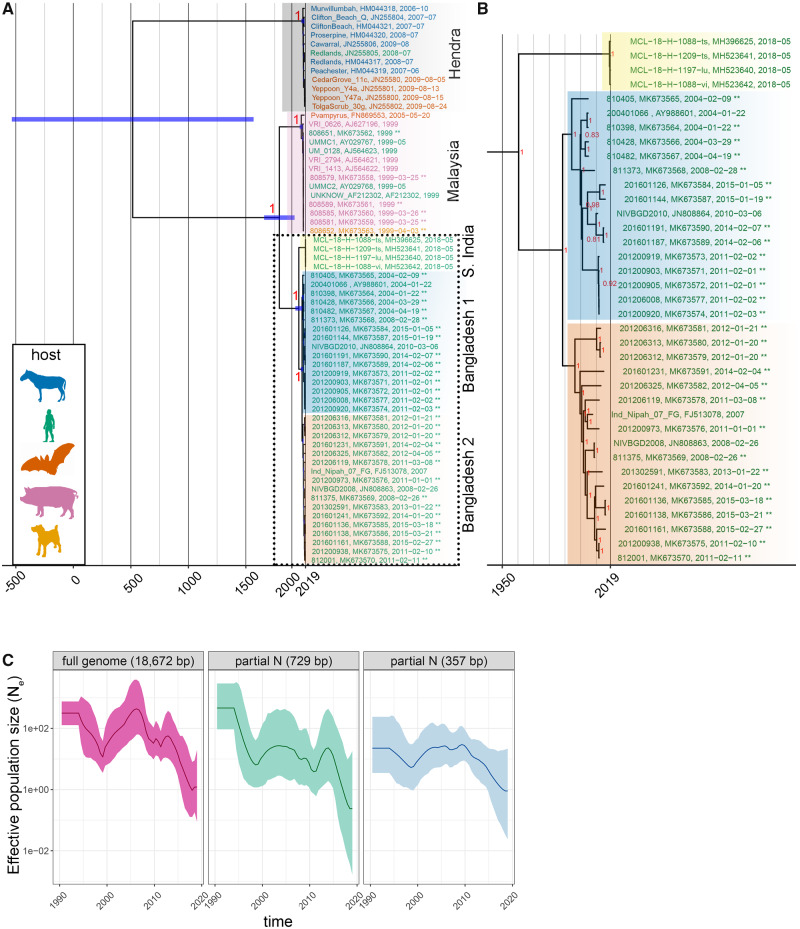
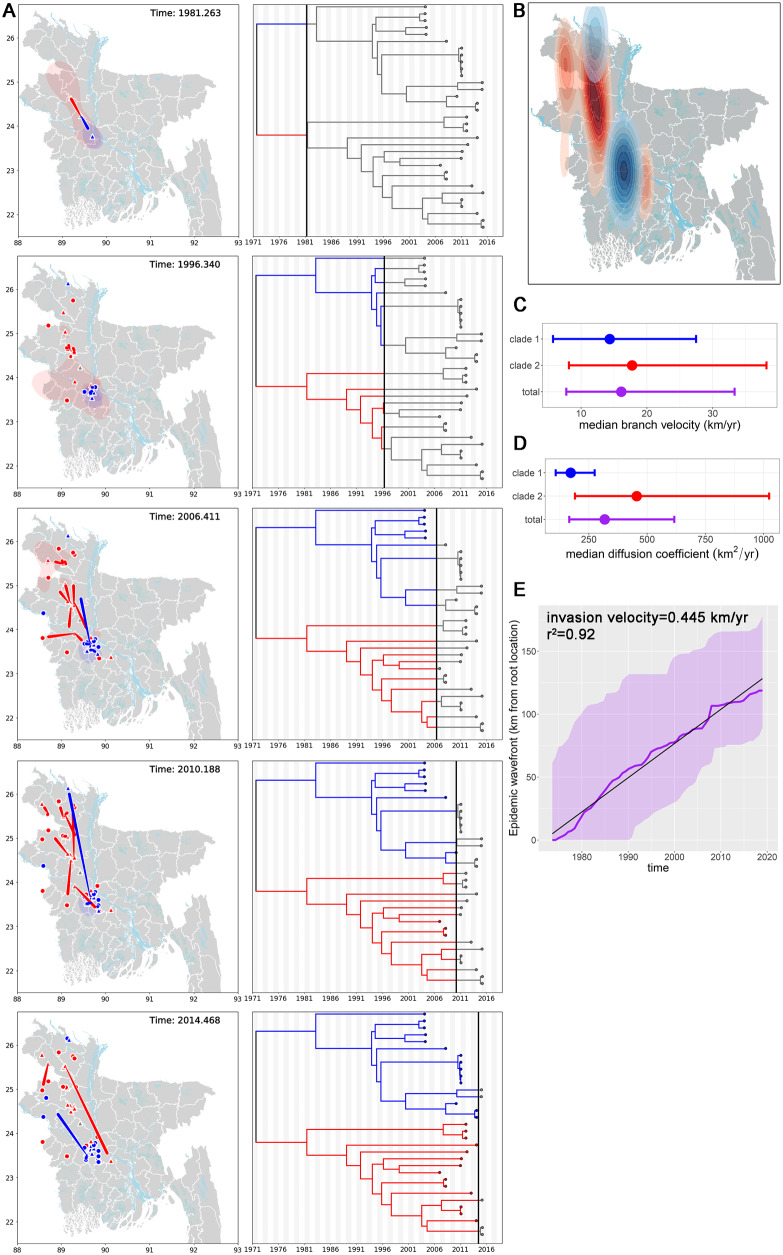
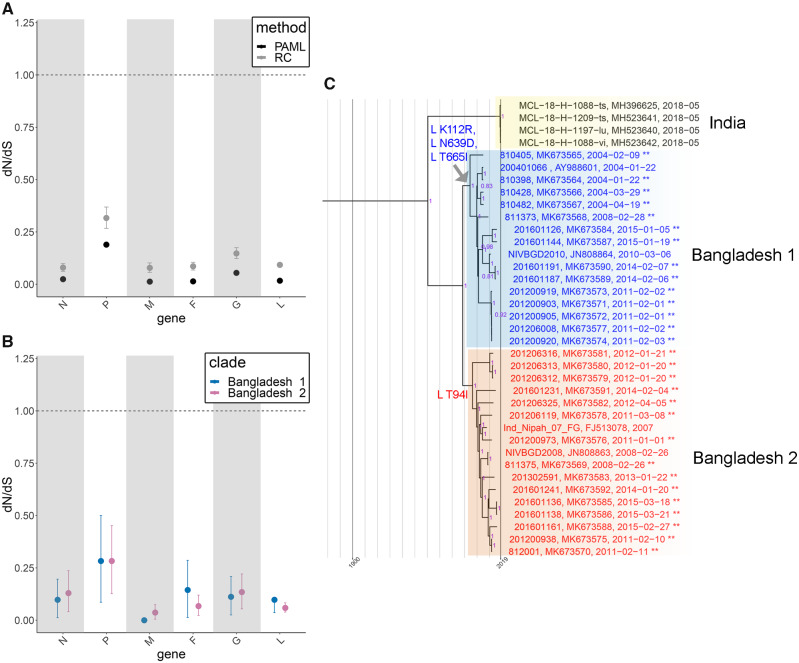
Despite near-annual human outbreaks of Nipah virus (NiV) disease in Bangladesh, typically due to individual spillover events from the local bat population, only twenty whole-genome NiV sequences exist from humans and ten from bats. NiV whole-genome sequences from annual outbreaks have been challenging to generate, primarily due to the low viral load in human throat swab and serum specimens. Here, we used targeted enrichment with custom NiV-specific probes and generated thirty-five additional unique full-length genomic sequences directly from human specimens and viral isolates. We inferred the temporal and geographic evolutionary history of NiV in Bangladesh and expanded a tool to visualize NiV spatio-temporal spread from a Bayesian continuous diffusion analysis. We observed that strains from Bangladesh segregated into two distinct clades that have intermingled geographically in Bangladesh over time and space. As these clades expanded geographically and temporally, we did not observe evidence for significant branch and site-specific selection, except for a single site in the Henipavirus L polymerase. However, the Bangladesh 1 and 2 clades are differentiated by mutations initially occurring in the polymerase, with additional mutations accumulating in the N, G, F, P, and L genes on external branches. Modeling the historic geographical and temporal spread demonstrates that while widespread, NiV does not exhibit significant genetic variation in Bangladesh. Thus, future public health measures should address whether NiV within in the bat population also exhibits comparable genetic variation, if zoonotic transmission results in a genetic bottleneck and if surveillance techniques are detecting only a subset of NiV.

Keywords: Nipah virus; phylogeography; selective pressure; virus evolution.


Figures

Figure 1.
Figure 1.
Ct value distribution from specimens collected during acute infection. Ct values were generated from serum and throat swab specimens collected at initial presentation to a clinic setting. Upper and lower hinges of box represent 25th and 75th quantiles and red line is sample median. Whiskers represent the upper and lower inter-quartile range * 1.5. Ct values were not significantly different between matrices (p = 0.2151, Wilcoxon rank sums test).
Figure 2.
Figure 2.
Inferred phylogenetic history of NiV and HeV—full genomes. (A) MCC tree summarized from three independent BEAST runs of 100 M states each. Posterior support is included at major nodes, and leaves are colored according to host. Background highlighting and labels indicate major nodes. Tree includes sixty-three total sequences including thirty-five new (indicated by ** at the end of sequence names) and twenty-eight publicly available sequences. The thirty-five new sequences were from thirteen viral isolates, twenty-two clinical specimens and represent thirty-four unique individuals. (B) NiV Bangladesh sequences separate into two clades. B is an expansion of clades outlined with dotted box in A. (C) Effective population size (Ne) mean (dark lines) and standard deviation (light shading) estimates vs. time from MCC trees generated with the skygrid demographic models using full-genome alignments, or alignments of partial N fragments (729 and 357 bp).
Figure 3.
Figure 3.
Geographic and temporal distribution of the Bangladesh 1 and 2 clades. (A) Geographic distribution of Bangladesh 1 and 2 clades over time. Locations of internal nodes (red, blue, or gray (root) triangles on map) and their 80 per cent HPD uncertainty estimates (blue or red transparent polygons) were estimated using BEAST/v1.10.2. Tiles represent selected frames of a movie iterating forward in time through the time-scaled phylogeny and Bangladesh map. Bangladesh clades 1 and 2 are blue and red, respectively. The MCC tree (n = 33 sequences) and node locations on the map are connected by moving red or blue curves. Round points on the map indicate external leaves and known geographic locations on the MCC tree. Alternating gray and white shading on the phylogenetic tree is time span in years. (B) Inhomogeneous spatial intensity of the Bangladesh 1 and 2 clades and internal node estimates. (C) Median branch velocity and 95 per cent HPD estimates from one hundred trees subsampled from the MCMC posterior distribution. (D) Median diffusion coefficients and 95 per cent HPD estimates from one hundred trees subsampled from the MCMC posterior distribution. (E) Maximal spatial wavefront distance from the estimated root location for all NiV sequences from the Bangladesh clade (purple line). Purple shading indicates 95 per cent HPD upper and lower estimates. Gradient of linear trendline (r2=0.92) is the invasion velocity (0.445 km/year).
Figure 4.
Figure 4.
Selection in the HeV/NiV species and NiV Bangladesh clade. (A) Comparison of selective pressures for all available full-length Henipaviruses under a single dN/dS model (model 0, PAML) and variable dN/dS model (renaissance counting). (B) Comparison of selective pressures between Bangladesh clades 1 and 2 using a variable dN/dS model (renaissance counting). (C) Mutations within the polymerase define the Bangladesh 1 and 2 clades. ML tree constructed using full-length sequences from the Bangladesh clades (n = 37 total sequences including twenty-nine new sequences indicated by ** at the end of sequence names). Bootstrap support greater than 70 per cent is annotated at all nodes (purple).
Movie 1.
Movie 1.
Bayesian continuous diffusion analysis of NiV expansion in Bangladesh. Locations of internal nodes (red, blue or gray (root) triangles on map) and their 80 per cent HPD uncertainty estimates (blue or red transparent polygons) were estimated using BEAST/v1.10.2. The frames of the movie iterate forward in time through the time-scaled phylogeny and Bangladesh map. Bangladesh clades 1 and 2 are blue and red, respectively. The MCC tree and node locations on the map are connected by moving red or blue curves. Large points on the map indicate external leaves and known geographic locations on the MCC tree. Alternating gray and white shading on the phylogenetic tree is time span in years.

References

    1. Anderson D. E. et al. (2019) ‘Isolation and Full-genome Characterization of Nipah Viruses from Bats, Bangladesh’, Emerging Infectious Diseases, 25: 166–70. - PMC - PubMed
    1. Arankalle V. A. et al. (2011) ‘Genomic Characterization of Nipah Virus, West Bengal, India’, Emerging Infectious Diseases, 17: 907–9. - PMC - PubMed
    1. Arunkumar G. et al. (2019) ‘Outbreak Investigation of Nipah Virus Disease in Kerala, India, 2018’, The Journal of Infectious Diseases, 219: 1867–78. - PubMed
    1. Auguste A. J. et al. (2010) ‘Yellow Fever Virus Maintenance in Trinidad and Its Dispersal throughout the Americas’, Journal of Virology, 84: 9967–77. - PMC - PubMed
    1. Brunker K. et al. (2018) ‘Landscape Attributes Governing Local Transmission of an Endemic Zoonosis: Rabies Virus in Domestic Dogs’, Molecular Ecology, 27: 773–88. - PMC - PubMed