. 2021 Mar 16;7(1):veab024.
doi: 10.1093/ve/veab024. eCollection 2021 Jan.

HIV-2 diversity displays two clades within group A with distinct geographical distribution and evolution

Affiliations

HIV-2 diversity displays two clades within group A with distinct geographical distribution and evolution

Benoit Visseaux et al. Virus Evol. .

Abstract

Genetic diversity of HIV-2 groups A and B has not yet been fully described, especially in a few Western Africa countries such as Ivory-Coast or Mali. We collected 444 pol, 152 vif, 129 env, and 74 LTR sequences from patients of the French ANRS CO5 HIV-2 cohort completed by 221 pol, 18 vif, 377 env, and 63 LTR unique sequences from public databases. We performed phylogenetic reconstructions and revealed two distinct lineages within HIV-2 group A, herein called A1 and A2, presenting non-negligible genetic distances and distinct geographic distributions as A1 is related to coastal Western African countries and A2 to inland Western countries. Estimated early diversification times for groups A and B in human populations were 1940 [95% higher probability densitiy: 1935-53] and 1961 [1952-70]. A1 experienced an early diversification in 1942 [1937-58] with two distinct early epidemics in Guinea-Bissau or Senegal, raising the possibility of group A emergence in those countries from an initial introduction from Ivory-Coast to Senegal, two former French colonies. Changes in effective population sizes over time revealed that A1 exponentially grew concomitantly to Guinea-Bissau independence war, but both A2 and B lineages experienced a latter growth, starting during the 80s economic crisis. This large HIV-2 genetic analysis provides the existence of two distinct subtypes within group A and new data about HIV-2 early spreading patterns and recent epidemiologic evolution for which data are scarce outside Guinea-Bissau.

Keywords: HIV-2; molecular epidemiology; phylogenetic; viral diversity.


Figures

Figure 1.
Figure 1.
Unrooted phylogenetic trees obtained by approximate maximum likelihood available based on four genomic regions: LTR, pol, vif and env. SIV sequences are indicated in purple and non-A non-B HIV-2 sequences are indicated in yellow. Branch lengths represent the number of nucleotide substitutions per sites, as indicated on the scale. Branch support values are indicated in grey for the A1 and A2 most recent common ancestor corresponding nodes.
Figure 2.
Figure 2.
Unrooted approximate maximum likelihood phylogenetic tree of 68 HIV-2 near-full genome sequences. SIV sequences (in purple) and non-A non-B HIV-2 sequences (in yellow) were included as outgroup. Branch lengths represent the number of nucleotide substitutions per sites, as indicated on the scale. Branch support values are indicated in grey for the A1 and A2 most recent common ancestor corresponding nodes.
Figure 3.
Figure 3.
Geographical distribution of HIV-2 clades observed in Western Africa, the epicentre of the HIV-2 epidemic, using the country of origin of all patients included in the French ANRS CO5 HIV-2 cohort and the country of sampling for publicly available sequences obtained in this area. The number of patients per country is given in each corresponding circle. Proportion of HIV-2 A1, A2, and B lineages is indicated by the blue, green, and red colours within each circle, respectively.
Figure 4.
Figure 4.
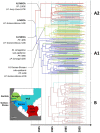
Bayesian MCC tree obtained for HIV-2 groups A and B using pol sequences. These trees are time-scaled, with branch lengths expressed as calendar years, and the colour of each branches depict the most probable location of the corresponding ancestor. The colour code for Western Africa is depicted on the map: dark blue is for Guinea-Bissau, blue for Guinea, Green for Senegal, dark green for Gambia, red is for Ivory Coast and turquoise for Mali. France is coloured in orange, all the other countries are coloured in grey. For the nodes of the main most recent common ancestors (MRCA), the posterior probability (PP) and the most probable location with its location state probability (LP) are given.
Figure 5.
Figure 5.
Changes in effective population size over time for the three main HIV-2 lineages. A1 is depicted in blue, A2 in green and B in red.

References

    1. Ayouba A.et al. (2013) ‘Evidence for Continuing Cross-Species Transmission of SIVsmm to Humans: Characterization of a New HIV-2 Lineage in Rural Côte D’Ivoire’, Aids (London, England), 27: 2488–91. - PMC - PubMed
    1. Baele G.et al. (2012) ‘Improving the Accuracy of Demographic and Molecular Clock Model Comparison While Accommodating Phylogenetic Uncertainty’, Molecular Biology and Evolution, 29: 2157–67. - PMC - PubMed
    1. Baele G.et al. (2013) ‘Accurate Model Selection of Relaxed Molecular Clocks in Bayesian Phylogenetics’, Molecular Biology and Evolution, 30: 239–43. - PMC - PubMed
    1. Breuer J.et al. (1995) ‘Human Immunodeficiency Virus Type 2 (HIV-2) Env Gene Analysis: Prediction of Glycoprotein Epitopes Important for Heterotypic Neutralization and Evidence for Three Genotype Clusters within the HIV-2a Subtype’, Journal of General Virology, 76: 333–45. - PubMed
    1. Chen Z.et al. (1997) ‘Human Immunodeficiency Virus Type 2 (HIV-2) Seroprevalence and Characterization of a Distinct HIV-2 Genetic Subtype from the Natural Range of Simian Immunodeficiency Virus-Infected Sooty Mangabeys’, Journal of Virology, 71: 3953–60. - PMC - PubMed