. 2021 Aug 23:10:e69896.
doi: 10.7554/eLife.69896.

Systematic morphological and morphometric analysis of identified olfactory receptor neurons in Drosophila melanogaster

Affiliations

Systematic morphological and morphometric analysis of identified olfactory receptor neurons in Drosophila melanogaster

Cesar Nava Gonzales et al. Elife. .

Abstract

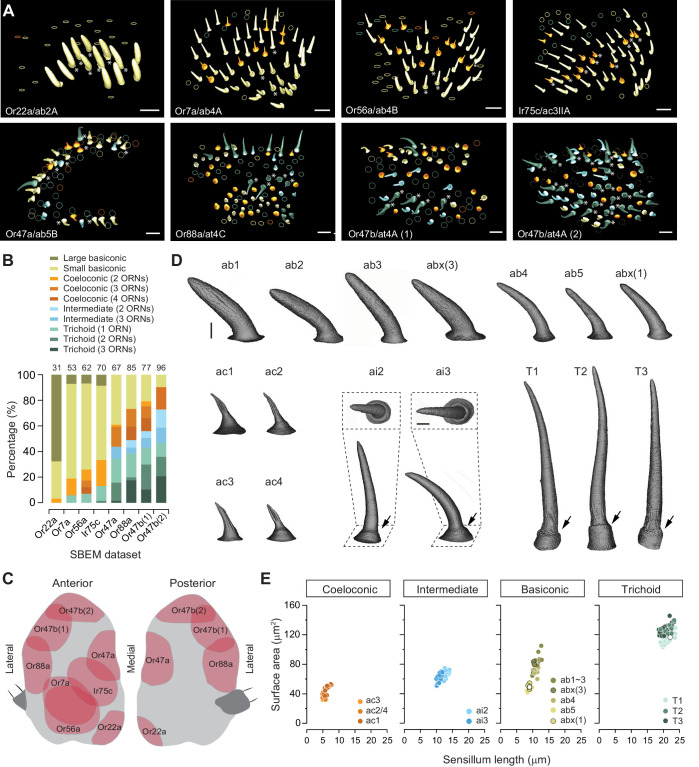
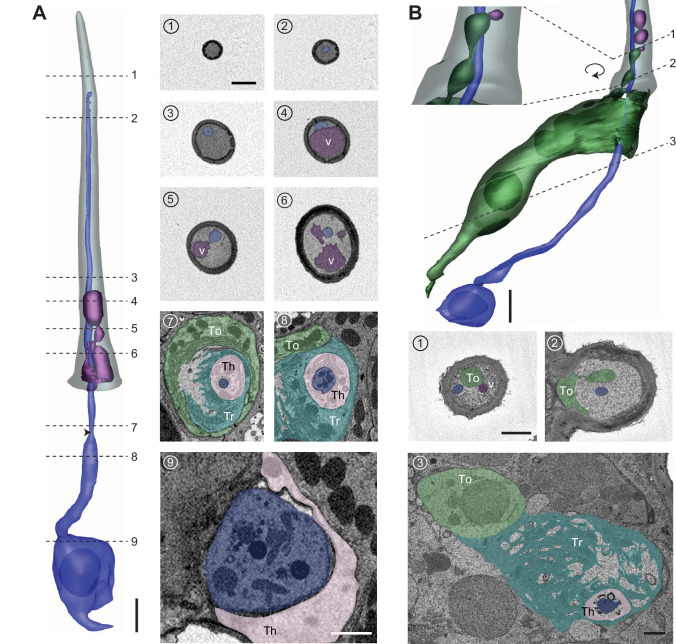
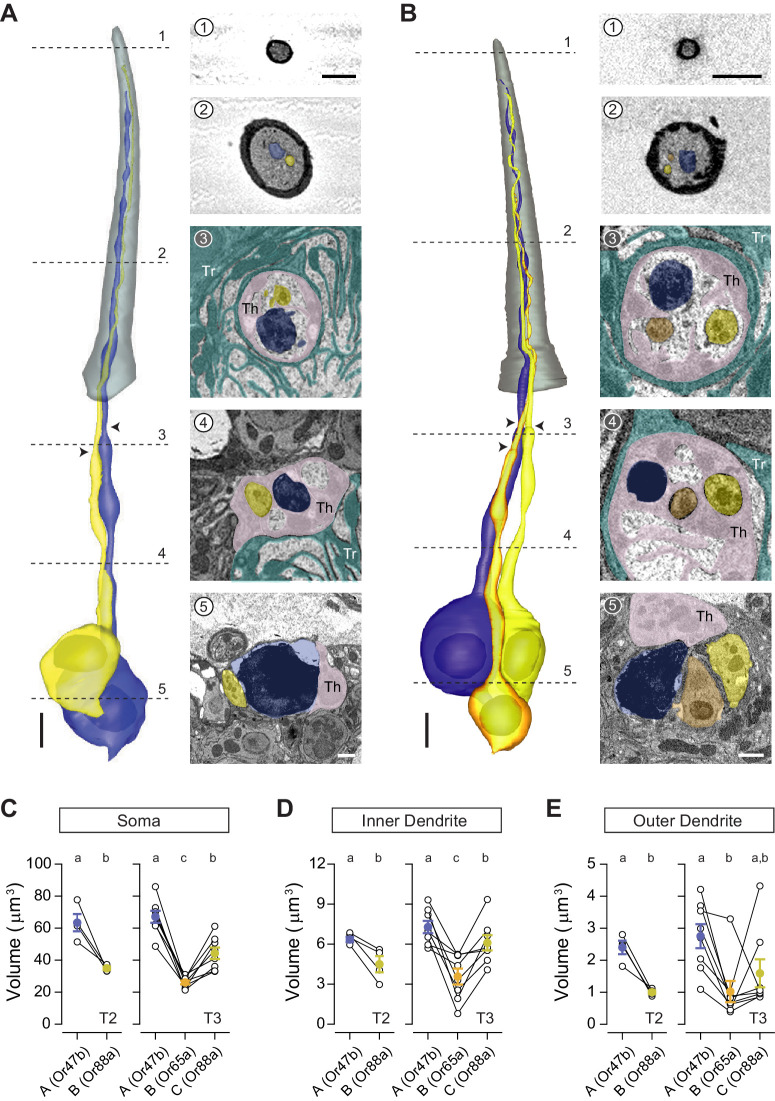
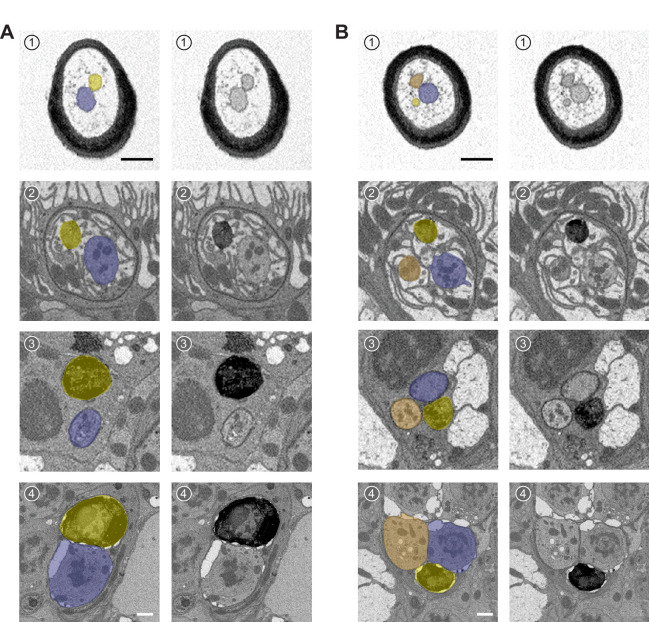
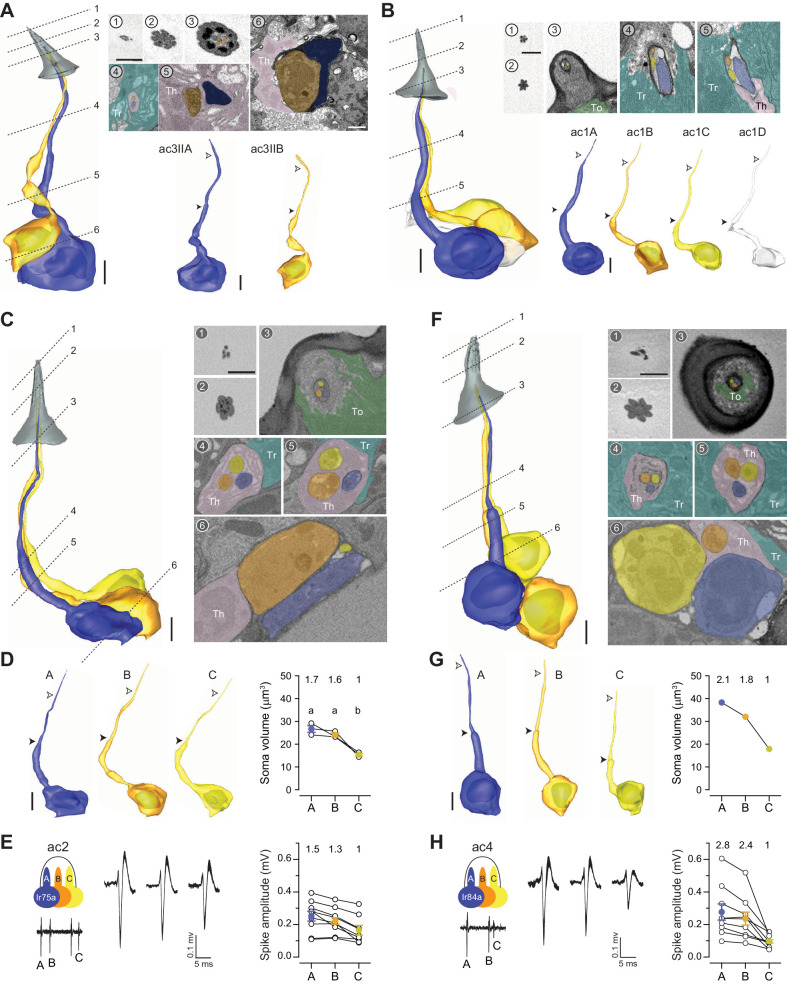
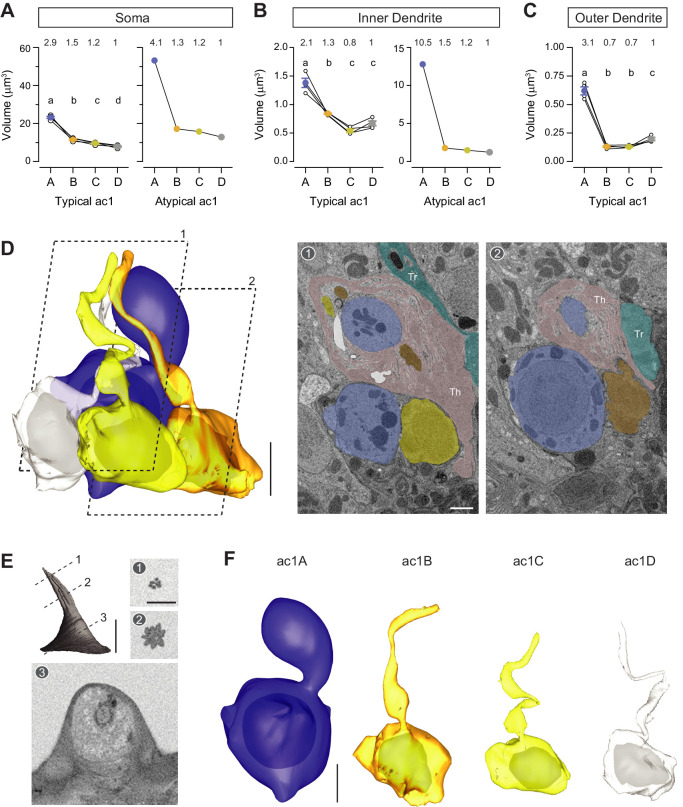
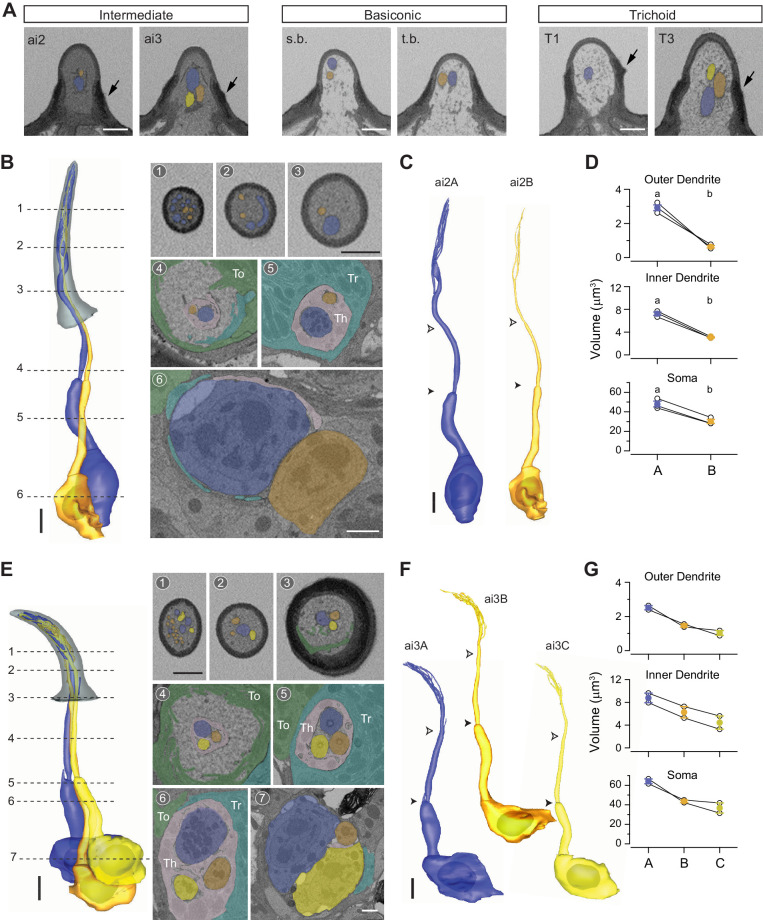
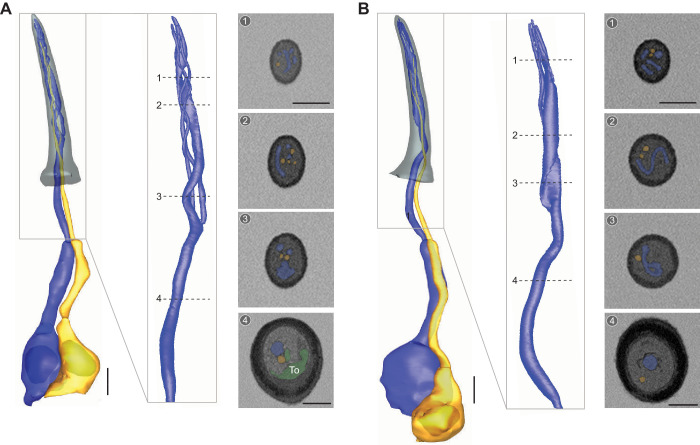
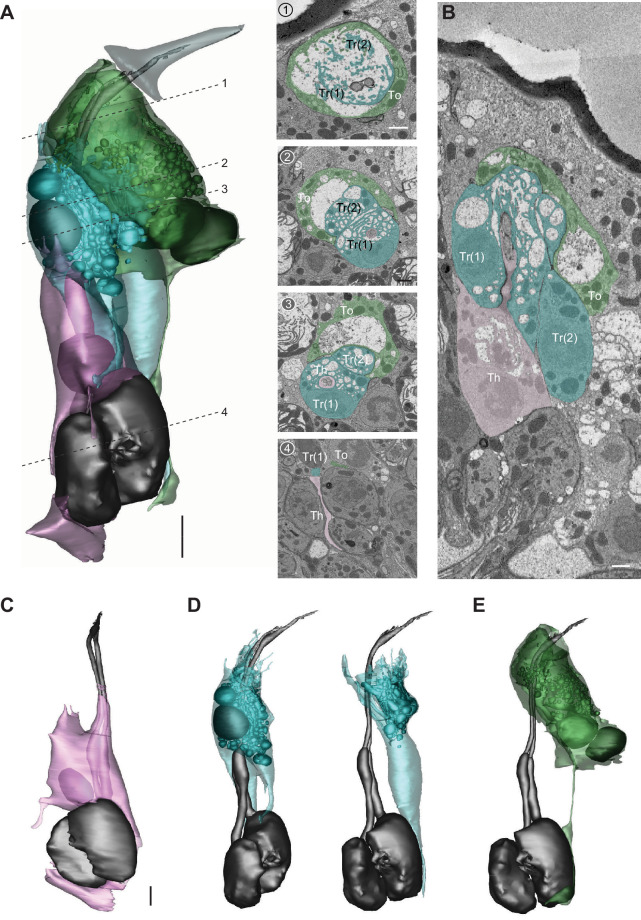
The biophysical properties of sensory neurons are influenced by their morphometric and morphological features, whose precise measurements require high-quality volume electron microscopy (EM). However, systematic surveys of nanoscale characteristics for identified neurons are scarce. Here, we characterize the morphology of Drosophila olfactory receptor neurons (ORNs) across the majority of genetically identified sensory hairs. By analyzing serial block-face electron microscopy images of cryofixed antennal tissues, we compile an extensive morphometric data set based on 122 reconstructed 3D models for 33 of the 40 identified antennal ORN types. Additionally, we observe multiple novel features-including extracellular vacuoles within sensillum lumen, intricate dendritic branching, mitochondria enrichment in select ORNs, novel sensillum types, and empty sensilla containing no neurons-which raise new questions pertinent to cell biology and sensory neurobiology. Our systematic survey is critical for future investigations into how the size and shape of sensory neurons influence their responses, sensitivity, and circuit function.

Keywords: 3D nanoscale model; D. melanogaster; antenna; morphometrics; neuroscience; olfactory receptor neuron; olfactory sensillum; serial block-face electron microscopy.


Conflict of interest statement

CN, QM, EB, KC, RN, MM, ME, CS No competing interests declared

Figures

Figure 1.
Figure 1.. Different sensillum classes and their distribution across SBEM data sets.
(A) SBEM data sets analyzed in this study, named according to the genetically labeled ORNs (lower left corner, the receptor, and ORN identity are indicated). The 3D models of the cuticles are shown for basiconic (yellow), coeloconic (orange), intermediate (light blue), and trichoid sensilla (teal). Asterisks indicate the sensilla containing genetically labeled ORNs. Circles indicate partially sampled sensilla. The data sets are arranged approximately along the proximal-medial to distal-lateral axis on the anterior face of an antenna. Scale bars: 10 μm. (B) Percentage of different sensillum classes in individual data sets. The total numbers of sampled sensilla are indicated above the graph. (C) Illustration of antennal regions covered by individual SBEM data sets. (D) Isosurface images of identified sensillum types. Large basiconic: ab1, ab2, ab3, and abx(3); thin basiconic: ab4; and small basiconic: ab5 and abx(1). Coeloconic: ac1, ac2, ac3, and ac4. Intermediate: ai2 and ai3; insets: top-down perspective. Trichoid: T1, T2, and T3. Arrows indicate the basal drum. Scale bars: 2 μm. (E) Different sensillum classes exhibit distinctive morphometric features. The surface area for completely segmented sensillum cuticle is plotted as a function of sensillum length. Empty circles indicate the sensilla which do not house any ORNs. ORN, olfactory receptor neuron; SBEM, serial block-face scanning electron microscopy.
Figure 2.
Figure 2.. T1 trichoid sensillum.
(A) 3D model and SBEM images of a representative T1 sensillum. ORN (pseudocolored in blue), vacuoles (aubergine), and sensillum cuticle (gray) are shown. Dashed lines indicate positions of the corresponding SBEM images on the right: (1) luminal space devoid of ORN dendrite; (2–3) outer dendrite; (4–6) outer dendrite and vacuole structures; (7) ciliary constriction (arrow head), which demarcates the inner and outer dendritic segments; (8) inner dendrite; and (9) ORN soma. Three types of auxiliary cells were observed beneath the antennal surface: thecogen (Th), trichogen (Tr), and tormogen (To). (B) A partial 3D model and SBEM images of another T1 sensillum. ORN (blue), vacuoles (aubergine), and tormogen cell (green) are shown. Inset: magnified and rotated view, highlighting the bulbous protrusion from the tormogen cell. Dashed lines indicate positions of the corresponding SBEM images below: (1) vacuole in close proximity to the tormogen protrusion; (2) tormogen cell and its protrusion; and (3) tormogen soma, trichogen, and thecogen processes, and ORN dendrite. Scale bars: 2 μm for 3D models and 1 μm for SBEM images. The scale bar in the first image panel also pertains to other images unless indicated otherwise. ORN, olfactory receptor neuron; SBEM, serial block-face scanning electron microscopy.
Figure 2—figure supplement 1.
Figure 2—figure supplement 1.. Diverse T1 dendritic morphologies.
3D models and sample SBEM images of different T1 sensilla. The T1 neurons display diverse dendritic morphologies: outer dendrite with a flattened distal segment (A), with three branches (B), or with six branches (C). ORN (blue) and sensillum cuticle (gray) are shown. Dashed lines indicate positions of the corresponding SBEM images on the right. Scale bars: 2 μm for 3D models and 1 μm for SBEM images. ORN, olfactory receptor neuron; SBEM, serial block-face scanning electron microscopy.
Figure 3.
Figure 3.. T2 and T3 trichoid sensilla.
3D models and SBEM images of a representative T2 (A) or T3 sensillum (B). Images were acquired from transgenic flies in which Or47b ORNs were engineered to express APEX2 (Or47b-GAL4>10XUAS-myc-APEX2-Orco) and labeled with diaminobenzidine (DAB, darker staining). (A) T2 houses two ORNs: the larger neuron is DAB-labeled and pseudocolored in blue, whereas the unlabeled, smaller neighbor is pseudocolored in yellow. (B) T3 houses three ORNs of different sizes: large (DAB-labeled and pseudocolored in blue), medium (yellow), and small (orange). Dashed lines indicate positions of the corresponding SBEM images on the right. Arrow heads indicate ciliary constrictions. Th: thecogen; Tr: trichogen; and To: tormogen. Scale bars: 2 μm for 3D models and 1 μm for SBEM images. The scale bar in the first image panel also pertains to other images unless indicated otherwise. (C–E) Volumes of the soma (C), inner (D), and outer dendrites (E) of T2 or T3 ORNs. Lines connect data points from neurons housed in the same sensillum, mean± s.e.m. n=4 for T2, and n=8 for T3. Significant differences (p<0.05) are indicated by different letters; paired t-test for comparison between neighboring neurons, and unpaired t-test for comparison between non-grouped neurons. ORN, olfactory receptor neuron; SBEM, serial block-face scanning electron microscopy.
Figure 3—figure supplement 1.
Figure 3—figure supplement 1.. Or88a ORN is identified in both T2 and T3 sensilla.
SBEM images of a representative T2 (A) or T3 sensillum (B). Or88a ORNs were engineered to express APEX2 (Or88a-GAL4>10XUAS-myc-APEX2-Orco) and labeled with DAB (darker staining). Left and right columns represent the same SBEM images, with the left pseudocolored to indicate ORN identities. (A) T2 houses two ORNs: large (blue) and small (DAB-labeled, yellow). (B) T3 houses three ORNs: large (blue), medium (DAB-labeled, yellow), and small (orange). ORN size was determined through morphometric measurement. (1) Distal outer dendrite; (2) proximal outer dendrite beneath the antennal surface; (3) inner dendrite; and (4) ORN soma. Scale bars: 1 μm. The scale bar in the first image panel also pertains to other images unless indicated otherwise. DAB, diaminobenzidine; ORN, olfactory receptor neuron; SBEM, serial block-face scanning electron microscopy.
Figure 3—figure supplement 2.
Figure 3—figure supplement 2.. Diverse dendritic morphologies of Or47b and Or88a ORNs.
3D models and sample SBEM images of different Or47b or Or88a ORNs. Filled arrow heads: ciliary constriction; empty arrow heads: sensillum base position. Inset: magnified and rotated view. Dashed lines indicate positions of the corresponding SBEM images on the right. (A, B) Or88a ORN with a flattened dendritic shaft (A) or with a ribbon-like distal dendritic segment (B). (C, D) Or47b ORN with a short (C) or long segment (D) of hollowed dendrite. Dashed lines indicate positions of the corresponding SBEM images on the right. Or47b and Or88a ORNs are pseudocolored in blue and yellow, respectively. The sensillum in (A) also contains vacuoles (aubergine). The ORNs shown in (A, C) are from T2 sensilla, in (B, D) are from T3 sensilla. Scale bars: 2 μm for 3D models and 1 μm for SBEM images. The scale bar in the first image panel also pertains to other images from the same sensillum. ORN, olfactory receptor neuron; SBEM, serial block-face scanning electron microscopy.
Figure 4.
Figure 4.. Coeloconic sensilla.
(A) 3D model and SBEM images of a representative ac3 sensillum. The ac3A ORNs were engineered to express APEX2 (Ir75c-GAL4>10XUAS-myc-APEX2-Orco) and labeled with DAB (darker staining). ORNs are pseudocolored to indicate neuronal identity: ac3A (blue) and ac3B (orange). Dashed lines indicate positions of the corresponding SBEM images. Filled arrow heads: ciliary constriction; empty arrow heads: sensillum base position. Th: thecogen; Tr: trichogen; and To: tormogen. (B) A representative ac1 sensillum. The four ORNs are pseudocolored based on their relative soma size in descending order: blue, orange, yellow, and white. (C) A representative ac2 sensillum. The three ORNs are pseudocolored based on their relative soma size in descending order: blue, orange, and yellow. (D) 3D models for individual ac2 neurons as shown in (C) and their respective soma volumes. Lines connect data points from neurons housed in the same sensillum, mean± s.e.m. n=3. The soma volume ratio is indicated above the graph. Significant differences (p<0.05) are indicated by different letters; paired t-test for comparison between neighboring neurons. (E) Extracellular spike amplitudes of grouped ac2 ORNs. Left: Average spike waveforms are shown for individual neurons. Line width indicates s.e.m. Right: Spike amplitude comparison. Each data point represents the average spike amplitude of an ORN based on its spontaneous activity. Lines connect data points from neighboring neurons. Colored dots denote average spike amplitudes, mean± s.e.m. n=9. Spike amplitude ratio is indicated above the graph. (F–H) As in (C–E), except that images are shown for an ac4 sensillum. Scale bars: 2 μm for 3D models and 1 μm for SBEM images. The scale bar in the first image panel also pertains to other images unless indicated otherwise. DAB, diaminobenzidine; ORN, olfactory receptor neuron; SBEM, serial block-face scanning electron microscopy.
Figure 4—figure supplement 1.
Figure 4—figure supplement 1.. Atypical ac1 sensillum.
(A–C) Volumes of the soma (A), inner (B), and outer dendrites (C) of ORNs compartmentalized in the typical or atypical ac1 sensilla. Lines connect data points from individual neurons housed in the same sensillum, mean± s.e.m. n=4 for typical ac1, and n=1 for the atypical sensillum. The volume ratios are indicated above the graphs. Significant differences (p<0.05) are indicated by different letters; paired t-test for comparison between neighboring neurons. (D) A partial 3D model and sample SBEM images of an atypical ac1 sensillum. The outer dendritic segments cannot be unambiguously segmented and are thus not shown. (E) Isosurface and SBEM images of the atypical ac1 sensillum. Dashed lines indicate positions of the corresponding SBEM images. (F) Partial 3D models for individual neurons housed in the atypical ac1 as shown in (D). Scale bars: 2 μm for 3D models and 1 μm for SBEM images. The scale bar in the first image panel also pertains to other images unless indicated otherwise. ORN, olfactory receptor neuron; SBEM, serial block-face scanning electron microscopy.
Figure 5.
Figure 5.. Intermediate sensilla.
(A) SBEM images of representative intermediate, basiconic, and trichoid sensilla sampled from the same data set. Intermediate sensilla display higher luminal density than the other two sensillum types. Arrows: basal drum; s.b. small basiconic; and t.b. thin basiconic. (B) 3D model and SBEM images of a representative ai2 sensillum. ORNs are pseudocolored to indicate neuronal identity: ai2A (blue) and ai2B (orange). Dashed lines indicate positions of the corresponding SBEM images. Th: thecogen; Tr: trichogen; and To: tormogen. (C) 3D models for individual ai2 neurons as shown in (B). Filled arrow heads: ciliary constriction; empty arrow heads: sensillum base position. (D) Volumes of the soma, inner, and outer dendrites of compartmentalized ai2 neurons. Lines connect data points from neurons housed in the same sensillum, mean± s.e.m. n=3. Significant differences (p<0.05) are indicated by different letters; paired t-test for comparison between neighboring neurons. (E–G) As in (B–D), except that images are shown for a representative ai3 sensillum. ORNs are pseudocolored to indicate neuronal identity: ai3A (blue), ai3B (orange), and ai3C (yellow). n=2. Scale bars: 2 μm for 3D models and 1 μm for SBEM images. The scale bar in the first image panel also pertains to other images unless indicated otherwise. ORN, olfactory receptor neuron; SBEM, serial block-face scanning electron microscopy.
Figure 5—figure supplement 1.
Figure 5—figure supplement 1.. Diverse dendritic morphologies of ai2A ORNs.
3D models and sample SBEM images of different ai2A ORNs. Inset: magnified view. ORNs are pseudocolored to indicate neuronal identity: ai2A (blue) and ai2B (orange). Tormogen processes (To) are pseudocolored in green. Dashed lines indicate positions of the corresponding SBEM images on the right. (A, B) An ai2A ORN with a flattened dendritic branch, among cylindrical counterparts (A) or with a ribbon-like, unbranched outer dendritic segment that spirals upwards (B). Scale bars: 2 μm for 3D models and 1 μm for SBEM images. The scale bar in the first image panel also pertains to other images unless indicated otherwise. ORN, olfactory receptor neuron; SBEM, serial block-face scanning electron microscopy.
Figure 6.
Figure 6.. ab1 and ab2 large basiconic sensilla.
(A) A partial 3D model and sample SBEM images of a representative ab1 sensillum. ORNs are pseudocolored to indicate neuronal identity: ab1A (blue), ab1B (orange), ab1C (yellow), and ab1D (white). Dashed planes indicate positions of the corresponding SBEM images. Among the auxiliary cells, only thecogen is indicated (Th) because the identity for trichogen or tormogen cannot be unambiguously determined. (B) 3D models for individual ab1 neurons as shown in (A). Filled arrow heads: ciliary constriction. Arrow: membranous protrusion. (C) Volumes of the soma, inner, and outer dendrites of compartmentalized ab1 neurons. (D) The number and total volume of mitochondria in the inner dendritic segments of ab1 neurons. Lines connect data points from neurons housed in the same sensillum, mean± s.e.m. n=2. The volume or number ratio is indicated above each graph. (E, F) As in (A, B), except that a complete 3D model of an ab2 sensillum is shown. Filled arrow heads: ciliary constriction; empty arrow heads: sensillum base position. Inset: magnified and rotated view, highlighting the inner dendritic membranous protrusions. (G) Morphometric comparison of ab2A and ab2B neurons. The volume or number ratio is indicated above each graph. Scale bars: 2 μm for 3D models and 1 μm for SBEM images. The scale bar in the first image panel also pertains to other images unless indicated otherwise. ORN, olfactory receptor neuron; SBEM, serial block-face scanning electron microscopy.
Figure 7.
Figure 7.. ab3 and abx(3) large basiconic sensilla.
(A) 3D model and sample SBEM images of an ab3 sensillum. ORNs are pseudocolored to indicate neuronal identity: ab3A (blue) and ab3B (orange). Dashed lines indicate positions of the corresponding SBEM images. Th: thecogen; Tr: trichogen; and To: tormogen. (B) 3D models for individual ab3 neurons as shown in (A). Filled arrow head: ciliary constriction; empty arrow head: sensillum base position. Arrow: membranous protrusions. (C) Volumes of the soma and inner dendrites of grouped ab3 neurons. Lines connect data points from individual neurons housed in the same sensillum, mean± s.e.m. n=5. The volume ratio is indicated above each graph. Significant differences (p<0.05) are indicated by different letters; paired t-test for comparison between neighboring neurons. (D, E) Partial 3D models and sample SBEM images of different abx(3) sensilla. ORNs are pseudocolored to indicate neuronal identity: abx(3)A (blue), abx(3)B (orange), and abx(3)C (yellow). Dashed planes or lines indicate positions of the corresponding SBEM images. (D) Partial soma and inner dendritic models, and (E) partial outer dendritic models. The identity for some dendritic branches cannot be unambiguously determined and are thus not pseudocolored. (F) Isosurface images of ab3 and abx(3) sensilla. (G) Volumes of the soma and inner dendrites of grouped abx(3) neurons. Lines connect data points from neurons housed in the same sensillum, mean± s.e.m. n=2. The volume ratio is indicated above each graph. Scale bars: 2 μm for 3D models and 1 μm for SBEM images. The scale bar in the first image panel also pertains to other images from the same sensillum unless indicated otherwise. ORN, olfactory receptor neuron; SBEM, serial block-face scanning electron microscopy.
Figure 8.
Figure 8.. ab4 thin basiconic sensillum and ab5 small basiconic sensillum.
(A) 3D model and sample SBEM images of a representative ab4 sensillum. The ab4A ORNs were engineered to express APEX2 (Or7a-GAL4>10XUAS-myc-APEX2-Orco) and labeled with DAB (darker staining). ORNs are pseudocolored to indicate neuronal identity: ab4A (blue) and ab4B (orange). Dashed lines indicate positions of the corresponding SBEM images on the right. (B) 3D models for individual ab4 neurons as shown in (A). Filled arrow heads: ciliary constriction; empty arrow heads: sensillum base position. (C) 2D projections of ab4A or ab4B outer dendritic branches. (D) Morphometric comparison of ab4A and ab4B neurons. Lines connect data points from neurons housed in the same sensillum, mean± s.e.m. n=3. The volume ratio is indicated above each graph. (E–H) As in (A–D), except that ab5 is featured. The ab5B ORNs were engineered to express APEX2 (Or47a-GAL4>10XUAS-myc-APEX2-Orco) and labeled with DAB (darker staining). Four pairs of ab5 neurons were analyzed for morphometrics. Significant differences (p<0.05) are indicated by different letters; paired t-test for comparison between neighboring neurons. Th: thecogen; Tr: trichogen; and To: tormogen. Scale bars: 2 μm for 3D models and 1 μm for SBEM images. The scale bar in the first image panel also pertains to other images unless indicated otherwise. DAB, diaminobenzidine; ORN, olfactory receptor neuron; SBEM, serial block-face scanning electron microscopy.
Figure 8—figure supplement 1.
Figure 8—figure supplement 1.. Novel small basiconic sensillum with one ORN.
(A) Isosurface images of ab4, abx(1), and ab5 sensilla. (B) 3D model and sample SBEM images of a representative abx(1) sensillum. The ORN is pseudocolored in blue. Dashed lines indicate positions of the corresponding SBEM images. Th: thecogen; Tr: trichogen; and To: tormogen. Scale bars: 2 μm for 3D models and 1 μm for SBEM images. The scale bar in the first image panel also pertains to other images unless indicated otherwise. ORN, olfactory receptor neuron; SBEM, serial block-face scanning electron microscopy.
Figure 9.
Figure 9.. Empty sensillum.
Isosurface and SBEM images of an empty T1 (A) or an empty small basiconic sensillum (B). Dashed lines indicate positions of the corresponding SBEM images. (C) SBEM images showing the three auxiliary cells associated with the empty small basiconic as shown in (B) or with a neighboring small basiconic containing two neurons. ORNs are pseudocolored in blue (A neuron) or orange (B neuron). The left image is closer to the antennal surface than the right image. Th: thecogen; Tr: trichogen; and To: tormogen. Scale bars: 2 μm for isosurface models and 1 μm for SBEM images. The scale bar in the first image panel also pertains to other images unless indicated otherwise. ORN, olfactory receptor neuron; SBEM, serial block-face scanning electron microscopy.
Figure 10.
Figure 10.. The three auxiliary cells for a basiconic sensillum.
(A) 3D model and SBEM images of a representative ab4 sensillum, highlighting its three auxiliary cells. Images were taken from the Or7a-labeled data set. Cells are pseudocolored to indicate identities: ORNs (gray), thecogen cell (pink), trichogen cell (turquoise), and tormogen cell (green). Dashed lines indicate positions of the corresponding SBEM images. (B) IMOD software-rendered SBEM image of a longitudinal sensillum section. Th: thecogen; Tr: trichogen; To: tormogen; and SC: sensillum lymph cavity. (C–E) 3D models of individual auxiliary cells as shown in (A): thecogen (C), trichogen (D), and tormogen (E). Scale bars: 2 μm for 3D models and 1 μm for SBEM images. The scale bar in the first image panel also pertains to other images unless indicated otherwise. ORN, olfactory receptor neuron; SBEM, serial block-face scanning electron microscopy.
Figure 11.
Figure 11.. The four auxiliary cells for a coeloconic sensillum.
(A) 3D model and SBEM images of a representative ac3 sensillum, highlighting its four auxiliary cells. Cells are pseudocolored to indicate identities: ORNs (gray), thecogen cell (pink), trichogen cell (turquoise), and tormogen cell (green). Dashed lines indicate positions of the corresponding SBEM images. (B) IMOD software-rendered SBEM image of a longitudinal sensillum section. Th: thecogen; Tr: trichogen; and To: tormogen. (C–E) 3D models of individual auxiliary cells as shown in (A): thecogen cell (C), trichogen cells, Tr(1) and Tr(2) (D), and tormogen cell (E). Scale bars: 2 μm for 3D models and 1 μm for SBEM images. The scale bar in the first image panel also pertains to other images unless indicated otherwise. ORN, olfactory receptor neuron; SBEM, serial block-face scanning electron microscopy.

Similar articles

Cited by

References

    1. Benton R, Vannice KS, Gomez-Diaz C, Vosshall LB. Variant ionotropic glutamate receptors as chemosensory receptors in Drosophila. Cell. 2009;136:149–162. doi: 10.1016/j.cell.2008.12.001. - DOI - PMC - PubMed
    1. Couto A, Alenius M, Dickson BJ. Molecular, anatomical, and functional organization of the Drosophila olfactory system. Current Biology. 2005;15:1535–1547. doi: 10.1016/j.cub.2005.07.034. - DOI - PubMed
    1. de Bruyne M, Foster K, Carlson JR. Odor coding in the Drosophila antenna. Neuron. 2001;30:537–552. doi: 10.1016/S0896-6273(01)00289-6. - DOI - PubMed
    1. Dobritsa AA, van der Goes van Naters W, Warr CG, Steinbrecht RA, Carlson JR. Integrating the molecular and cellular basis of odor coding in the Drosophila antenna. Neuron. 2003;37:827–841. doi: 10.1016/S0896-6273(03)00094-1. - DOI - PubMed
    1. Dweck HK, Ebrahim SA, Kromann S, Bown D, Hillbur Y, Sachse S, Hansson BS, Stensmyr MC. Olfactory preference for egg laying on Citrus substrates in Drosophila. Current Biology. 2013;23:2472–2480. doi: 10.1016/j.cub.2013.10.047. - DOI - PubMed

Publication types

LinkOut - more resources