

Non-redundant functions of H2A.Z.1 and H2A.Z.2 in chromosome segregation and cell cycle progression
- PMID: 34423893
- PMCID: PMC8567233
- DOI: 10.15252/embr.202052061
Non-redundant functions of H2A.Z.1 and H2A.Z.2 in chromosome segregation and cell cycle progression
Abstract
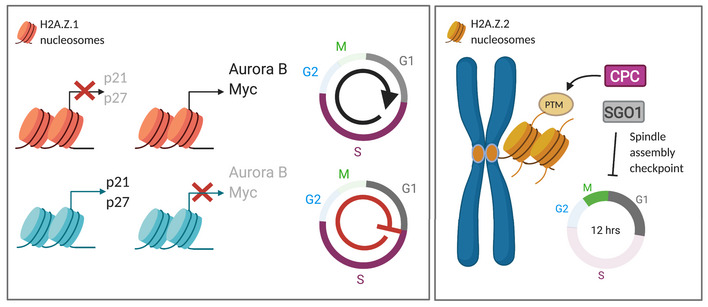
H2A.Z is a H2A-type histone variant essential for many aspects of cell biology, ranging from gene expression to genome stability. From deuterostomes, H2A.Z evolved into two paralogues, H2A.Z.1 and H2A.Z.2, that differ by only three amino acids and are encoded by different genes (H2AFZ and H2AFV, respectively). Despite the importance of this histone variant in development and cellular homeostasis, very little is known about the individual functions of each paralogue in mammals. Here, we have investigated the distinct roles of the two paralogues in cell cycle regulation and unveiled non-redundant functions for H2A.Z.1 and H2A.Z.2 in cell division. Our findings show that H2A.Z.1 regulates the expression of cell cycle genes such as Myc and Ki-67 and its depletion leads to a G1 arrest and cellular senescence. On the contrary, H2A.Z.2, in a transcription-independent manner, is essential for centromere integrity and sister chromatid cohesion regulation, thus playing a key role in chromosome segregation.
Keywords: CPC; MYC; centromere; senescence; spindle assembly checkpoint.
© 2021 The Authors. Published under the terms of the CC BY 4.0 license.
Conflict of interest statement
The authors declare that they have no conflict of interest.
Figures
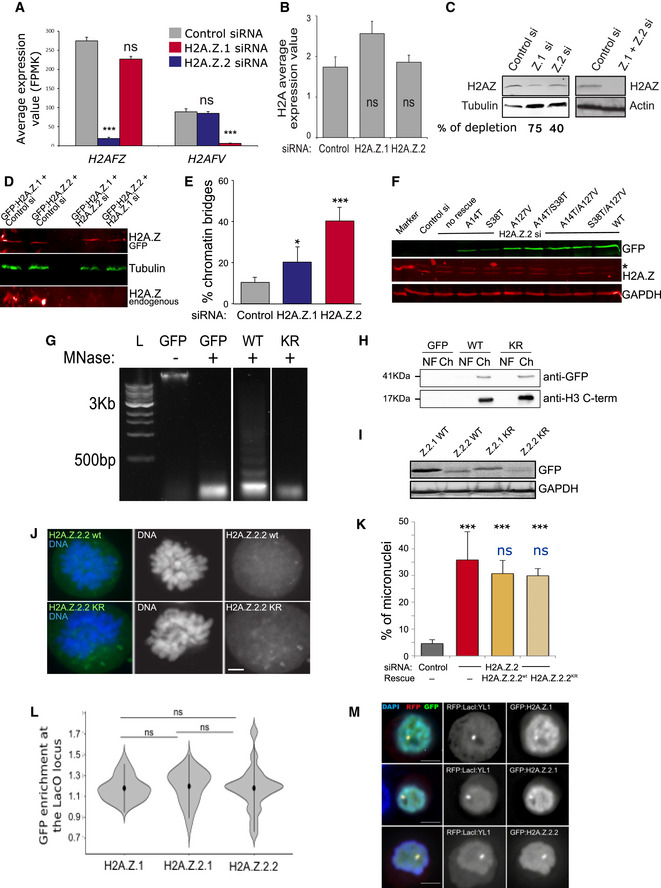
H2AFZ and H2AFV average expression values obtained by RNA sequencing of three biological replicates after control, H2A.Z.1 and H2A.Z.2 siRNA treatment. Error bars show the standard deviation (SD). ***P < 0.001; ns, not significant.
H2A average expression values obtained by RNA sequencing of three biological replicates after control H2A.Z.1 or H2A.Z.2 siRNA treatment. Error bars show the standard deviation (SD). ns, not significant.
Western blot of HeLa whole cell lysates after control, H2A.Z.1, H2A.Z.2 or H2A.Z.1 + H2.A.Z.2 siRNA and probed with anti H2AZ antibody or actin or tubulin. The single depletions were imaged and quantified by LICOR.
Western blot of HeLa cells transfected with control si + GFP:H2A.Z.1, with control si + GFP:H2A.Z.2, H2A.Z.1 si + GFP:H2A.Z.2 and H2A.Z.2 si + GFP:H2A.Z.1. The blot was probed with H2A.Z (red) and tubulin (green) antibodies and imaged by LICOR. Top panel shows the GFP:H2A.Z and the bottom panel the endogenous H2A.Z.
Quantification of the number of anaphases with chromatin bridges of HeLa cells after transfection with control, H2A.Z.1 or H2A.Z.2 siRNA. Error bars represent SD of three biological replicates. At least 100 anaphases were analysed for each condition. Data sets were statistically analysed using Chi‐square test. *P < 0.05; ***P < 0.001.
Western blot analysis using an anti‐GFP, H2A.Z and GAPDH antibodies of HeLa cells transfected with H2A.Z.2 siRNA and the indicated GFP constructs. The blot was imaged by LICOR. The star indicates a non‐specific band.
HeLa cells were transfected with GFP, GFP:H2A.Z.2.1WT (WT) or GFP:H2A.Z.2.1KR (KR), lysed and digested with micrococcal nuclease (MNase) for 30 min to generate mononucleosomes. L: DNA ladder.
The chromatin fraction (Ch) from (I) was separated on SDS–PAGE, together with the nuclear fraction (NF), and subjected to GFP immunoblotting. Anti‐H3 C‐terminus antibody was used as a control.
Western blot analysis using anti‐GFP antibody in cells transfected with H2A.Z.2 siRNA and each of the indicated GFP constructs.
Representative images of prometaphase chromosomes from HeLa cells co‐transfected with H2A.Z.2 siRNA and either H2A.Z.2wt or H2A.Z.2KR mutant Scale bar: 5 μm.
Quantification of the percentage of cells with micronuclei from experiment (J). The error bars represent the SD of three biological replicates (control si N = 887; H2A.Z.2 si N = 1,005; H2A.Z.2 si + H2A.Z.2.2wt N = 465; H2A.Z.2si + KR N = 353). Data sets were statistically analysed using Chi‐square test: ***P < 0.001; ns, not significant. Black refers to the comparison with the control RNAi, and blue refers to the comparison with the H2A.Z.2si + H2A.Z.2.2wt data.
GFP enrichment was calculated as a ratio between the intensity at LacI spot and the mean of two random nuclear spots. Mean and SD are shown. Data sets were statistically analysed using Wilcoxon rank test. ns, not significant.
Representative images of DT40 cells carrying a LacO array inserted at a single locus co‐transfected with RFP:LacI:YL1 (red) and either GFP:H2A.Z.1, GFP:H2A.Z.2.1 or GFP:H2A.Z.2.2 (green). Scale bar: 5 μm.
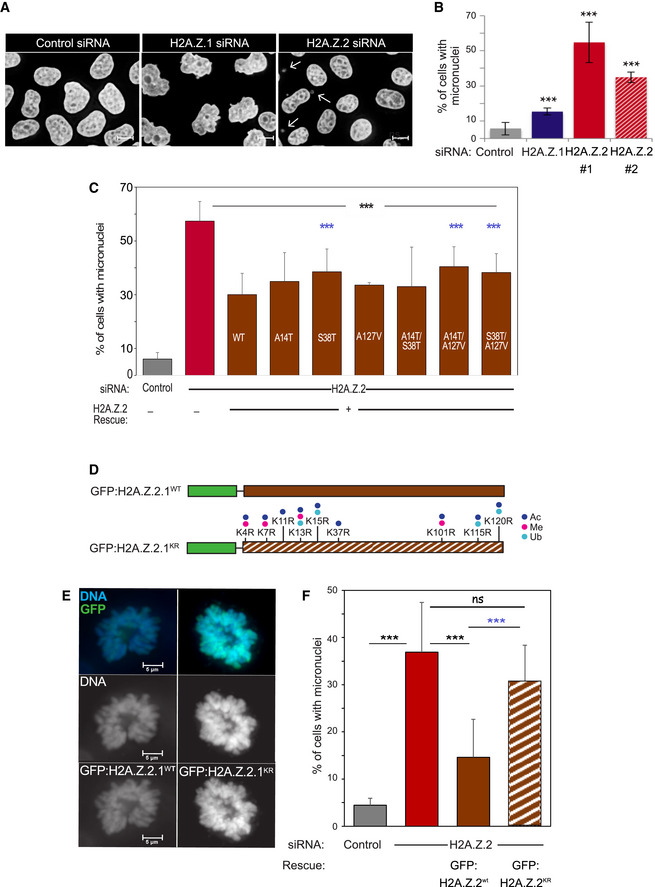
Representative images of HeLa cells treated with control, H2A.Z.1 or H2A.Z.2 siRNA for 72 h, fixed and stained with DAPI. White arrows point at micronuclei. Scale bar: 10 μm.
Quantification of the percentage of cells with micronuclei from experiment in (A). Three biological replicates were analysed for each condition (control si N = 1,271; H2A.Z.1 si N = 1,091; H2A.Z.2#1 si N = 1,188; H2A.Z.2#2 si N = 1,193). The error bars represent the SD. Data sets were statistically analysed using Chi‐square test. ***P < 0.001.
Quantification of the percentage of cells with micronuclei from HeLa cells co‐transfected with H2A.Z.2 siRNA and GFP:H2A.Z.2.1WT with either single or double mutations. Error bars represent the SD of three biological replicates (control si N = 1,316; H2A.Z.2 si N = 1,877; H2A.Z.2 si + wt N = 1,973; H2A.Z.2 si + A14T N = 618; H2A.Z.2 si + S38T N = 558; H2A.Z.2 si + A127V N = 649; H2A.Z.2 si + A14T/S38T N = 1,090; H2A.Z.2 si + A14T/A127V N = 1,038; H2A.Z.2 si + S38T/A127V N = 1,150). Data sets were statistically analysed using Chi‐square test. ***P < 0.001; black stars refer to the comparison with the H2A.Z.2si data, and blue stars refer to the comparison with the H2A.Z.2si + wt data; no stars = non‐significant.
Schemes of the GFP constructs used for the rescue experiments in (E) and (F). Green boxes represent the GFP, brown boxes represent the H2A.Z.2.1 isoform. Solid fill represents the WT construct whereas striped box represents the KR mutant form where the residues indicate the mutations performed. Dots represent the possible post‐translational modifications in the mutated amino acids: acetylation (ac, dark blue), methylation (me, pink) and ubiquitination (ub, light blue).
Representative images of prometaphase chromosomes from HeLa cells co‐transfected with H2A.Z.2 siRNA and each of the constructs in (D) (green). Scale bar: 5 μm.
Quantification of the percentage of cells with micronuclei from experiment (E). The error bars represent the SD of three biological replicates (control si N = 887; H2A.Z.2 si N = 1,005; H2A.Z.2 si + wt N = 760; H2A.Z.2 si + KR N = 479). Data sets were statistically analysed using Chi‐square test. ***P < 0.001; ns, not significant. Blue stars refer to the comparison with the H2A.Z.2 si + wt data.
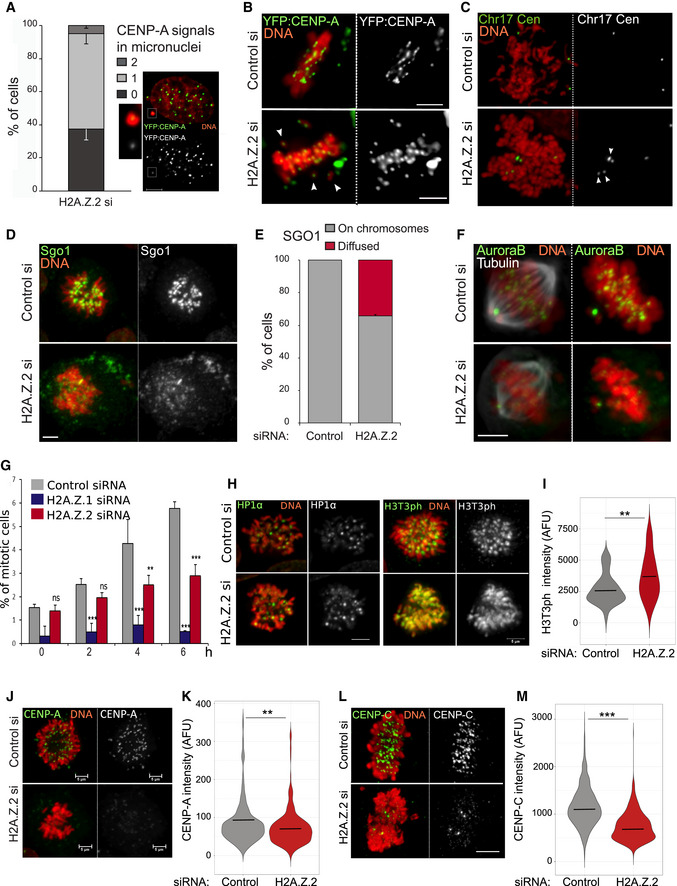
Quantification of micronuclei containing 0, 1 or 2 CENP‐A signals in HeLa YFP:CENP‐A cells transfected with control and H2A.Z.2 siRNA for 72 h. 160 micronuclei were analysed. Error bars indicate SD of three biological replicates. The image represents an example of a micronucleus containing a single CENP‐A signal. The insets are enlargements of the MN. Scale bar 5 μm.
Representative images of metaphases from YFP:CENP‐A (green) HeLa cells treated with control (top) or H2A.Z.2 (bottom) siRNA. The white arrowheads indicate the mis‐aligned chromosomes. Scale bar: 10 μm.
Representative images of metaphase spreads from control (top) or H2A.Z.2 (bottom) siRNA‐transfected HeLa cells after FISH with a Chr17 centromeric probe (green). The arrowheads indicate the separated sister chromatids. Scale bar: 10 μm.
Representative images of HeLa cells transfected with control (top) or H2A.Z.2 (bottom) siRNA, fixed and stained for Sgo1 (green). Scale bar: 10 μm.
Quantification of Sgo1 localisation in prometaphase cells from the experiment in (D). Error bar represents SD of two biological replicates. 35 prometaphase cells were analysed.
Representative images of HeLa cells treated as in (D) and stained for Aurora B (green) and alpha tubulin (grey). Scale bar: 10 μm.
Mitotic index of HeLa cells transfected with control (grey), H2A.Z.1 (blue) or H2A.Z.2 (red) siRNA and treated with nocodazole for 0, 2, 4 or 6 h. At least 800 cells were analysed for each category. Error bar represents SD of three biological replicates. **P < 0.01; ***P < 0.001, ns, not significant (Chi‐square test).
Left panels: Representative images of HeLa cells treated as in (D) and stained for HP1α (green). Scale bar: 10 μm. Right panels: Representative images of HeLa cells treated as in (D) and stained for H3T3ph (green). Scale bar 5 μm.
Violin plot of centromeric H3T3ph intensity of prometaphase/metaphase cells from the experiment in (H). The median is shown as bar. Data sets were statistically analysed using the Wilcoxon rank test in R. **P < 0.01.
Representative images of HeLa YFP:CENP‐A (green) mitotic cells after control (top) or H2A.Z.2 (bottom) siRNA treatment. Scale bar: 5 μm.
Violin plot of centromeric CENP‐A intensity of prometaphase/metaphase cells from the experiments in J. (control si N = 197, H2A.Z.2 si N = 260). The bar represents the median. Data sets were statistically analysed using the Wilcoxon rank test in R. **P < 0.01.
Representative images of HeLa mitotic cells stained for CENP‐C after control (top) or H2A.Z.2 (bottom) siRNA treatment. Scale bar: 5 μm.
Violin plot of centromeric CENP‐C intensity of prometaphase/metaphase cells from the experiments in L. (control si N = 1,083, H2A.Z.2 si N = 686, from 3 biological replicas). The bars represent the median. Data sets were statistically analysed using the Wilcoxon rank test in R. ***P < 0.0001.
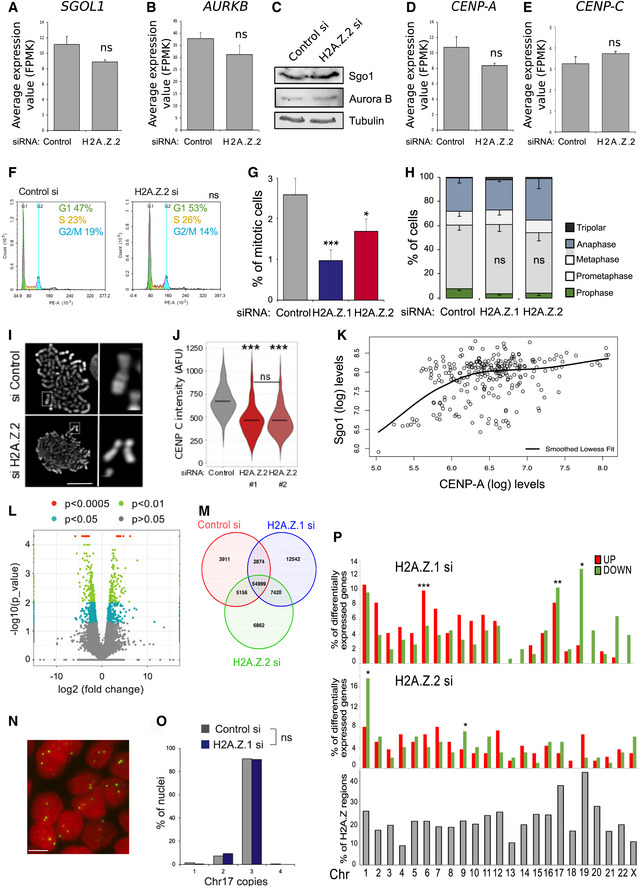
SGOL1 average expression values obtained by RNA sequencing of three biological replicates after control and H2A.Z.2 siRNA treatment. Error bars show the standard deviation (SD). ns, not significant (Student's t‐test).
AURKB average expression values obtained by RNA sequencing of three biological replicates after control and H2A.Z.2 siRNA treatment. Error bars show the standard deviation (SD). ns, not significant (Student's t‐test).
Western blot analysis of Sgo1 and Aurora B in mitotic cells after control and H2A.Z.2 siRNA treatment.
CENP‐A average expression values obtained by RNA sequencing of three biological replicates after control and H2A.Z.2 siRNA treatment. Error bars show the standard deviation (SD). ns, not significant (Student's t‐test).
CENP‐C average expression values obtained by RNA sequencing of three biological replicates after control and H2A.Z.2 siRNA treatment. Error bars show the standard deviation (SD). ns, not significant (Student's t‐test).
Flow cytometry analyses profiles of control and H2A.Z.2 siRNA‐treated HeLa cells. Percentages represent the mean of two biological replicates. Data sets were statistically analysed using Chi‐square test. ns, not significant.
Mitotic index of HeLa cells transfected with control, H2A.Z.1 or H2A.Z.2 siRNA. Error bars represent SD of three biological replicates. At least 2,500 cells were analysed for each condition. Data sets were statistically analysed using Chi‐square test. ***P < 0.001; *P < 0.05.
Mitotic cells from the experiment in (G) were analysed and classified by mitotic stage. Error bars represent SD of three biological replicates. At least 300 mitotic cells were analysed for each condition. ns, not significant (Chi‐square test).
Mitotic spreads of HeLa cells treated with control (top) or H2A.Z.2 (bottom) siRNA. #1. The panel on the right shows a magnification of a chromosome from the box in the left panel (Scale bar 10 μm).
Violin plot of centromeric CENP‐C intensity of prometaphase/metaphase cells from HeLa cells treated with control, H2A.Z.2#1 or H2A.Z.2#2 siRNA (control si N = 243 H2A.Z.2 si#1 N = 80, H2A.Z.2 si#2 N = 502). The bars represent the median. Data sets were statistically analysed using the Wilcoxon rank test in R. ***P < 0.0001; ns, not significant.
Graph showing the correlation between YFP:CENP‐A signals and the intensity of Sgo1 signals at the centromeres of prometaphase chromosomes after H2A.Z.2 depletion. The black line represents the lowest smoothed fit.
Volcano plot representation of differentially expressed genes in the H2A.Z.1‐depleted cells vs the H2A.Z.2‐depleted cells data sets. Y‐axis represents the ‐log10 of the P‐value. Coloured points mark the genes with significantly increased or decreased expression. X‐axis represents the log2 value of the fold change: points with log2 < 0 indicate downregulated genes in the H2A.Z.2‐depleted cells data set compared with the H2A.Z.1‐depleted cells data set; log2 > 0 indicate upregulated genes (Student's t‐test).
Venn diagram of the regions identified by ATAC‐seq in control si, H2A.Z.1 si‐ and H2A.Z.2 si‐treated HeLa cells.
Representative image of HeLa nuclei after FISH with a Chr17 centromeric probe (green) (Scale bar 10 μm).
Quantification of the number of FISH signals/nucleus in control (grey) or H2A.Z.1‐depleted (blue) cells. At least 500 nuclei were analysed per condition. Data sets were statistically analysed using Fisher exact test. ns, not significant.
Frequency of genes with altered expression (upregulated—red and downregulated—green) per chromosome after H2A.Z.1 (top panel) or H2A.Z.2 (middle panel) depletion. Bottom panel shows the percentage of H2A.Z‐containing regions/chromosome. Data sets were statistically analysed using Fisher exact test. *P < 0.05, **P < 0.01, ***P < 0.001.
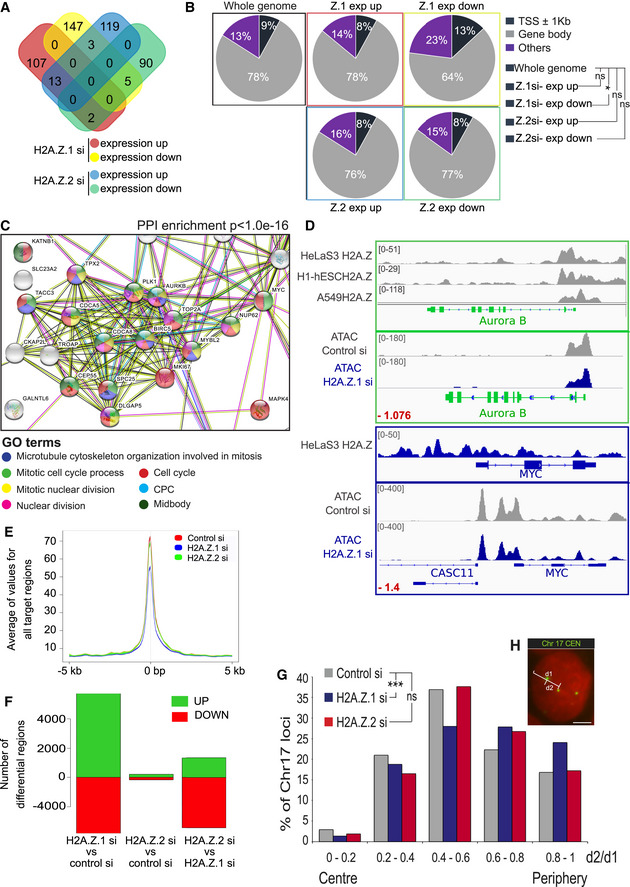
Gene expression of three biological replicates of HeLa cells transfected with control, H2A.Z.1 or H2A.Z.2 siRNA was analysed by RNA sequencing. Venn diagram shows the number of significant (P < 0.01) differentially expressed genes and the overlap between each set of genes.
Pie charts displaying the percentages of H2A.Z peaks at or nearby transcription start sites (TSS) (dark blue), within the gene body (grey) or elsewhere in the whole genome (purple) for the differentially expressed genes following H2A.Z.1 or H2A.Z.2 depletion. A 2‐sample test for equality of proportions was used for the statistical analyses. *P < 0.05; ns, not significant.
Downregulated genes following H2A.Z.1 depletion were analysed by STRING. The image shows the cluster of genes with Gene Ontology (GO) terms related to cell cycle. PPI, protein–protein interaction.
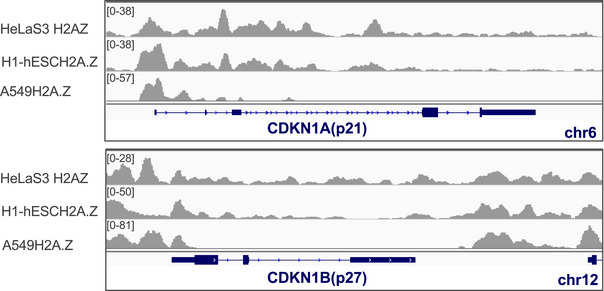
IGV analyses of H2A.Z localisation (from ENCODE) on Aurora B (green) and cMYC (blue) genes showing H2A.Z enrichment at the TSS and at the upstream region, respectively (bottom panels). IGV analyses of ATAC‐seq peaks for control si and H2A.Z.1 si for Aurora B and MYC genes. The number in red represents the log2Ratio H2AZ.1 si/Control si.
Plot representing the average value for all the target regions around the TSS obtained by ATAC‐seq after control, H2A.Z.1 or H2A.Z.2 siRNA.
Plot representing the number of differential chromatin accessibility regions in pairwise comparison. Green (up) represents regions with increased accessibility and red (down) with decreased accessibility.
Distribution of the position within the nucleus of the centromere of Chr17 from the experiment in (H) calculated as the ratio d2/d1. The ratio between d2 and d1 gives the position of the centromere relative to the centre of the nucleus. The graph represents the percentages of centromeres with distances following within the 5 binning categories. At least 500 nuclei were analysed per condition. Data sets were statistically analysed using Chi‐square test for the distribution of signals among the 5 categories. ***P < 0.001.
Representative image of a HeLa nucleus after FISH with Chr17 centromeric probe (green). The distance of the FISH signals from the nucleus periphery was calculated as follows: the distance from the centre of the nucleus to the periphery (d1) and the distance from the centre of the nucleus to the FISH signal (d2) were measured. (scale bar 5 μm).
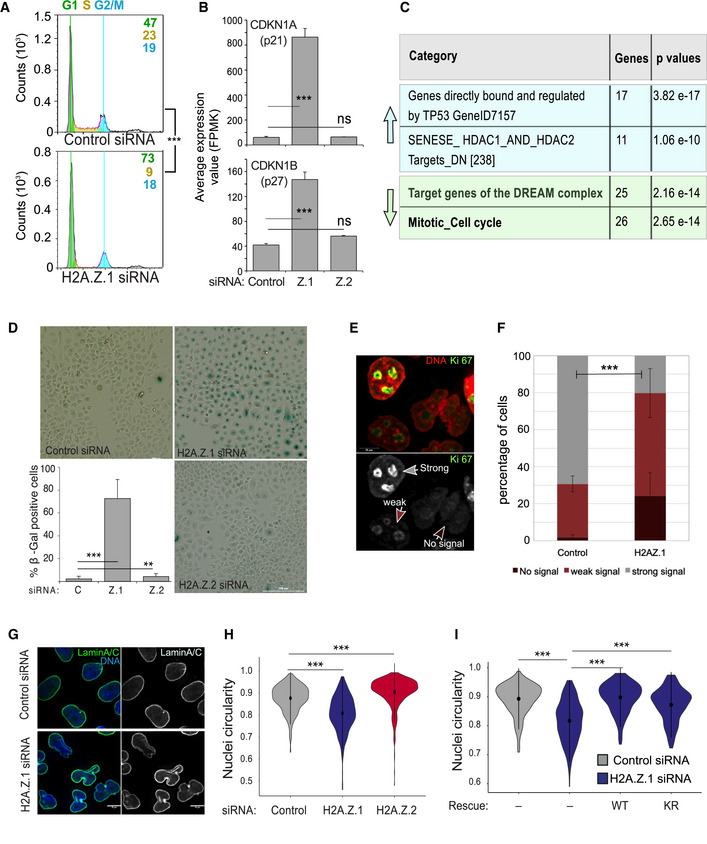
Flow cytometry analysis profiles of control (top) and H2A.Z.1 (bottom) siRNA‐treated HeLa cells. Percentages represent the mean of two biological replicates. Data sets were statistically analysed using Chi‐square test. ***P < 0.001.
CDKN1A (top) and CDKN1B (bottom) average expression values obtained by RNA sequencing of three biological replicates after control, H2A.Z.1 (Z1) or H2A.Z.2 (Z2) siRNA treatment. Error bars show the standard deviation (SD). ***P < 0.001 (Student’s t‐test).
GSEA analyses of the upregulated (light blue upwards arrow) and downregulated (light green downwards arrow) genes upon H2A.Z.1 siRNA indicating the number of genes for category and the relative P‐values.
Representative images of HeLa cells transfected with control, H2A.Z.1 or H2A.Z.2 siRNA and stained for senescence‐associated β‐galactosidase (blue). Scale bar 200 μm. At the bottom‐left, quantification of the percentage of β‐galactosidase‐positive cells. At least 500 cells were counted for each experiment. Error bars show the standard deviation (SD) from two biological replicates. **P < 0.01; ***P < 0.001 (Student’s t‐test).
Representative images of HeLa cell stained for Ki‐67. The arrows indicate the different staining patterns quantified: strong signal (grey arrow), weak signal (light brown arrow) and no signal (dark brown arrow; scale bar 10 μm).
Quantification of the experiment in (E). Error bars indicate the standard deviation from three biological replicates. Data sets were statistically analysed using a Chi‐square test. ***P < 0.001.
Representative images of HeLa cells transfected with control (top) or H2A.Z.1 (bottom) siRNA and stained for Lamin A/C (green). Scale bar = 10 μm.
Violin plots of the nuclear circularity index of HeLa cells transfected with control (grey), H2A.Z.1 (blue) or H2A.Z.2 (red) siRNA. The nuclear circularity was analysed using the NIS Elements AR Analysis software (NIKON). At least 140 nuclei from three biological replicates were analysed for each condition. Mean and SD are shown. Data sets were statistically analysed using the Wilcoxon rank test in R. ***P < 0.001.
Violin plots of the nuclear circularity index of HeLa cells transfected with control (grey) or H2A.Z.1 (blue) siRNA either alone or in combination with siRNA‐resistant GFP:H2A.Z.1WT (WT) or GFP:H2A.Z.1KR (KR) plasmids. The nuclear circularity was analysed using the NIS Elements AR Analysis software (NIKON). At least 140 nuclei from three biological replicates were analysed for each condition. Mean and SD are shown. Data sets were statistically analysed using the Wilcoxon rank test in R. ***P < 0.001.
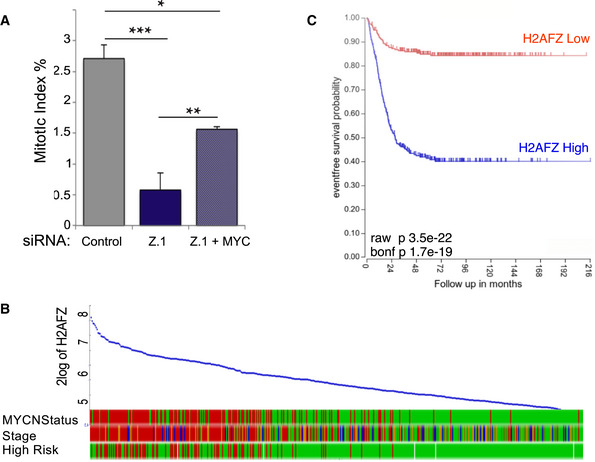
Mitotic index (number of mitotic cells/mitotic + interphase cells) of HeLa cells after control si, H2A.Z.1 si or H2A.Z.1 si + GFP:cMYC. Error bars represent standard deviation from two biological replica (control si N = 1,033; H2A.Z.1 si N = 1,042; H2A.Z.1 si + GFP:cMYC N = 1,024). Data sets were statistically analysed using Chi‐square test. *P < 0.05; **P < 0.01; ***P < 0.001.
Correlation of H2AFZ (H2A.Z.1) expression levels with MYCN status, cancer stage and risk incidence in neuroblastoma patients obtained from R2 genomics.
Kaplan–Meier survival curve for neuroblastoma patients with low (red) or high (blue) expression of H2AFZ (H2A.Z.1) obtained from R2 genomics.
References
-
- Abugessaisa I, Noguchi S, Hasegawa A, Kondo A, Kawaji H, Carninci P, Kasukawa T (2019) refTSS: a reference data set for human and mouse transcription start sites. J Mol Biol 431: 2407–2422 - PubMed
Publication types
MeSH terms
Substances
Grants and funding
LinkOut - more resources
Full Text Sources
Research Materials
