

Association of Increased Serum Lipopolysaccharide, But Not Microbial Dysbiosis, With Obesity-Related Osteoarthritis
- PMID: 34423918
- PMCID: PMC8795472
- DOI: 10.1002/art.41955
Association of Increased Serum Lipopolysaccharide, But Not Microbial Dysbiosis, With Obesity-Related Osteoarthritis
Abstract
Objective: To test the hypothesis that an altered gut microbiota (dysbiosis) plays a role in obesity-associated osteoarthritis (OA).
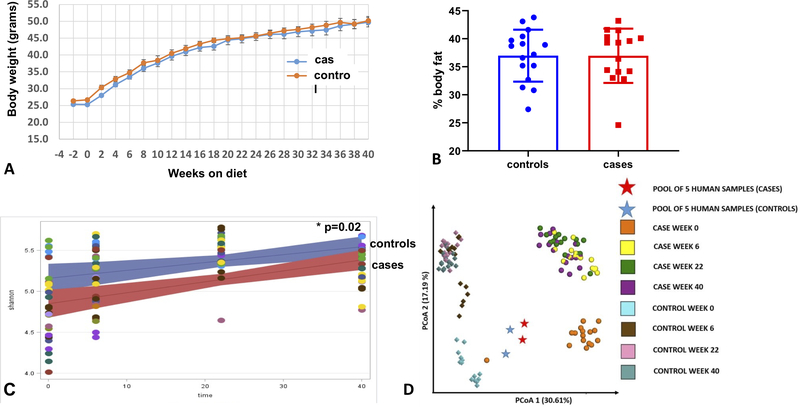
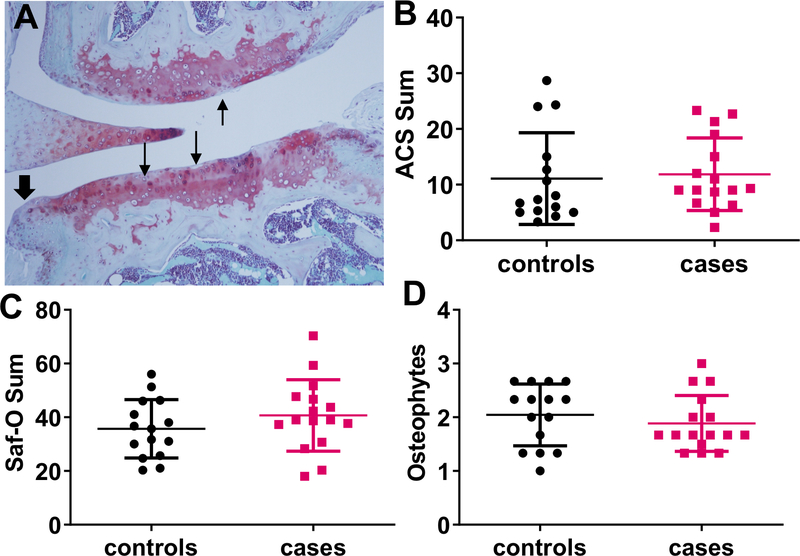
Methods: Stool and blood samples were collected from 92 participants with a body mass index (BMI) ≥30 kg/m2 , recruited from the Johnston County Osteoarthritis Project. OA patients (n = 50) had hand and knee OA (Kellgren/Lawrence [K/L] grade ≥2 or arthroplasty). Controls (n = 42) had no hand OA and a K/L grade of 0-1 for the knees. Compositional analysis of stool samples was carried out by 16S ribosomal RNA amplicon sequencing. Alpha- and beta-diversity and differences in taxa relative abundances were determined. Blood samples were used for multiplex cytokine analysis and measures of lipopolysaccharide (LPS) and LPS binding protein. Germ-free mice were gavaged with patient- or control-pooled fecal samples and fed a 40% fat, high-sucrose diet for 40 weeks. Knee OA was evaluated histologically.
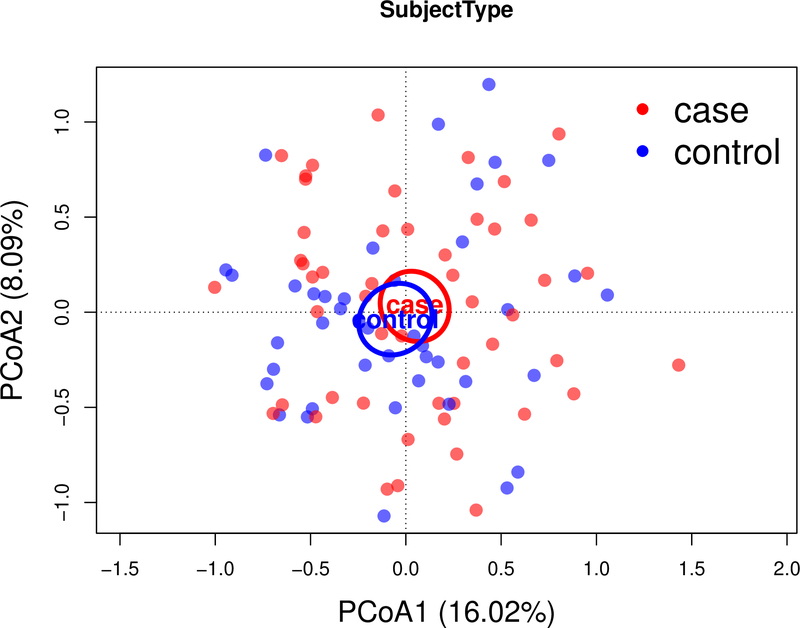
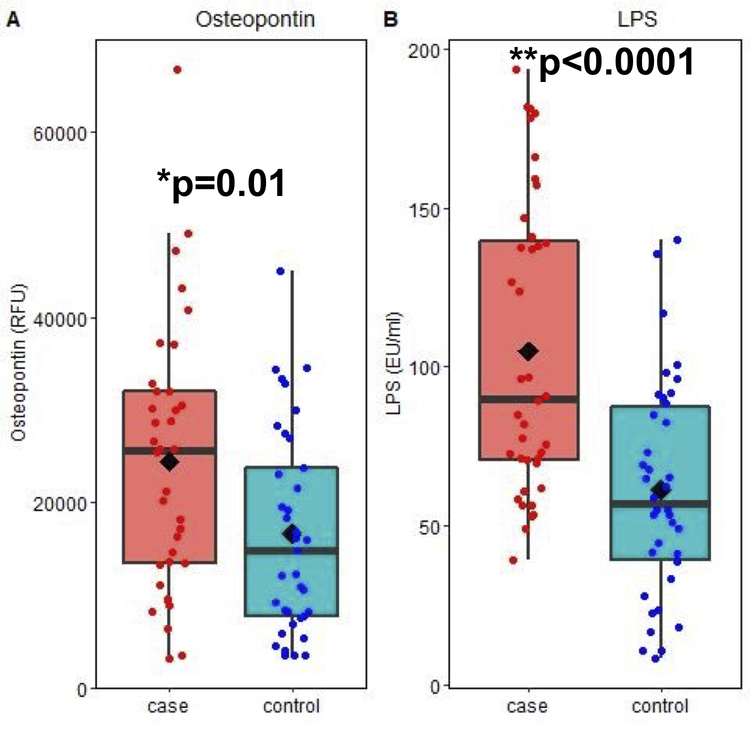
Results: On average, OA patients were slightly older than the controls, consisted of more women, and had a higher mean BMI, higher mean Western Ontario and McMaster Universities Osteoarthritis Index pain score, and higher mean K/L grade. There were no significant differences in α- or β-diversity or genus level composition between patients and controls. Patients had higher plasma levels of osteopontin (P = 0.01) and serum LPS (P < 0.0001) compared to controls. Mice transplanted with patient or control microbiota exhibited a significant difference in α-diversity (P = 0.02) and β-diversity, but no differences in OA severity were observed.
Conclusion: The lack of differences in the gut microbiota, but increased serum LPS levels, suggest the possibility that increased intestinal permeability allowing for greater absorption of LPS, rather than a dysbiotic microbiota, may contribute to the development of OA associated with obesity.
© 2021, American College of Rheumatology.
Conflict of interest statement
Figures
References
-
- Johnson VL, Hunter DJ. The epidemiology of osteoarthritis. Best Pract Res Clin Rheumatol. 2014;28(1):5–15. - PubMed
-
- Sellam J, Berenbaum F. Is osteoarthritis a metabolic disease? Joint Bone Spine. 2013;80(6):568–73. - PubMed
-
- Nicholson JK, Holmes E, Kinross J, Burcelin R, Gibson G, Jia W, et al. Host-gut microbiota metabolic interactions. Science. 2012;336(6086):1262–7. - PubMed
Publication types
MeSH terms
Substances
Grants and funding
- P30-DK-056350/DK/NIDDK NIH HHS/United States
- P30-DK-034987/DK/NIDDK NIH HHS/United States
- P30 DK034987/DK/NIDDK NIH HHS/United States
- P30-AR-072580/AR/NIAMS NIH HHS/United States
- UL1 TR002489/TR/NCATS NIH HHS/United States
- UL1-TR-002489/TR/NCATS NIH HHS/United States
- P40-OD-010995/Office of the Director, NIH
- U01DP006266/ACL/ACL HHS/United States
- P40 OD010995/OD/NIH HHS/United States
- U01 DP006266/DP/NCCDPHP CDC HHS/United States
- U01-DP-006266/CC/CDC HHS/United States
- P30-DK-056350/Nutrition Obesity Resource Core of the National Institute of Diabetes and Digestive and Kidney Diseases
- P30 DK056350/DK/NIDDK NIH HHS/United States
- ARTHFN/ARTHFN/United States
- P30 AR072580/AR/NIAMS NIH HHS/United States
LinkOut - more resources
Full Text Sources
Medical
Research Materials
