. 2021 Aug;129(8):87006.
doi: 10.1289/EHP8792. Epub 2021 Aug 23.

Air Pollution Particulate Matter Exposure and Chronic Cerebral Hypoperfusion and Measures of White Matter Injury in a Murine Model

Affiliations

Air Pollution Particulate Matter Exposure and Chronic Cerebral Hypoperfusion and Measures of White Matter Injury in a Murine Model

Qinghai Liu et al. Environ Health Perspect. 2021 Aug.

Erratum in

Abstract

Background: Exposure to ambient air pollution particulate matter (PM) is associated with increased risk of dementia and accelerated cognitive loss. Vascular contributions to cognitive impairment are well recognized. Chronic cerebral hypoperfusion (CCH) promotes neuroinflammation and blood-brain barrier weakening, which may augment neurotoxic effects of PM.

Objectives: This study examined interactions of nanoscale particulate matter (nPM; fine particulate matter with aerodynamic diameter 200 nm) and CCH secondary to bilateral carotid artery stenosis (BCAS) in a murine model to produce white matter injury. Based on other air pollution interactions, we predicted synergies of nPM with BCAS.

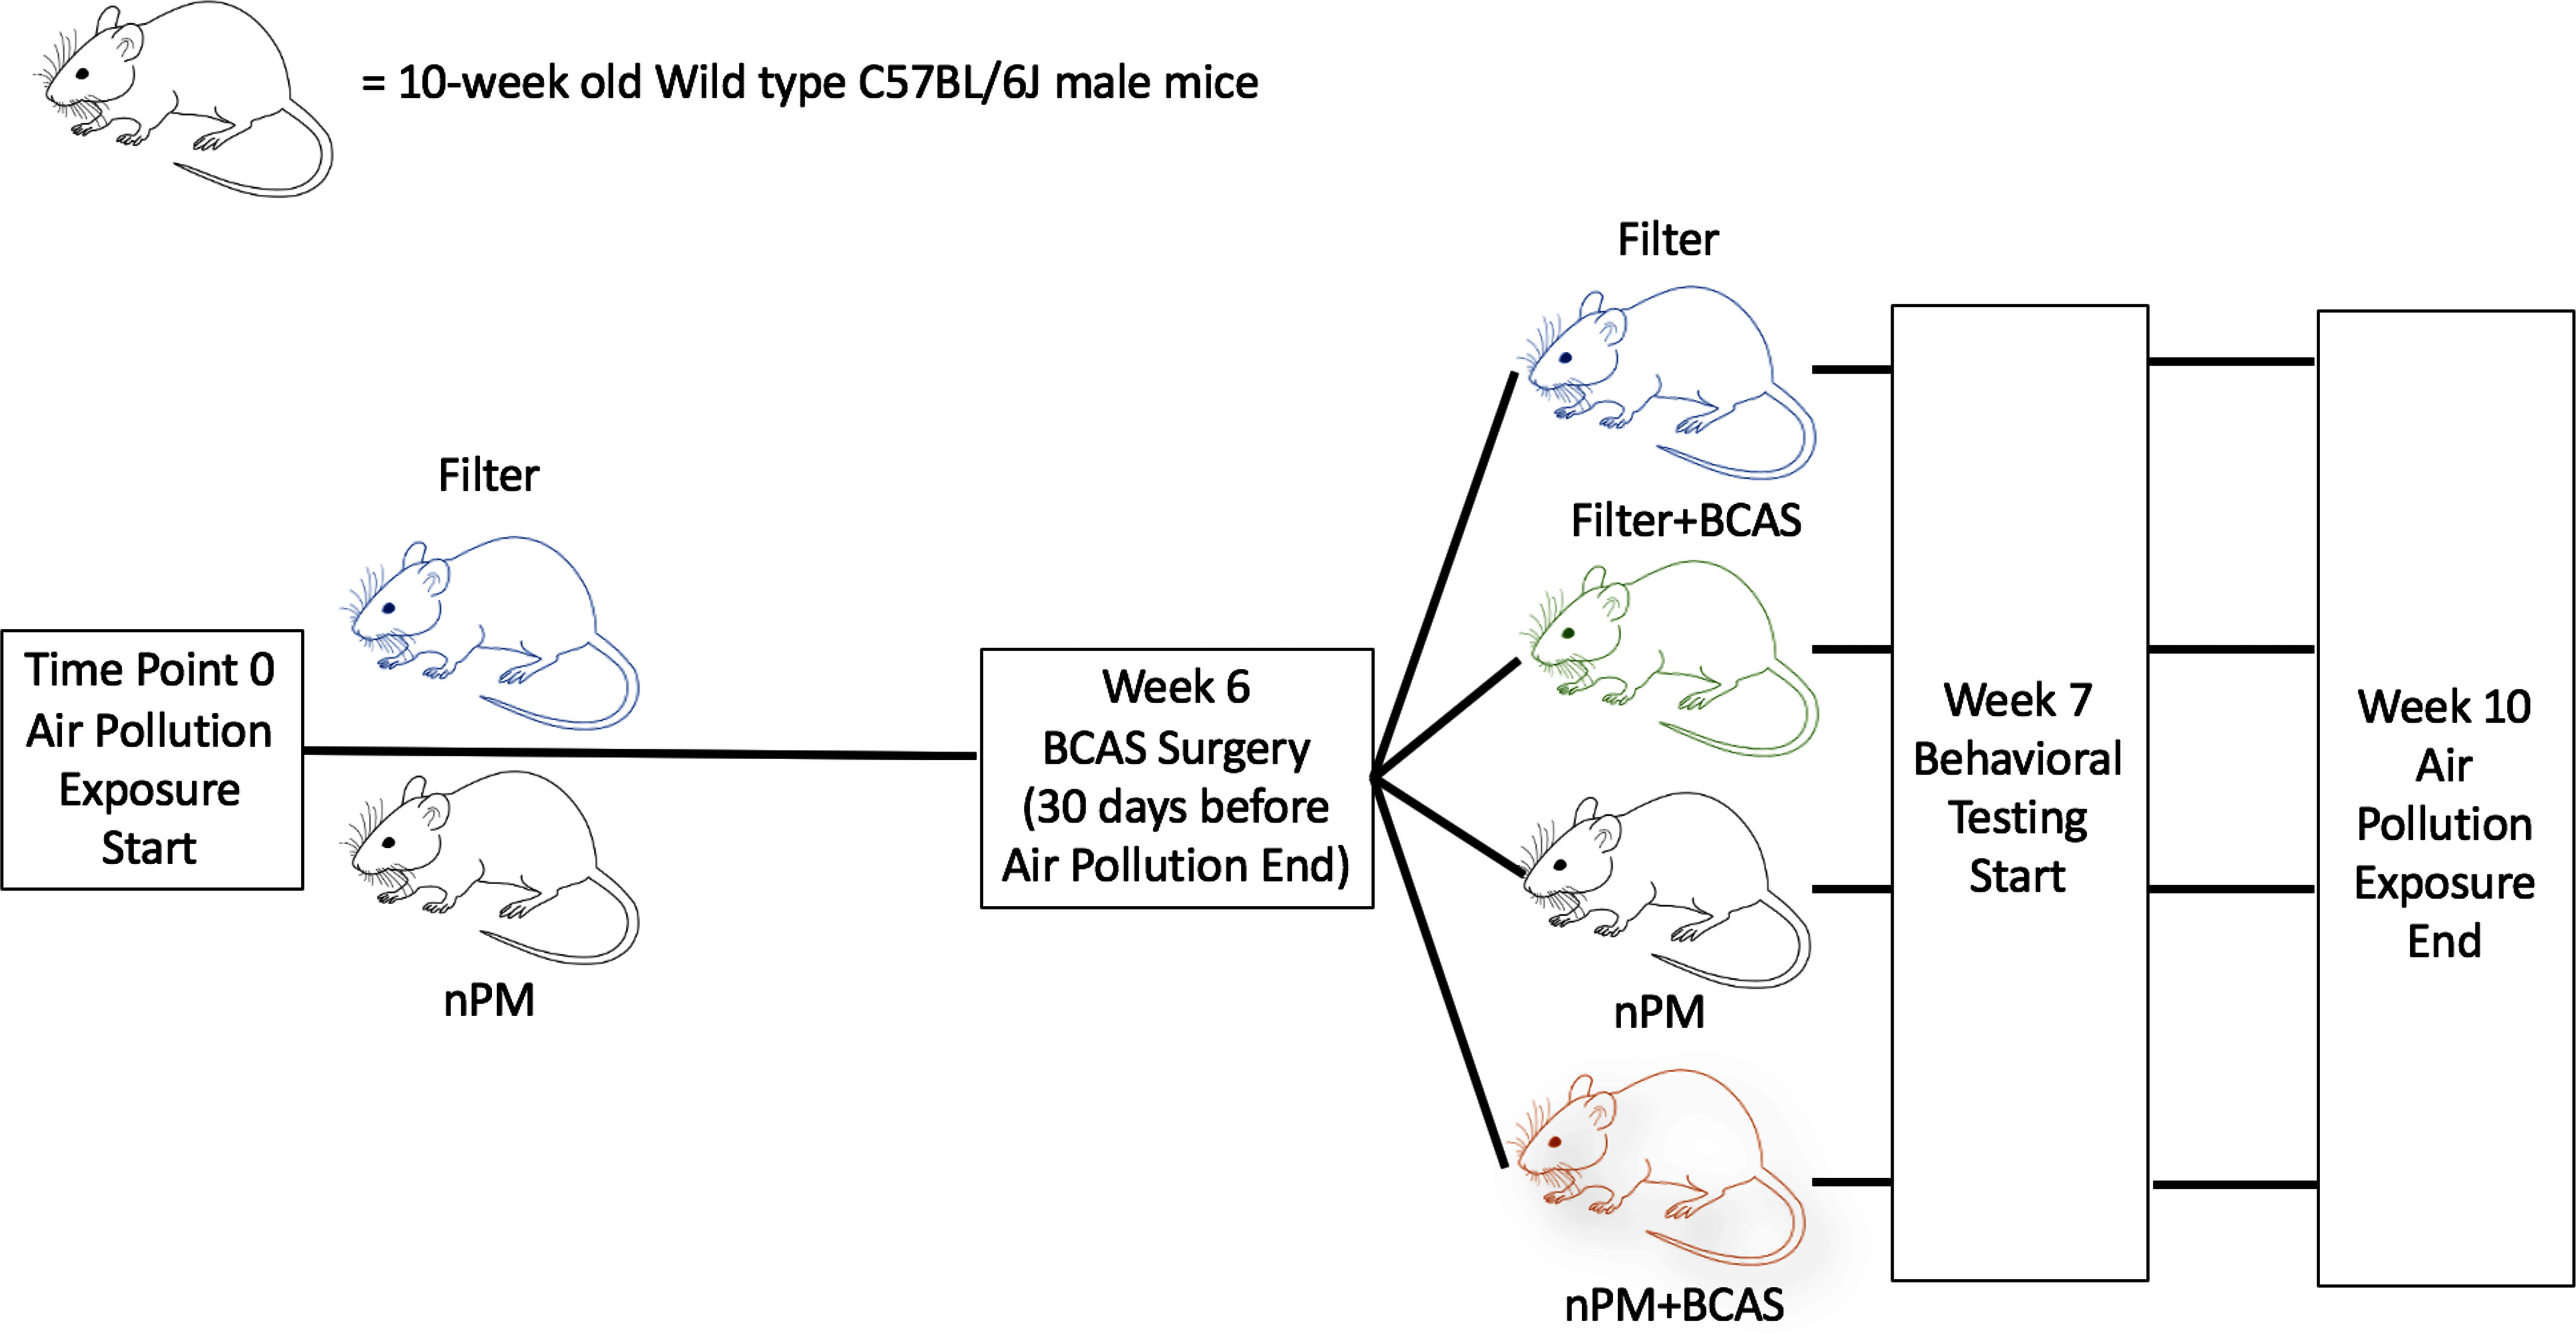
Methods: nPM was collected using a particle sampler near a Los Angeles, California, freeway. Mice were exposed to 10 wk of reaerosolized nPM or filtered air (FA) for 150 h. CCH was induced by BCAS surgery. Mice (C57BL/6J males) were randomized to four exposure paradigms: a) FA, b) nPM, c) FA + BCAS, and d) nPM + BCAS. Behavioral outcomes, white matter injury, glial cell activation, inflammation, and oxidative stress were assessed.
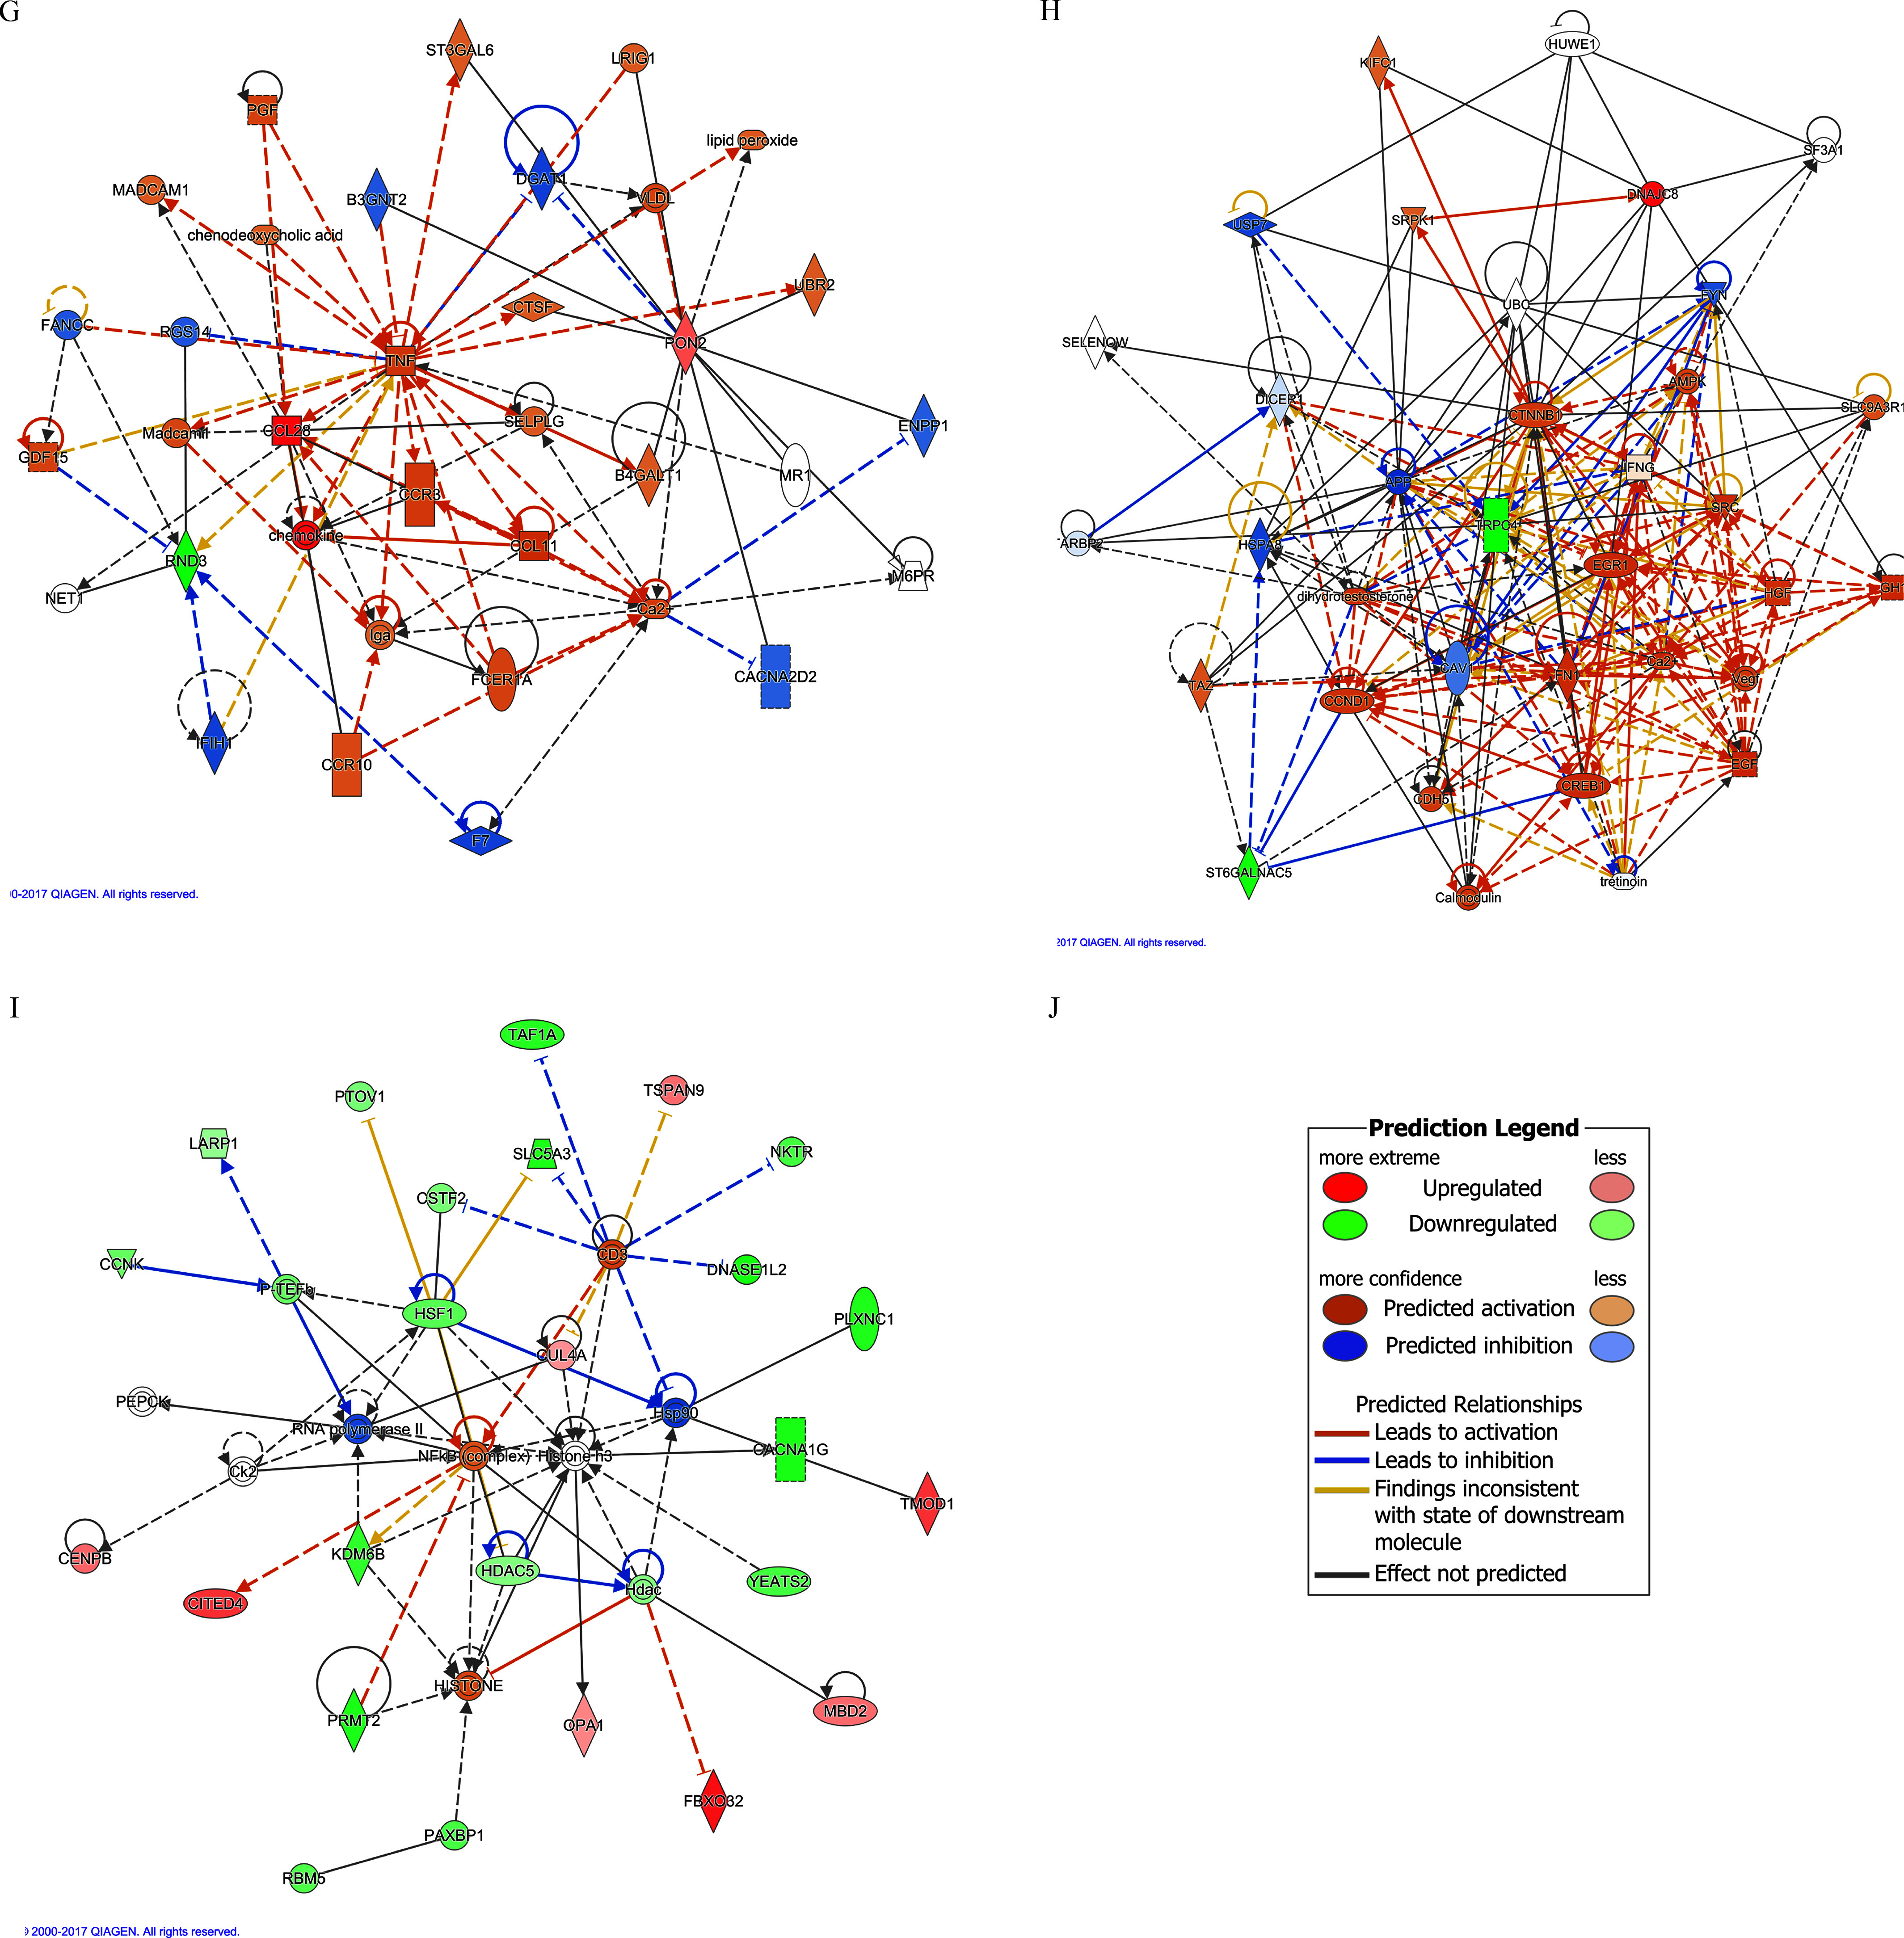
Results: The joint nPM + BCAS group exhibited synergistic effects on white matter injury (2.3× the additive nPM and FA + BCAS scores) with greater loss of corpus callosum volume on T2 magnetic resonance imaging (MRI) (30% smaller than FA group). Histochemical analyses suggested potential microglial-specific inflammatory responses with synergistic effects on corpus callosum C5 immunofluorescent density and whole brain nitrate concentrations (2.1× and 3.9× the additive nPM and FA + BCAS effects, respectively) in the joint exposure group. Transcriptomic responses (RNA-Seq) showed greater impact of nPM + BCAS than individual additive effects, consistent with changes in proinflammatory pathways. Although nPM exposure alone did not alter working memory, the nPM + BCAS cohort demonstrated impaired working memory when compared to the FA + BCAS group.

Discussion: Our data suggest that nPM and CCH contribute to white matter injury in a synergistic manner in a mouse model. Adverse neurological effects may be aggravated in a susceptible population exposed to air pollution. https://doi.org/10.1289/EHP8792.


Figures

Figure 1 is a flowchart having five steps. On the top, an icon of a rat depicts 10 wks old wild type C 5 7 B L or 6 J male mice. Step 1: Time point 0 air pollution exposure start, including filter and Nanoscale Particulate Matter with two icons of a rat, respectively, lead to Wk 6 bilateral carotid artery stenosis surgery (30 days before air pollution end). Step 2: Wk 6 bilateral carotid artery stenosis surgery (30 days before air pollution end) leads to the filer, filter plus bilateral carotid artery stenosis, Nanoscale Particulate Matter, and Nanoscale Particulate Matter plus bilateral carotid artery stenosis with four icons of a rat, respectively. Step 3: Filer, filter plus bilateral carotid artery stenosis, Nanoscale Particulate Matter, and Nanoscale Particulate Matter plus bilateral carotid artery stenosis leads to the Wk 7 behavioral testing start. Step 4: Wk 7 behavioral testing start leads to Wk 10 Air pollution exposure end.
Figure 1.
Experimental model of BCAS and nPM exposure. Mice begin nPM or FA exposure for 5 h/d, 3 d/wk at time point zero. At week 6 of exposure, BCAS surgery is completed. Eight-arm radial maze testing begins at week 7 followed by NOR testing. The exposure ends at the conclusion of week 10. Note: BCAS, bilateral carotid artery stenosis; FA, filtered air; NOR, novel object recognition; nPM, nanoscale particulate matter.
Figure 2A is a set of four microscopic images of corpus callosum Klüver-Barrera staining of mice in experimental group, including filtered air, nanoscale particulate matter, filtered air plus bilateral carotid artery stenosis, and nanoscale particulate matter plus bilateral carotid artery stenosis. Figure 2B is a microscopic image depicting region analyzed at low magnification in a rat, scoring on right or left. Figure 2C is a bar graph, plotting White Matter Injury Score, ranging from 0.0 to 2.5 in increments of 0.5 (y-axis) across filtered air, nanoscale particulate matter, filtered air plus bilateral carotid artery stenosis, and nanoscale particulate matter plus bilateral carotid artery stenosis (x-axis) for Klüver-Barrera score in corpus callosum. Figure 2D is a tabular representation having five rows, and in four columns, it lists Categories, No bilateral carotid artery stenosis, Bilateral carotid artery stenosis, and Bilateral carotid artery stenosis lowercase p. Figure 2E is a display of four columns, namely, Filtered air, Nanoscale particulate matter, Filtered air plus Bilateral carotid artery stenosis, and Nanoscale particulate matter plus Bilateral carotid artery stenosis and three rows, namely Degraded myelin basic protein, Nuclei, and Merge. Figure 2F is a bar graph, plotting Integrated Density per micrometer squared, ranging from 0 to 15 in increments of 5 (y-axis) across filtered air, nanoscale particulate matter, filtered air plus bilateral carotid artery stenosis, and nanoscale particulate matter plus bilateral carotid artery stenosis (x-axis) for degraded myelin basic protein in corpus callosum. Figure 2G is a set of four microscopic images depicting T 2 weighted images of the corpus callosum of mice in experimental groups, including filtered air, nanoscale particulate matter, filtered air plus bilateral carotid artery stenosis, and nanoscale particulate matter plus bilateral carotid artery stenosis. Figure 2H is a Magnetic Resonance Imaging image depicting region of interest in the corpus callosum. Figure 2I is a bar graph, plotting Volume (millimeter cubed), ranging from 1.0 to 3.0 in increments of 0.5 (y-axis) across filtered air, nanoscale particulate matter, filtered air plus bilateral carotid artery stenosis, and nanoscale particulate matter plus bilateral carotid artery stenosis (x-axis) for anterior corpus callosum.
Figure 2.
Measures of white matter damage in the corpus callosum of mice exposed to nPM or FA with or without BCAS. (A) Representative corpus callosum Klüver-Barrera staining of mice in each experimental group (400×). (B) Representative image of region analyzed at low magnification (Scoring on right/left. Right demarcated.). (C–D) White matter injury score in mice exposed to nPM or FA with or without bilateral carotid artery stenosis (BCAS) (n=18/group; numbers are mean±standard error). General linear model with main effects for nPM, BCAS, nPM+BCAS interaction was used to calculate the synergy p-value in D. Exposure and BCAS p-values were calculated using the Tukey Kramer adjustment. (E) Representative images of degraded myelin basic protein (dMBP; red) immunofluorescence and nuclei (blue) in the corpus collosum of mice in each experimental group (200×). Analysis performed on both right/left side (right region demarcated in B). (F) dMBP immunofluorescent density in the corpus collosum of mice in each experimental group. (G) Representative T2 weighted images of the corpus callosum of mice in each experimental group. (H) T2 weighted representative MR image of region of interest in the corpus callosum. Yellow dashed square indicates insert in G. (I) Corpus callosum volume in mice exposed to nPM or FA with or without BCAS. Data represented as mean±standard error. Scale bars in images represent 50μm. (A–D) n = 18 FA, 18 nPM, 18 FA + BCAS, 18 nPM + BCAS. (E–F) n = 8 FA, 8 nPM, 8 nPM, 8 FA + BCAS, 7 nPM + BCAS. (G–I) n = 6 FA, 6 nPM, 5 FA + BCAS, 6 nPM + BCAS. General linear model with main effects for nPM, BCAS, nPM+BCAS interaction were used; pairwise comparisons used Tukey Kramer adjustment. Summary data is provided in Table 1. Note: BCAS, bilateral carotid artery stenosis; dMBP, degraded myelin basic protein; FA, filtered air; KB, Klüver-Barrera; nPM, nanoscale particulate matter. *p<0.05, **p0.01, ***p0.001, ****p0.0001.
Figures 3A and 3C is a display of four columns, namely, filtered air, nanoscale particulate matter, Filtered air plus Bilateral carotid artery stenosis, and Nanoscale particulate matter plus Bilateral carotid artery stenosis and one row, namely, Ionized calcium-binding adaptor protein-1 and Glial fibrillary acidic protein, respectively. Figures 3B and 3D are bar graphs, plotting Positive cells per 0.1 millimeter squared, ranging from 0 to 250 in increments of 50 and 0 to 250 in increments of 50 (y-axis) across filtered air, nanoscale particulate matter, filtered air plus bilateral carotid artery stenosis, and nanoscale particulate matter plus bilateral carotid artery stenosis (x-axis) for Ionized calcium-binding adaptor protein-1 in corpus callosum and Glial fibrillary acidic protein in corpus callosum, respectively.
Figure 3.
Measures of immune cell activation in the corpus callosum of mice exposed to nPM or FA with or without BCAS. (A) Representative images of Iba-1 immunohistochemistry in the corpus callosum of mice in each experimental group (400×). (B) Iba-1 positive cell counts in the corpus callosum of mice in each experimental group. (C) Representative images of GFAP immunohistochemistry in the corpus callosum of mice in each experimental group (400×). Analysis was performed on both right/left side (location of right region is demarcated area in Figure 2B). (D) GFAP positive cell counts in the corpus callosum of mice in each experimental group. Data in graphs represented as mean±standard error. Scale bars represent 50μm. Error bars represent standard error. n for all panels=18 FA, 18 nPM, 12 FA+BCAS, and 12 nPM+BCAS. General linear model with main effects for nPM, BCAS, and the nPM+BCAS interaction (testing for synergy) were used. Pairwise comparisons used Tukey Kramer adjustment for multiple comparisons. Summary data is provided in Table 1. Note: BCAS, bilateral carotid artery stenosis; FA, filtered air; GFAP, glial fibrillary acidic protein; Iba-1, ionized calcium-binding adaptor protein-1; nPM, nanoscale particulate matter. *p<0.05, **p0.01, ***p0.001, ****p0.0001.
Figure 4A is a western blot, plotting Toll-like receptor 4, Glyceraldehyde 3-phosphate dehydrogenase, complement component 5, Glyceraldehyde 3-phosphate dehydrogenase, complement component 5 lowercase alpha, Glyceraldehyde 3-phosphate dehydrogenase, complement component 5 lowercase alpha receptor, and Glyceraldehyde 3-phosphate dehydrogenase (y-axis) across filtered air plus bilateral carotid artery stenosis, nanoscale particulate matter plus bilateral carotid artery stenosis, filtered air, and nanoscale particulate matter (x-axis). Figures 4B, 4C, 4D, 4E, 4G, 4I, and 4K are bar graphs titled Toll-like receptor 4 western blot, complement component 5 western blot, complement component 5 lowercase alpha western blot, complement component 5 lowercase alpha receptor western blot, complement component 5 in corpus callosum, complement component 5 lowercase alpha in corpus callosum, and complement component 5 lowercase alpha receptor in corpus callosum, plotting Toll-like receptor 4 per Glyceraldehyde 3-phosphate dehydrogenase relative density, ranging from 0.0 to 2.0 in increments of 0.5; complement component 5 per Glyceraldehyde 3-phosphate dehydrogenase relative density, ranging from 0.0 to 2.0 in increments of 0.5; complement component 5 lowercase alpha per Glyceraldehyde 3-phosphate dehydrogenase relative density, ranging from 0.0 to 2.5 in increments of 0.5; complement component 5 lowercase alpha receptor per Glyceraldehyde 3-phosphate dehydrogenase relative density, ranging from 0.0 to 1.5 in increments of 0.5; integrated density per millimeter squared, ranging from 0 to 25 in increments of 5; integrated density per millimeter squared, ranging from 0 to 30 in increments of 10; and integrated density per millimeter squared, ranging from 0 to 40 in increments of 10 (y-axis) across filtered air, nanoscale particulate matter, filtered air plus bilateral carotid artery stenosis, and nanoscale particulate matter plus bilateral carotid artery stenosis (x-axis), respectively. Figures 4F, 4H, and 4J is a display of four columns, namely filtered air, nanoscale particulate matter, filtered air plus bilateral carotid artery stenosis, and nanoscale particulate matter plus bilateral carotid artery stenosis and three rows, namely, complement component 5, Nuclei, and Merge; complement component 5, Nuclei, and Merge; and complement component 5 lowercase alpha receptor, Nuclei, and Merge. Figure 4L is a tabular representation having five rows, and in four columns, lists Categories, No bilateral carotid artery stenosis, bilateral carotid artery stenosis, and bilateral carotid artery stenosis lowercase p.
Figure 4.
Measures of brain inflammation in the corpus callosum of mice exposed to nPM or FA with or without BCAS. (A) Representative images of C5 (red) immunofluorescence and nuclei (blue) in the corpus callosum of mice in each experimental group (200×). (B) C5 immunofluorescent density in the corpus callosum of mice in each experimental group. (C) Representative images of C5α (red) immunofluorescence and nuclei (blue) in the corpus callosum of mice in each experimental group (200x). (D) C5α immunofluorescent density in the corpus callosum of mice in each experimental group. (E) Representative images of CD88 (red) immunofluorescence and nuclei (blue) in the corpus callosum of mice in each experimental group (200x). (F) CD88 immunofluorescent density in the corpus callosum of in each experimental group. (G) Effect of single and joint nPM and BCAS exposure on C5 immunofluorescent density in the corpus callosum of mice. General linear model with main effects for nPM, BCAS, nPM+BCAS interaction was used to calculate the synergy p-value. Exposure and BCAS p-values were calculated using the Tukey Kramer adjustment. Numbers are mean±standard error. Analyses for A–F were performed on both right/left sides (right region demarcated area in Figure 2B). Data represented as mean±standard error. Scale bars represent 50μm. (A–G) C5 and C5α: n=18 FA, 18 nPM, 12 FA+BCAS, 13 nPM+BCAS; CD88: n=8 FA, 8 nPM, 8 FA+BCAS, 7 nPM+BCAS. General linear model with main effects for nPM, BCAS, nPM+BCAS interaction were used; pairwise comparisons used Tukey Kramer adjustment. Summary data is provided in Table 1. Note: BCAS, bilateral carotid artery stenosis; C5, complement component 5; C5α, complement component 5α; CD88, complement component C5α receptor; FA, filtered air; nPM, nanoparticulate matter. *p<0.05, **p0.01, ***p0.001, ****p0.0001.
Figures 5A, 5B, and 5D are bar graphs titled Nitrite, Nitrate, and 8-oxo-2’-deoxyguanosine in corpus callosum, plotting concentration (micromolar), ranging from 0 to 10 in increments of 2; concentration (micromolar), ranging from 0 to 150 in increments of 50; and integrated density, ranging from 0 to 10 in increments of 2 (y-axis) across filtered air, nanoscale particulate matter, filtered air plus bilateral carotid artery stenosis, and nanoscale particulate matter plus bilateral carotid artery stenosis (x-axis), respectively. Figure 5C is a display of four columns, namely, filtered air, nanoscale particulate matter, filtered air plus bilateral carotid artery stenosis, and nanoscale particulate matter plus bilateral carotid artery stenosis and three rows, namely, 8-oxo-2’-deoxyguanosine, Nuclei, and Merge. Figure 5E is a tabular representation having five rows and in four columns, lists Categories, No bilateral carotid artery stenosis, bilateral carotid artery stenosis, and bilateral carotid artery stenosis lowercase p.
Figure 5.
Measures of oxidative stress in the corpus callosum and whole brain of mice exposed to nPM or FA with or without BCAS. (A) Nitrite concentrations in the whole brain of mice in each experimental group. (B) Nitrate concentrations in the whole brain of mice in each experimental group. (C) Representative images of 8-OHdG (red) immunofluorescence and nuclei (blue) in the corpus callosum of mice in each experimental group (200×). Analysis was performed on both right/left sides (location of right region is demarcated area in Figure 2B). (D) 8-OHdG immunofluorescent density in the corpus callosum of mice in each experimental group. (E) Effect of single and joint nPM and BCAS exposure on nitrate concentrations in the whole brain of mice. General linear model with main effects for nPM, BCAS, nPM+BCAS interaction was used to calculate the synergy p-value. Exposure and BCAS p-values were calculated using the Tukey Kramer adjustment. Numbers are mean±standard error. Data represented as mean±standard error. Scale bars represent 50μm. Error bars represent standard error. Nitrite and nitrate: n=4 FA, 5 nPM, 4 FA+BCAS, 4 nPM+BCAS; 8-OHdG: n=8 FA, 8 nPM, 8 FA+BCAS, 7 nPM+BCAS. General linear model with main effects for nPM, BCAS, and nPM+BCAS interaction were used; pairwise comparisons used Tukey Kramer adjustment. Summary data is provided in Table 1. Note: 8-OHdG, 8-oxo-2’-deoxyguanosine; BCAS, bilateral carotid artery stenosis; FA, filtered air; nPM, nanoscale particulate matter. *p<0.05, **p0.01, ***p0.001, ****p0.0001.
Figure 6A is a Venn diagram depicting the entities comparison, including nanoscale particulate matter (analysis), filtered air plus bilateral carotid artery stenosis (analysis), and nanoscale particulate matter plus bilateral carotid artery stenosis (analysis). There are three circles. The circle on the left is labeled uppercase a, the circle on the right is labeled uppercase b, and the circle present below is labeled uppercase c. The intersection area is labeled, 0. Figure 6B is a heatmap, plotting Rho Family GTPase 3 and Paraoxonase 2 (y-axis) across filter, including W J 8, W J 9, W J 10, W J 11, W J 12, W J 13, and W J 14 and nanoscale particulate matter, including W J 22, W J 23, W J 24, W J 25, W J 26, W J 27, and W J 28. A scale depicting correlation ranges from negative 1.0 to 1.0 in increments of 0.09. A scale depicting expression ranges from low to high. Figure 6C is a heatmap, plotting c c l28, b m I 1, n h p 2, t m o d 1, c e p 83 o s, t b c 1 d 14, m b d 2, p p p 1c b, r f c 1, c d k 19, s t m n 4, f b x o 32, m a p 6 d 1, p e r 2, m I n d, r b m 12 b 2, d u s 2, a t I c, t a f 1 a, c o m t d 1, c 0 17158, p r r 3, l r r c16 b, m e g 3, t m c 4, h c n 3, m d n 1, g m 14827, m e d t t l 17, 3 f 2 4 r I k, p a x b p 1, a n k r d 24, 6 1 1 04r i k, z f p 57, s l c 1 a6, p o d x l2, j a g 2, s l c 7 a3, d I s p2, c d a, c o p r s, h r h 1, a t g1 6 1 2, t u b a 1 b, z f p 6 12, t u b b2a, s g s m1, c a m k1g, z b t b 4 6, vg f , c c t8, s u sd 2, and d o s (y-axis) across nanoscale particulate matter plus bilateral carotid artery stenosis, including W J 15, W J 17, W J 21, W J 19, W J 18, W J 16, W J 20 and filter, including W J 8, W J 12, W J 9, W J 14, W J 10, W J 11, and W J 13 (x-axis). A scale ranges from 1.0 to negative 1.0 in decrements of 0.09. A scale depicting correlation ranges from negative 1.0 to 1.0 in increments of 0.09. Figures 6D and 6E are bar graphs titled differential gene expression in nanoscale particulate matter and differential gene expression in filtered air plus bilateral carotid artery stenosis, plotting Paraoxonase 2, Rho Family GTPase 3, Paraoxonase 2, and Rho Family GTPase 3, and t c p r 4 and t c p r 4 (y-axis) across log of 2 fold change (relative to filtered air), ranging from negative 0.6 to 0.4 in increments of 0.2 and negative 1.0 to 0.5 in increments of 0.5 (x-axis) for Ribonucleic acid sequence and real-time polymerase chain reaction, respectively. Figure 6F is a bra graph titled differential gene expression in nanoscale particulate matter plus bilateral carotid artery stenosis, ranging from t m o d 1, c d k 19, f b x o 32, c d 200, v g f, t m o d 1, c d k 19, f b x o32, c d 200, and v g f (y-axis) across log of 2 fold change (relative to filtered air), ranging from negative 1.0 to 1.0 in increments of 0.5 (x-axis) for Ribonucleic acid sequence and real-time polymerase chain reaction. Figures 6G, 6H, and 6I are pathway analysis of nanoscale particulate matter, bilateral carotid artery stenosis group, and nanoscale particulate matter plus bilateral carotid artery stenosis, respectively. Figure 6J is a chart titled prediction legend displaying the following information: Up-regulated, down-regulated, predicted activation, and predicted inhibition are divided into two categories, namely, more extreme and less. Predicted relationship lists the following categories: leads to activation, leads to inhibition, findings inconsistent with state of downstream molecule, and effect not predicted.
Figure 6.
RNA-Seq and pathway analyses of mice exposed to nPM or FA with or without BCAS. (A–C) RNA-Seq analysis (Stringent false discovery rate q<0.05). No heat map is included for FA vs. FA+BCAS because only one gene, VPS 13c, demonstrated differential expression. (A) Venn diagram of overlapping gene expression between nPM, FA+BCAS, and nPM+BCAS. (B) Heat map for differential gene expression for FA vs. nPM. (C) Heat map for differential gene expression for FA vs. nPM+BCAS. (D–F) qPCR validation of a subset of genes from RNA-Seq. GAPDH is used as a reference. Data represented as mean±standard error. (G–J) Pathway analysis. (G) Pathway analysis for the nPM group (H) Pathway analysis for the BCAS group (I) Pathway analysis for the nPM+BCAS group. (J) Prediction legend. n=7 FA, 7 nPM, 7 FA+BCAS, and 7 nPM+BCAS for qPCR and RNA-Seq analyses. Summary data is provided in Tables S7–S9, S11. qPCR summary data is provided in Table S10. Pathway analyses (G–J) were generated through the use of QIAGEN’s Ingenuity Pathway Analysis (https://www.qiagenbioinformatics.com/products/ingenuitypathway-analysis; Krämer et al. 2014). Note: BCAS, bilateral carotid artery stenosis; FA, filtered air; nPM, nanoscale particulate matter; qPCR, quantitative real-time polymerase chain reaction; RNA-Seq, ribonucleic acid sequencing.
Figures 7A, 7B, 7C, 7D, 7E, and 7F are line graphs. Figures 7A, 7B, and 7C are titled radical maze revisiting errors and Figures 7D, 7E, and 7F are titled radial maze novel entries. The graph plots Revisiting Errors, ranging from 0 to 20 in increments of 5; Revisiting Errors, ranging from 0 to 10 in increments of 5; Revisiting Errors, ranging from 0 to 20 in increments of 5; Novel Entries, ranging from 4 to 7 in unit increments; Novel Entries, ranging from 4.0 to 6.0 in increments of 0.5; and Novel Entries, ranging from 3 to 7 in unit increments (y-axis) across 2 blocked trials (Mean plus or minus standard error of the mean), ranging from 0 to 8 in increments of 2; 0 to 10 in increments of 2; 0 to 10 in increments of 2; 0 to 10 in increments of 2; and 0 to 10 in increments of 2 (x-axis) for Filtered Air and Nanoscale Particulate Matter; Filtered Air plus bilateral carotid artery stenosis and nanoscale particulate matter plus bilateral carotid artery stenosis; Filtered Air, Nanoscale Particulate Matter, Filtered Air plus bilateral carotid artery stenosis, and nanoscale particulate matter plus bilateral carotid artery stenosis; Filtered Air and Nanoscale Particulate Matter; Filtered Air plus bilateral carotid artery stenosis and nanoscale particulate matter plus bilateral carotid artery stenosis; and Filtered Air, Nanoscale Particulate Matter, Filtered Air plus bilateral carotid artery stenosis, and nanoscale particulate matter plus bilateral carotid artery stenosis, respectively. Figures 7G and 7H are bar graphs, plotting Discrimination Index (percentage), ranging from 0 to 100 in increments of 20 (y-axis) across Filtered Air, Nanoscale Particulate Matter, Filtered Air plus bilateral carotid artery stenosis, and nanoscale particulate matter plus bilateral carotid artery stenosis (x-axis) for short-term Novel Object Recognition and long-term Novel Object Recognition.
Figure 7.
Behavioral analyses of mice exposed to nPM or FA with or without BCAS. (A–C) Radial maze revisiting errors in mice exposed to nPM or FA with or without BCAS. (D–F) Radial maze novel entries in mice exposed to nPM or FA with or without BCAS. (G) Short-term NOR discrimination index in mice exposed to nPM or FA with or without BCAS. (H) Long-term NOR discrimination index in mice exposed to nPM or FA with or without BCAS. Data represented as mean±standard error. n=12 FA, 12 nPM, 12 FA+BCAS, 12 nPM+BCAS. (A–F) General linear model with main effects for nPM, BCAS, nPM+BCAS interaction were used; pairwise comparisons used Tukey Kramer adjustment. (E–F) For the 8-arm radial maze, a mixed effects repeated measures model (8 averaged blocked trial) was used to analyze: differences among the four groups (one-factor model), and main effects for nPM, BCAS and the nPM+BCAS interaction (two-factor model). Mean slope (behavior outcome over trials) was analyzed using a linear mixed effects model with main effects for nPM, BCAS, and the nPM+BCAS interaction, modeling trial as a continuous variable. Summary data is provided in Table 1. Note: BCAS, bilateral carotid artery stenosis; FA, filtered air; NOR, novel object recognition; nPM, nanoscale particulate matter. *p<0.05, **p0.01, ***p0.001, ****p0.0001.

Comment in

References

    1. Allen JL, Oberdorster G, Morris-Schaffer K, Wong C, Klocke C, Sobolewski M, et al. . 2017. Developmental neurotoxicity of inhaled ambient ultrafine particle air pollution: parallels with neuropathological and behavioral features of autism and other neurodevelopmental disorders. Neurotoxicology 59:140–154, PMID: , 10.1016/j.neuro.2015.12.014. - DOI - PMC - PubMed
    1. Altuwayjiri A, Pirhadi M, Taghvaee S, Sioutas C. 2021. Long-term trends in the contribution of pm(2.5) sources to organic carbon (OC) in the Los Angeles basin and the effect of PM emission regulations. Faraday Discuss 226:74–99, PMID: , 10.1039/D0FD00074D. - DOI - PubMed
    1. Babadjouni R, Patel A, Liu Q, Shkirkova K, Lamorie-Foote K, Connor M, et al. . 2018. Nanoparticulate matter exposure results in neuroinflammatory changes in the corpus callosum. PLoS One 13(11):e0206934, PMID: , 10.1371/journal.pone.0206934. - DOI - PMC - PubMed
    1. Benedictus MR, Binnewijzend MAA, Kuijer JPA, Steenwijk MD, Versteeg A, Vrenken H, et al. . 2014. Brain volume and white matter hyperintensities as determinants of cerebral blood flow in Alzheimer’s disease. Neurobiology of Aging 35(12):2665–2670, PMID: , 10.1016/j.neurobiolaging.2014.06.001. - DOI - PubMed
    1. Bevins RA, Besheer J. 2006. Object recognition in rats and mice: a one-trial non-matching-to-sample learning task to study ’recognition memory’. Nat Protoc 1(3):1306–1311, PMID: , 10.1038/nprot.2006.205. - DOI - PubMed

Publication types

Substances

LinkOut - more resources