

The prevalence of mental disorders among homeless people in high-income countries: An updated systematic review and meta-regression analysis
- PMID: 34424908
- PMCID: PMC8423293
- DOI: 10.1371/journal.pmed.1003750
The prevalence of mental disorders among homeless people in high-income countries: An updated systematic review and meta-regression analysis
Abstract
Background: Homelessness continues to be a pressing public health concern in many countries, and mental disorders in homeless persons contribute to their high rates of morbidity and mortality. Many primary studies have estimated prevalence rates for mental disorders in homeless individuals. We conducted a systematic review and meta-analysis of studies on the prevalence of any mental disorder and major psychiatric diagnoses in clearly defined homeless populations in any high-income country.
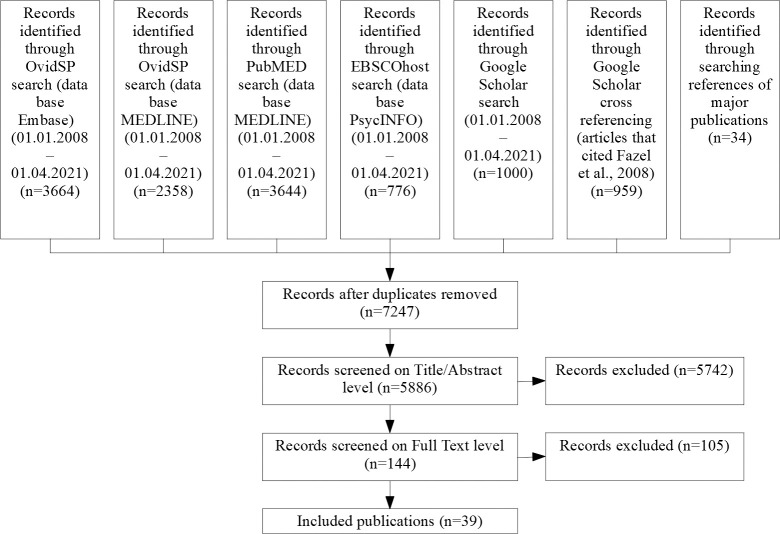
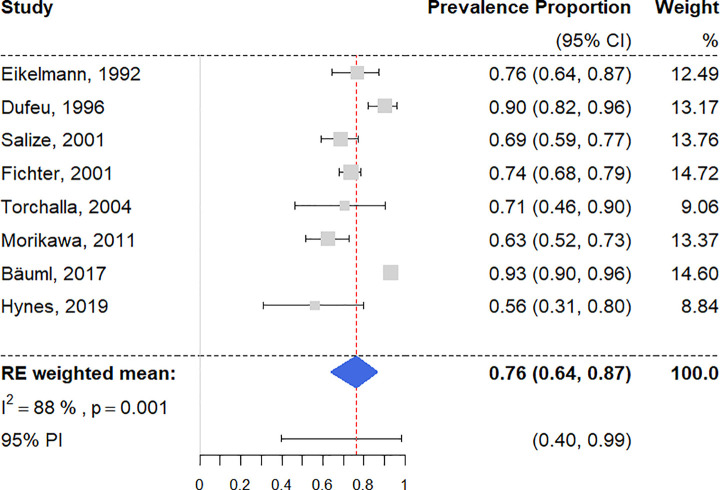
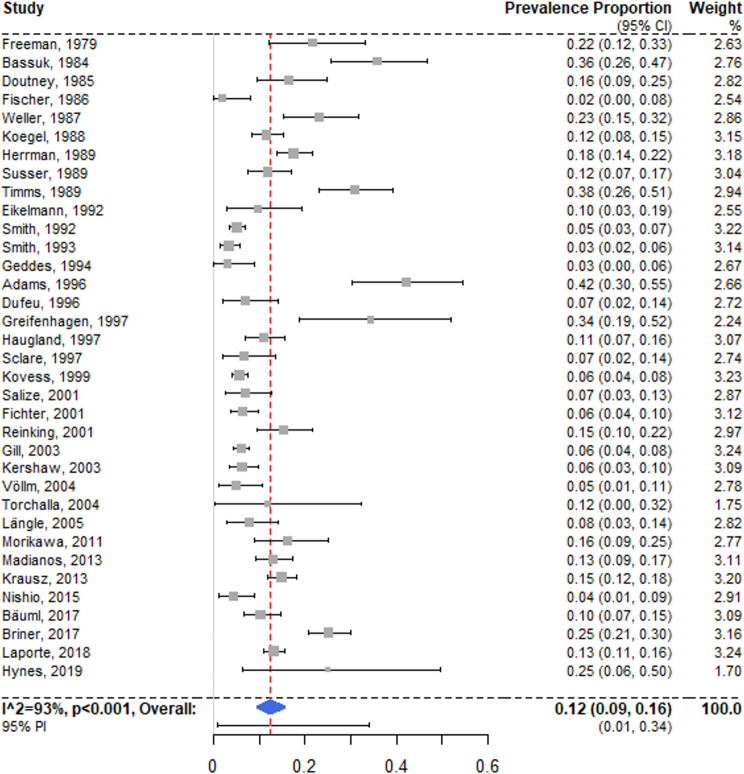
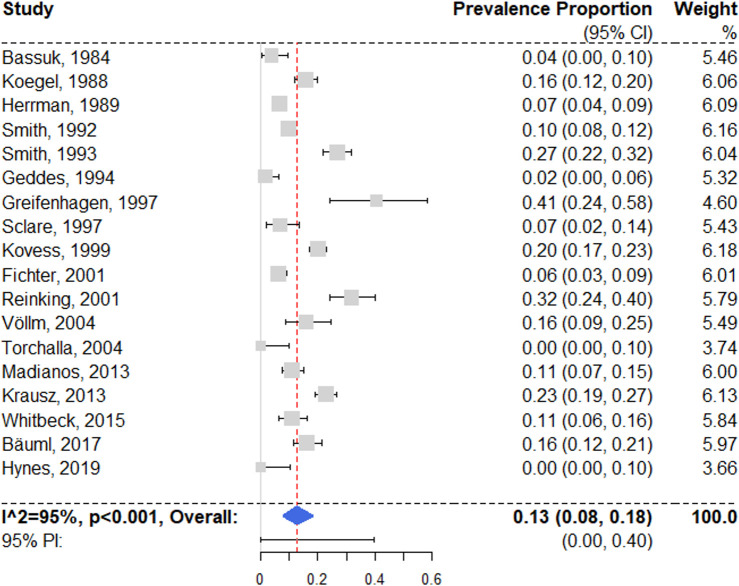
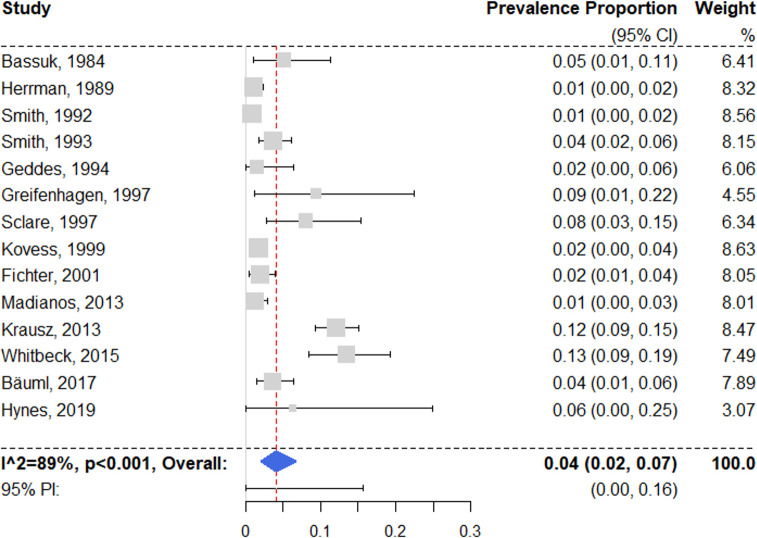
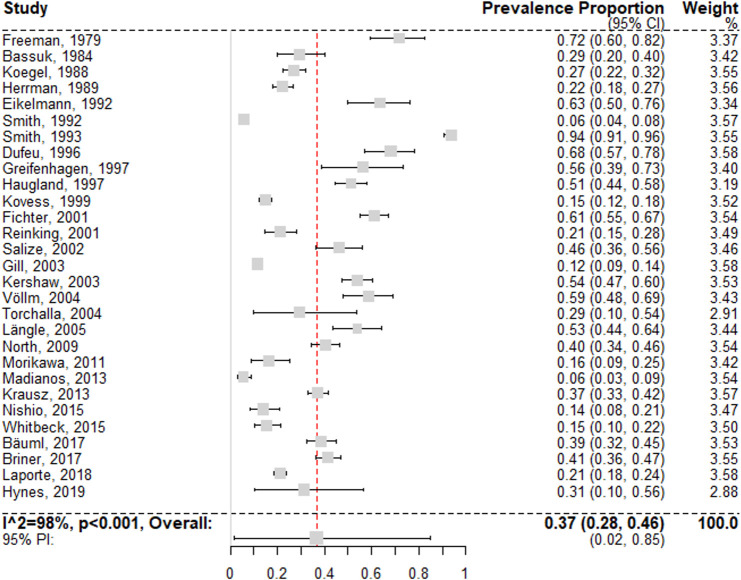
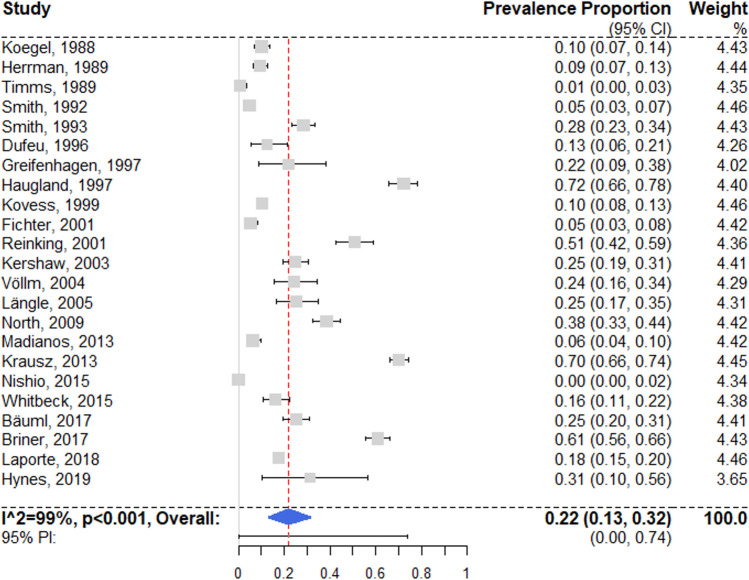
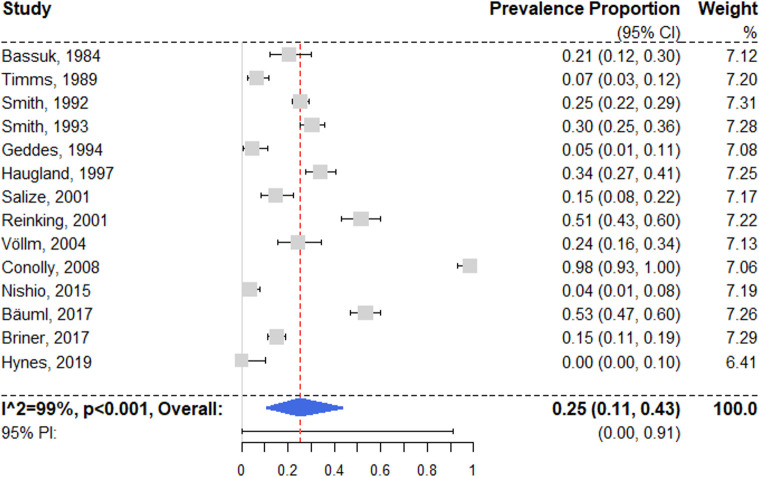
Methods and findings: We systematically searched for observational studies that estimated prevalence rates of mental disorders in samples of homeless individuals, using Medline, Embase, PsycInfo, and Google Scholar. We updated a previous systematic review and meta-analysis conducted in 2007, and searched until 1 April 2021. Studies were included if they sampled exclusively homeless persons, diagnosed mental disorders by standardized criteria using validated methods, provided point or up to 12-month prevalence rates, and were conducted in high-income countries. We identified 39 publications with a total of 8,049 participants. Study quality was assessed using the JBI critical appraisal tool for prevalence studies and a risk of bias tool. Random effects meta-analyses of prevalence rates were conducted, and heterogeneity was assessed by meta-regression analyses. The mean prevalence of any current mental disorder was estimated at 76.2% (95% CI 64.0% to 86.6%). The most common diagnostic categories were alcohol use disorders, at 36.7% (95% CI 27.7% to 46.2%), and drug use disorders, at 21.7% (95% CI 13.1% to 31.7%), followed by schizophrenia spectrum disorders (12.4% [95% CI 9.5% to 15.7%]) and major depression (12.6% [95% CI 8.0% to 18.2%]). We found substantial heterogeneity in prevalence rates between studies, which was partially explained by sampling method, study location, and the sex distribution of participants. Limitations included lack of information on certain subpopulations (e.g., women and immigrants) and unmet healthcare needs.
Conclusions: Public health and policy interventions to improve the health of homeless persons should consider the pattern and extent of psychiatric morbidity. Our findings suggest that the burden of psychiatric morbidity in homeless persons is substantial, and should lead to regular reviews of how healthcare services assess, treat, and follow up homeless people. The high burden of substance use disorders and schizophrenia spectrum disorders need particular attention in service development. This systematic review and meta-analysis has been registered with PROSPERO (CRD42018085216).
Trial registration: PROSPERO CRD42018085216.
Conflict of interest statement
The authors have declared that no competing interests exist.
Figures
References
-
- United Nations Commission for Social Development. Affordable housing and social protection systems for all to address homelessness. Report of the Secretary-General. E/CN.5/2020/3. New York: United Nations Commission for Social Development; 2019Nov27 [cited 2020 May 10]. Available from: https://undocs.org/en/E/CN.5/2020/3.
-
- Directorate of Employment, Labour and Social Affairs. HC3.1 Homeless population. Paris: Organisation for Economic Co-operation and Development; 2020. [cited 2020 May 3]. Available from: https://www.oecd.org/els/family/HC3-1-Homeless-population.pdf.
-
- Henry M, Mahathey A, Morrill T, Robinson A, Shivji A, Watt R. The 2018 Annual Homeless Assessment Report (AHAR) to Congress. Part 1: point-in-time estimates of homelessness. Washington (DC): US Department of Housing and Urban Development; 2018Dec [cited 2020 May 10]. Available from: https://www.huduser.gov/portal/sites/default/files/pdf/2018-AHAR-Part-1.pdf.
Publication types
MeSH terms
Grants and funding
LinkOut - more resources
Full Text Sources
Medical
Miscellaneous
