. 2021 Oct 28;138(17):1570-1582.
doi: 10.1182/blood.2021012052.

Insertion of atypical glycans into the tumor antigen-binding site identifies DLBCLs with distinct origin and behavior

Affiliations

Insertion of atypical glycans into the tumor antigen-binding site identifies DLBCLs with distinct origin and behavior

Giorgia Chiodin et al. Blood. .

Abstract

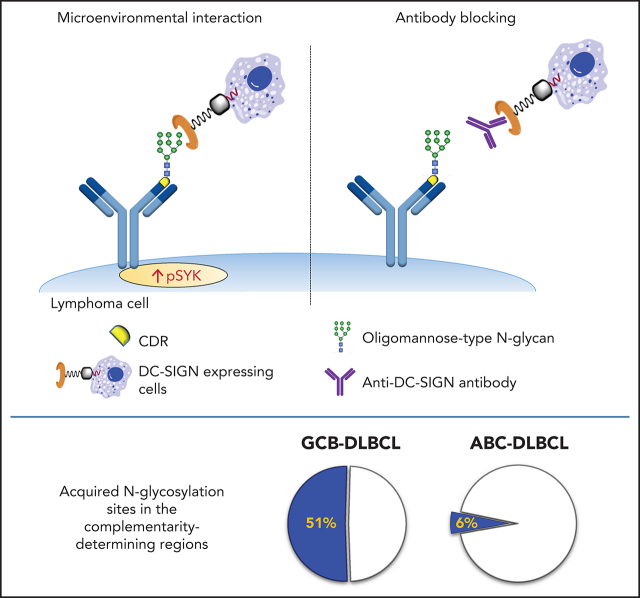
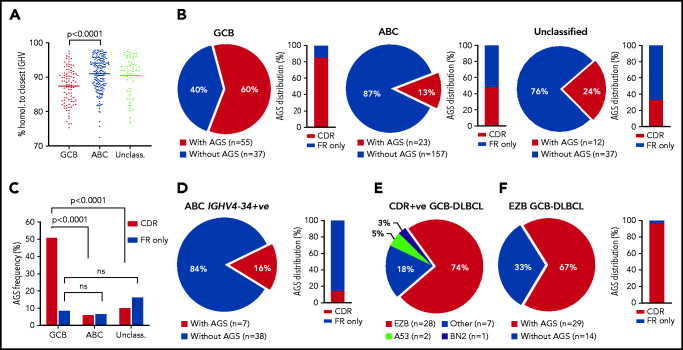
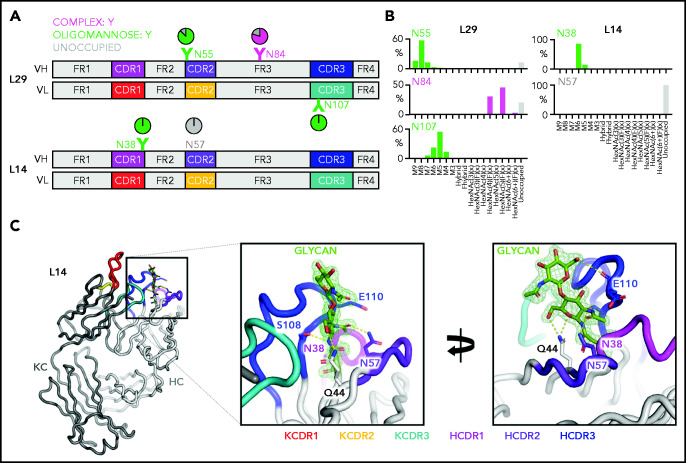
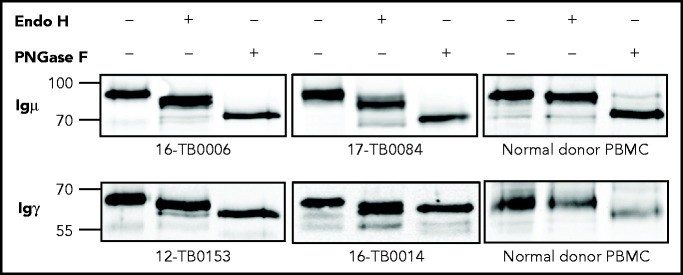
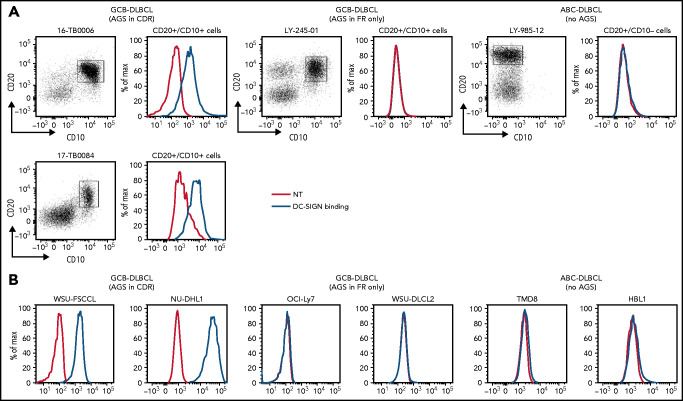
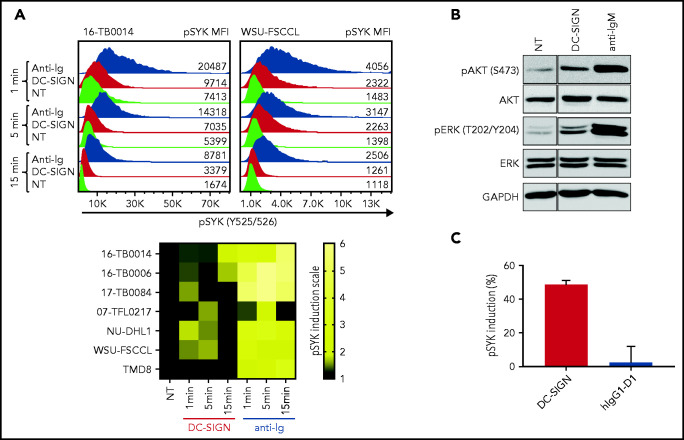
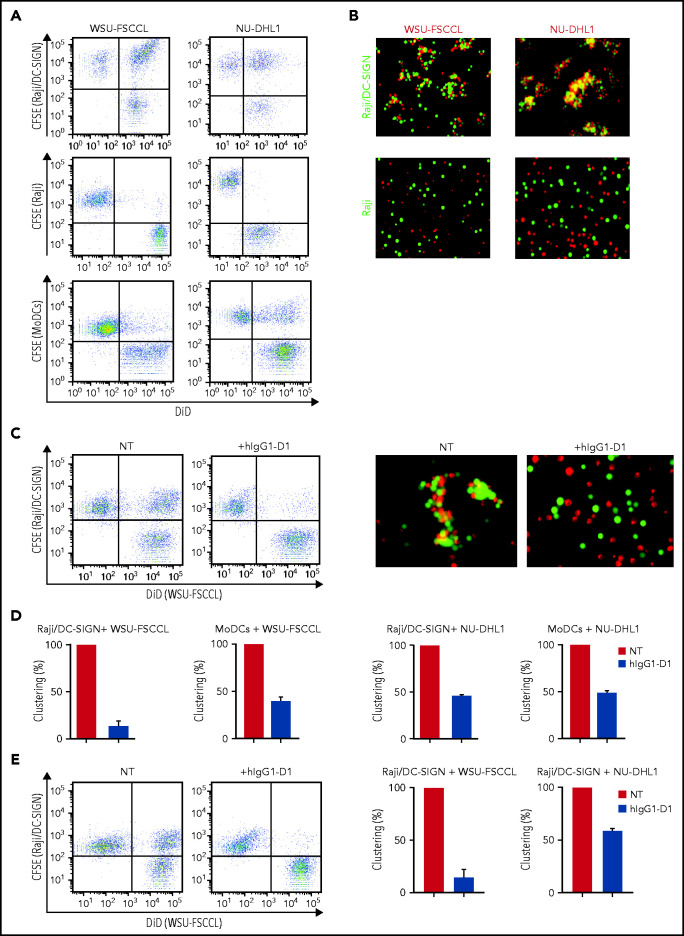
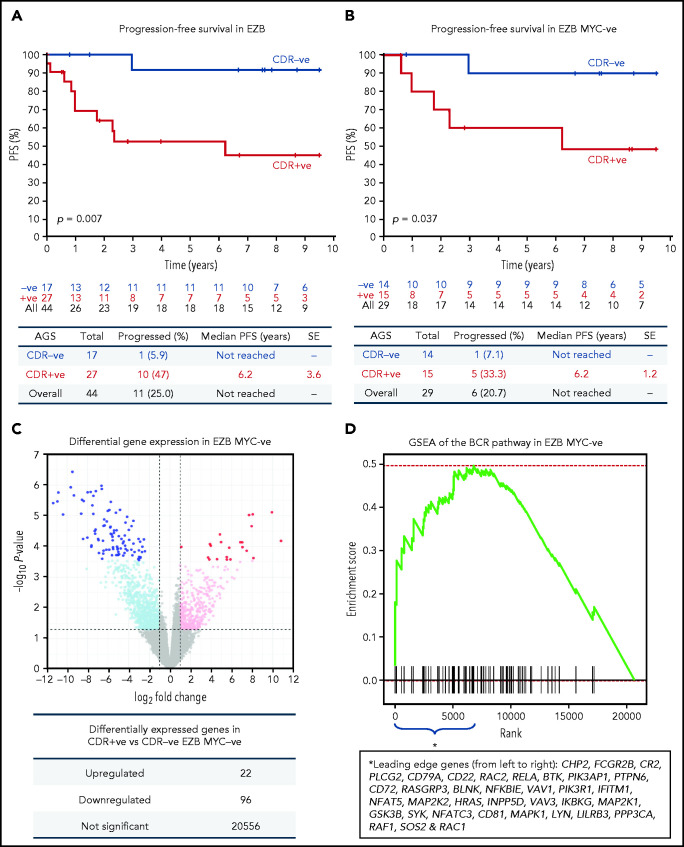
Glycosylation of the surface immunoglobulin (Ig) variable region is a remarkable follicular lymphoma-associated feature rarely seen in normal B cells. Here, we define a subset of diffuse large B-cell lymphomas (DLBCLs) that acquire N-glycosylation sites selectively in the Ig complementarity-determining regions (CDRs) of the antigen-binding sites. Mass spectrometry and X-ray crystallography demonstrate how the inserted glycans are stalled at oligomannose-type structures because they are buried in the CDR loops. Acquisition of sites occurs in ∼50% of germinal-center B-cell-like DLBCL (GCB-DLBCL), mainly of the genetic EZB subtype, irrespective of IGHV-D-J use. This markedly contrasts with the activated B-cell-like DLBCL Ig, which rarely has sites in the CDR and does not seem to acquire oligomannose-type structures. Acquisition of CDR-located acceptor sites associates with mutations of epigenetic regulators and BCL2 translocations, indicating an origin shared with follicular lymphoma. Within the EZB subtype, these sites are associated with more rapid disease progression and with significant gene set enrichment of the B-cell receptor, PI3K/AKT/MTORC1 pathway, glucose metabolism, and MYC signaling pathways, particularly in the fraction devoid of MYC translocations. The oligomannose-type glycans on the lymphoma cells interact with the candidate lectin dendritic cell-specific intercellular adhesion molecule 3 grabbing non-integrin (DC-SIGN), mediating low-level signals, and lectin-expressing cells form clusters with lymphoma cells. Both clustering and signaling are inhibited by antibodies specifically targeting the DC-SIGN carbohydrate recognition domain. Oligomannosylation of the tumor Ig is a posttranslational modification that readily identifies a distinct GCB-DLBCL category with more aggressive clinical behavior, and it could be a potential precise therapeutic target via antibody-mediated inhibition of the tumor Ig interaction with DC-SIGN-expressing M2-polarized macrophages.


Figures

None
Graphical abstract
Figure 1.
Figure 1.
Frequency and location of AGSs in the Ig heavy chain variable region of DLBCL subsets. Tumor IGHV-IGHD-IGHJ-IGHC rearrangements from primary DLBCL cases were analyzed according to the IMGT/V-QUEST numbering system, and NxS/T motifs acquired by somatic hypermutation (AGSs) were identified. The pie charts show the frequency of rearrangements with at least 1 AGS or no AGSs. Bar charts identify the percentage of rearrangements with sites containing at least 1 AGS in the CDR or AGSs in the FR only . (A) Homology (%) of the tumor IGHV transcript sequence to the closest germline sequence in GCB-, ABC- and unclassified DLBCLs. Horizontal bars indicate the mean. (B) Frequency of rearrangements with AGSs (pie charts) and their distribution in the CDR or FR only (bar charts), divided by COO subset (GCB-, ABC- and unclassified DLBCLs). (C) Frequency of rearrangements with AGSs in the CDR or the FR only relative to the total number of GCB-, ABC- and unclassified DLBCLs. (D) Frequency of rearrangements with AGSs (pie chart) and their distribution in the CDR or FR only (bar chart) in the ABC-DLBCL using IGHV4-34. (E) Distribution of genetic subtypes (according to LymphGen algorithm) within GCB-DLBCL having acquired sites in the CDR. (F) Frequency of rearrangements with AGSs (pie chart) and their percent distribution in the CDR or FR only (bar chart) in GCB-DLBCLs assigned to the EZB genetic subtype according to the LymphGen algorithm. +ve, positive; ns, not significant.
Figure 2.
Figure 2.
Glycan composition and structure of the lymphoma-derived Fabs. Determination of the crystal structure of L14 and glycan analysis of Fabs L14 and L29 that have N-glycan sites in both the CDR loops and the FR. (A) Schematic representation of the Ig variable heavy (H) and kappa light (κ) chain pairs of L29 and L14 displaying the location of the AGSs and of the natural N57 glycosylation site. Sites are numbered according to the IMGT/V-QUEST numbering system. Distribution of each site is represented relative to CDR or FR and colored by predominant glycan composition. Pie charts are colored according to the proportion of oligomannose-type glycans, processed complex-type glycans, and no glycans at each site. At least 1 CDR AGS is always occupied by glycans terminating at oligomannose-type in both L14 and L29, whereas the site in FR3 of L29 is predominantly but not always occupied by complex glycans. (B) Site-specific glycan compositions detected for L29 and L14 as determined by liquid chromatography-mass spectrometry. Bars represent the relative abundance of each category of glycan. Oligomannose-type (green) glycans are categorized according to the number of mannose residues (M9-M5), hybrids by the presence/absence of fucose (F), and complex-type glycans (magenta) according to the number of N-acetyl hexosamine structures detected (HexNAc) and the presence or absence of fucose. The proportion of AGSs without a glycan attached is shown as a gray bar. (C) Structure of the L14 Fab at 1.65 Å resolution. The Ig heavy chain (HC) is light gray and the Ig κ light chain (KC) is dark gray. CDR loops are shown: KCDR1 (red), KCDR2 (yellow), KCDR3 (light blue), HCDR1 (magenta), HCDR2 (purple), and HCDR3 (blue). The amino acids Q44, N57, and E110 that interact with the glycan at position N38 are shown as sticks. Their carbon atoms are colored according to the CDR on which they are present, whereas their oxygen atoms are red and their nitrogen atoms are blue. The 2 resolved GlcNAc residues at N38 are colored by atom with carbon in green, oxygen in red, and nitrogen in blue. Atoms likely to form electrostatic interactions with the N38 glycan are shown as dashed yellow lines. The representation in the left panel is rotated by 100° on the y-axis and 20° on the x-axis in the right panel to visualize the contacts of the glycan to itself and to the protein. Maximum likelihood-weighted 2Fo-Fc electron density obtained for the glycan at N38 is shown (green mesh).
Figure 3.
Figure 3.
N-linked mannoses in the antigen-binding site of GCB-DLBCL are susceptible to treatment with Endo H. The glycosylation patterns of GCB-DLBCL primary samples (known to have AGSs in the CDRs) and peripheral blood mononuclear cells (PBMCs) from healthy donors were analyzed by digestion with Endo H (which cleaves mannose only) or PNGase F (which removes all glycans) after biotinylation and isolation of the cell surface proteins. Primary anti-µ or anti-γ antibodies were used to detect the surface Igµ (16-TB0006 and 17-TB0084 primary samples) or Igγ heavy chains (12-TB0153 and 16-TB0014) by immunoblotting, respectively. Numbers on the left of each gel indicate the molecular weight in kD of the reference ladder. The characteristics of the primary samples are described in supplemental Table 6. The glycosylation pattern of DLBCL cell lines with or without AGS in the CDR is shown in supplemental Figure 4.
Figure 4.
Figure 4.
DC-SIGN binds specifically to the sIg-Mann GCB-DLBCL cells. Binding of recombinant DC-SIGN was analyzed in primary samples and DLBCL cell lines by flow cytometry after incubation with fluorescein isothiocyanate (FITC)-conjugated anti-Fc antibody. Blue lines represent binding of DC-SIGN, red lines represent binding of the secondary antibody in the untreated control. (A) DC-SIGN binding to the clonal CD20+/CD10+ of GCB-DLBCL primary samples or CD20+/CD10 ABC-DLBCL tumor population primary samples. (B) DC-SIGN binding in GCB-DLBCL (with AGSs in the CDR or in the FR only) and ABC-DLBCL cell lines (not having AGSs). Supplemental Tables 6 and 7 show the intensity of DC-SIGN binding to the primary samples and cell lines. NT, untreated.
Figure 5.
Figure 5.
DC-SIGN mediates low-level antigen-independent signaling in sIg-Mann+ cells. (A) The histograms show SYK phosphorylation at Y525/526 in a representative sIg-Mann+ primary sample (16-TB0014) and in the WSU-FSCCL cell line after stimulation with DC-SIGN (red), anti-Ig (blue), or no treatment (green) (top). Geometric mean fluorescence intensity (MFI) levels of pSYK are shown for each condition. Heat-map of DC-SIGN–mediated and anti-Ig–mediated signaling in all cell lines and primary samples analyzed at 1, 5, and 15 minutes. MFI of pSYK after stimulation was normalized with pSYK MFI of the untreated (NT) sample at the respective time point (NT sample was normalized to 1) (bottom). The statistical difference between DC-SIGN and anti-Ig stimulation was significant at each time point (P = .03; Wilcoxon signed-rank test). (B) Immunoblotting of AKT phosphorylation at S473 and ERK phosphorylation at T202/Y204 in the primary DLBCL sample 17-TB0084 after exposure to DC-SIGN or anti-IgM or left untreated (NT) for 15 minutes. Glyceraldehyde-3-phosphate dehydrogenase (GAPDH) was used as the loading control. (C) Soluble recombinant DC-SIGN was incubated with 500 nM hIgG1-D1 before treating NU-DHL1 cells. Phosphorylation of SYK at Y525/526 was measured by flow cytometry. Data are represented as the mean ± standard error of the mean (SEM) of 3 independent experiments. Supplemental Tables 6 and 7 provide sIg characteristics and DC-SIGN binding of the primary samples and cell lines.
Figure 6.
Figure 6.
The specific interaction of sIg-Mann+ lymphoma cells and DC-SIGN–expressing cells. (A-B) sIg-Mann+ lymphoma cells form clusters round DC-SIGN–expressing cells. (A) Flow cytometry analysis of clustering between sIg-Mann+ DLBCL lines (WSU-FSCCL or NU-DHL1) and Raji/DC-SIGN cells (top), parental Raji cells (middle), or MoDCs (bottom). (B) Inverted fluorescence microscopy images of clustering between sIg-Mann+ DLBCL lines (WSU-FSCCL or NU-DHL1) and either Raji/DC-SIGN (top) or Raji cells (bottom). (C-E) The interaction of sIg-Mann+ lymphoma cells and DC-SIGN–expressing cells is specifically inhibited or interrupted by the anti-DC-SIGN antibody hIgG1-D1. (C-D) Raji/DC-SIGN or MoDCs were treated with 10 nM hIgG1-D1 or left untreated (NT), before coculture with WSU-FSCCL or NU-DHL1. (C) Clustering of WSU-FSCCL with Raji/DC-SIGN was determined by flow cytometry (left) and inverted fluorescence microscopy (right). (D) Percent of clustering, as determined by flow cytometry in the presence or absence of hIgG1-D1 was calculated as (double-positive population) × 2/(2 × double-positive population + single-positive carboxyfluorescein diacetate succinimidyl ester (CFSE) + single-positive DiD). (E) Raji/DC-SIGN cells were cultured with WSU-FSCCL or NU-DHL1 for 30 minutes. HIgG1-D1 (10 nM) or medium (NT) was subsequently added to the coculture, and clustering was measured after 2 hours by flow cytometry. Clustering with WSU-FSCCL is shown. Data are represented as mean ± SEM of at least 2 independent experiments.
Figure 7.
Figure 7.
Progression-free survival and gene expression profile of EZB lymphomas acquiring N-glycosylation sites in the CDR. (A-B) Progression-free survival (PFS) was determined by the Kaplan-Meier method using log-rank statistics. The number of patients at risk is indicated in blue (CDR) or in red (CDR+) at each time point (years). (A) PFS in EZB GCB-DLBCL with N-glycosylation sites acquired in the CDR of the tumor Ig (CDR+) or not (CDR). (B) PFS in CDR+ and CDR EZB GCB-DLBCL without MYC translocation (EZB MYC). (C-D) Differential gene expression and BCR gene set enrichment in CDR+ compared with CDR EZB MYC DLBCL. (C) Each point represents a gene and the fold change and P value for differential expression in CDR+ vs CDR EZB MYC DLBCL. CDR+ had higher expression of positive log2 fold changes, and CDR had higher expression of negative log2 fold changes. Gray points were not differentially expressed genes. Light blue and magenta points were differentially expressed at P = .05, whereas blue and red points were differentially expressed at false discovery rate of 0.05 after controlling for multiple testing (Benjamini-Hochberg procedure). (D) Gene set enrichment analysis (GSEA) plot showing the enrichment of BCR signaling pathway genes in the log2 fold change ranked genes for CDR+ vs CDR. Enrichment of the BCR pathway toward the beginning of the ranked list indicated that the BCR pathway was enriched in genes more highly expressed in CDR+ than in CDR EZB MYC. Leading-edge genes (ie, those observed on the left edge of the green curve) in the BCR pathway are listed in the same order as they appear on the x-axis.

Comment in

References

    1. Alizadeh AA, Eisen MB, Davis RE, et al. . Distinct types of diffuse large B-cell lymphoma identified by gene expression profiling. Nature. 2000;403(6769): 503-511. - PubMed
    1. Rosenwald A, Wright G, Chan WC, et al. ; Lymphoma/Leukemia Molecular Profiling Project . The use of molecular profiling to predict survival after chemotherapy for diffuse large-B-cell lymphoma. N Engl J Med. 2002;346(25):1937-1947. - PubMed
    1. Wright GW, Huang DW, Phelan JD, et al. . A probabilistic classification tool for genetic subtypes of diffuse large B cell lymphoma with therapeutic implications. Cancer Cell. 2020;37(4):551-568.e14. - PMC - PubMed
    1. Pasqualucci L, Dalla-Favera R. Genetics of diffuse large B-cell lymphoma. Blood. 2018;131(21):2307-2319. - PMC - PubMed
    1. Green MR, Kihira S, Liu CL, et al. . Mutations in early follicular lymphoma progenitors are associated with suppressed antigen presentation. Proc Natl Acad Sci U S A. 2015;112(10):E1116-E1125. - PMC - PubMed

Publication types

MeSH terms

Substances