. 2021 Dec:37:100487.
doi: 10.1016/j.epidem.2021.100487. Epub 2021 Aug 16.

Impacts of K-12 school reopening on the COVID-19 epidemic in Indiana, USA

Affiliations

Impacts of K-12 school reopening on the COVID-19 epidemic in Indiana, USA

Guido España et al. Epidemics. 2021 Dec.

Abstract

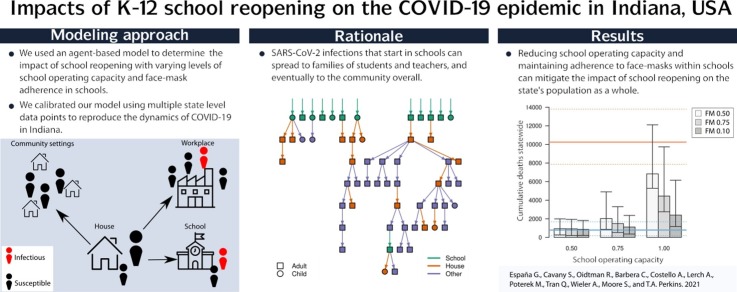
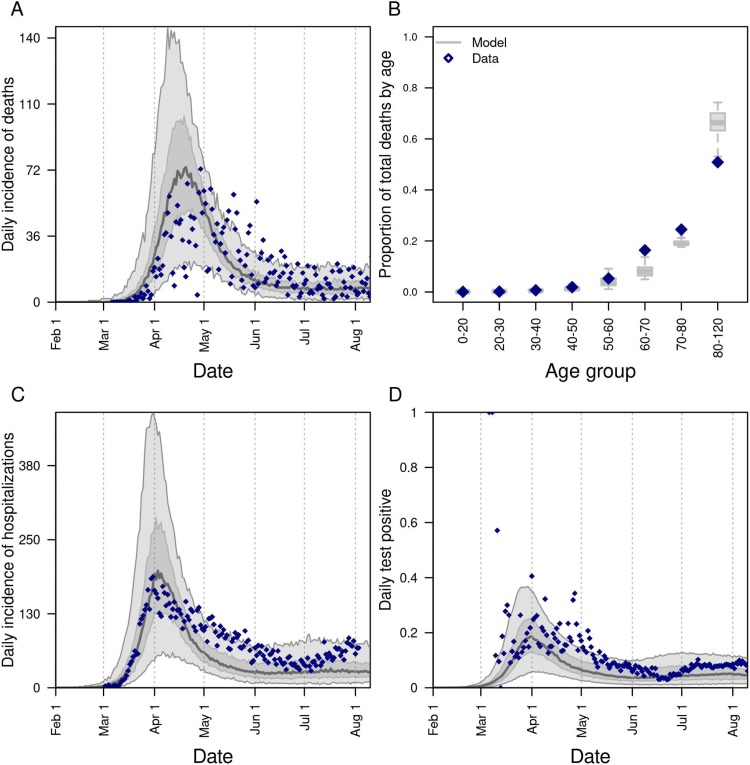
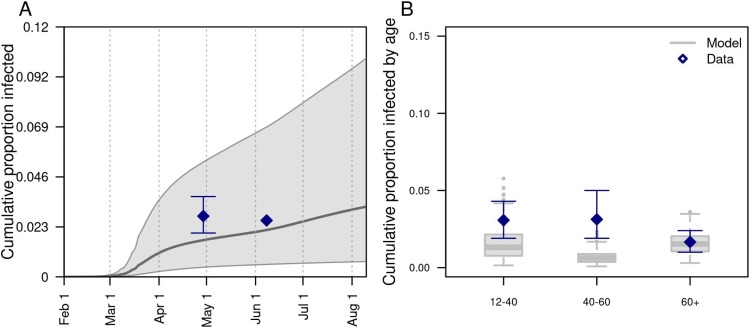
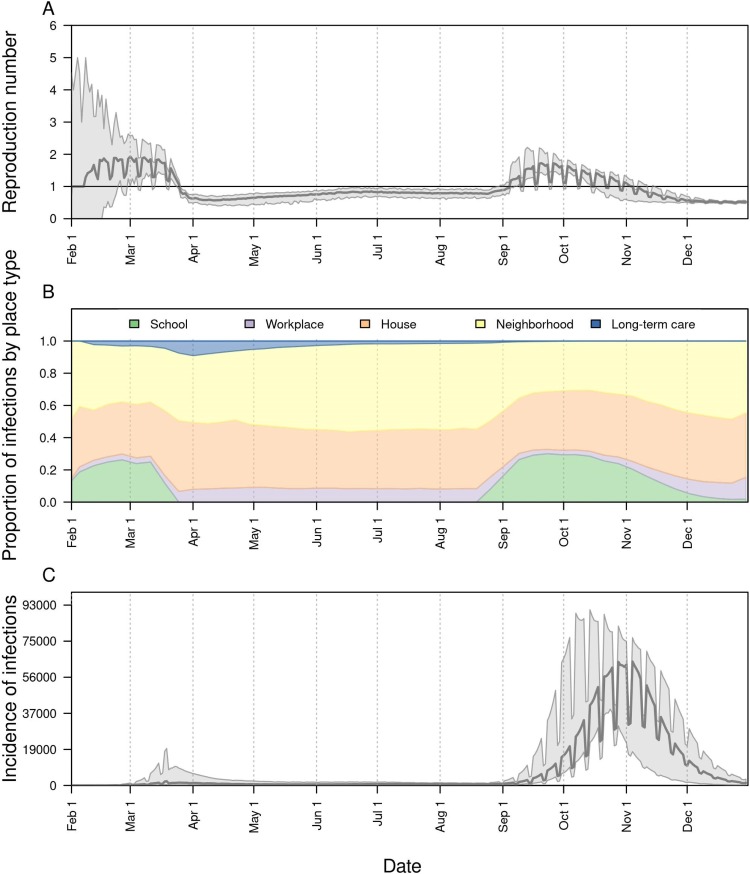
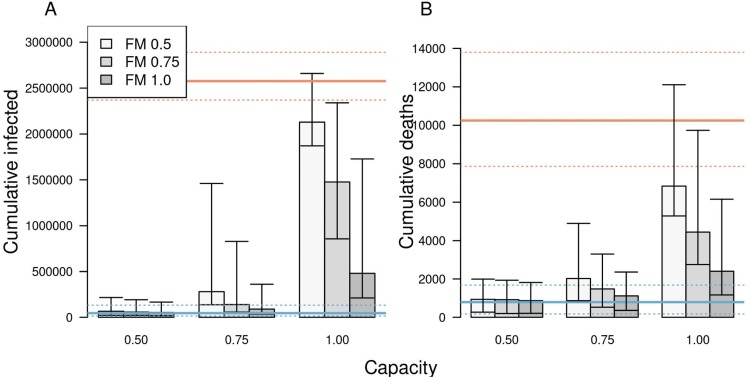
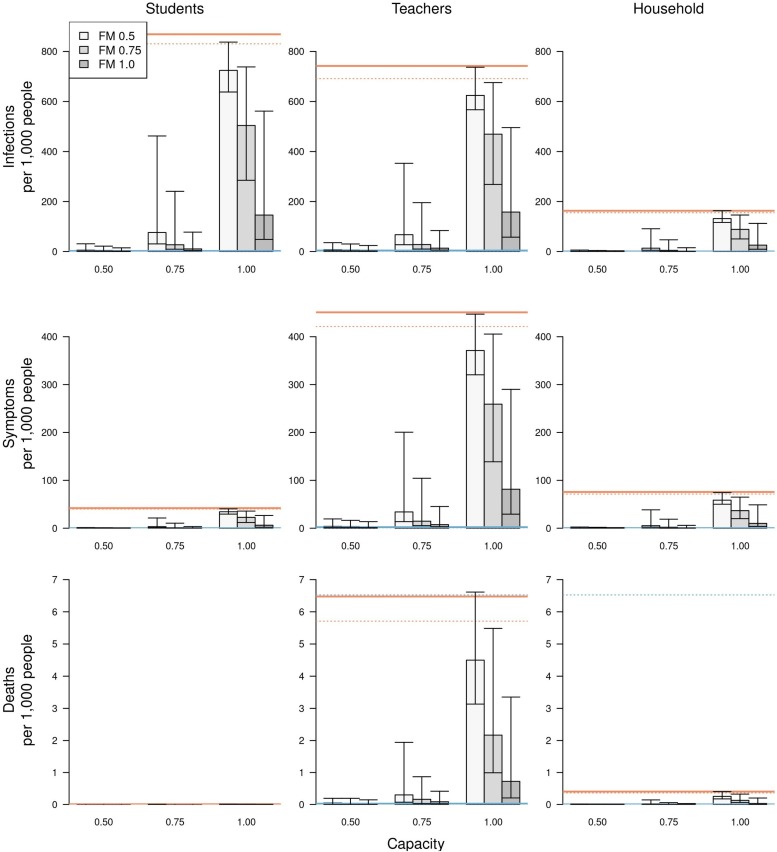
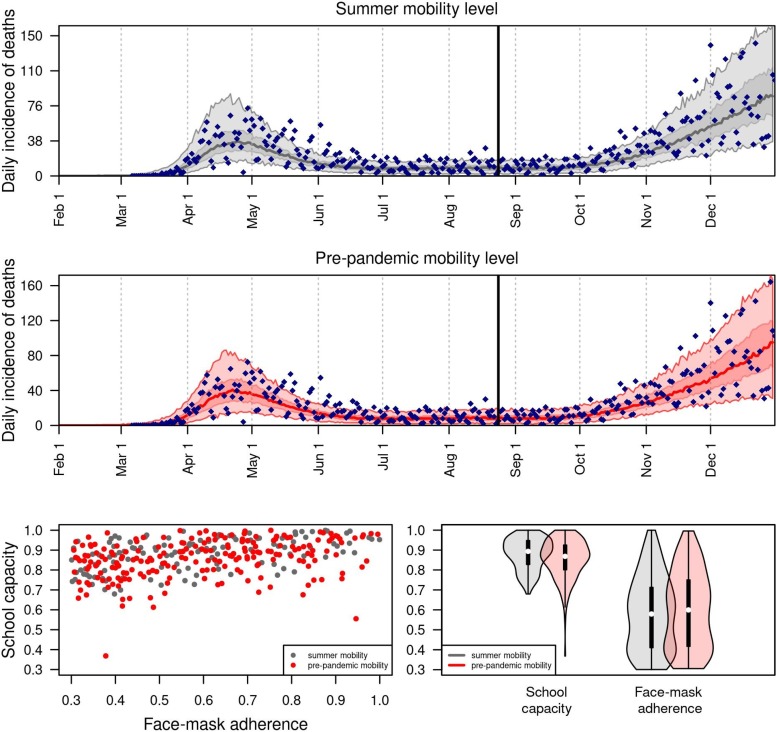
In the United States, schools closed in March 2020 due to COVID-19 and began reopening in August 2020, despite continuing transmission of SARS-CoV-2. In states where in-person instruction resumed at that time, two major unknowns were the capacity at which schools would operate, which depended on the proportion of families opting for remote instruction, and adherence to face-mask requirements in schools, which depended on cooperation from students and enforcement by schools. To determine the impact of these conditions on the statewide burden of COVID-19 in Indiana, we used an agent-based model calibrated to and validated against multiple data types. Using this model, we quantified the burden of COVID-19 on K-12 students, teachers, their families, and the general population under alternative scenarios spanning three levels of school operating capacity (50 %, 75 %, and 100 %) and three levels of face-mask adherence in schools (50 %, 75 %, and 100 %). Under a scenario in which schools operated remotely, we projected 45,579 (95 % CrI: 14,109-132,546) infections and 790 (95 % CrI: 176-1680) deaths statewide between August 24 and December 31. Reopening at 100 % capacity with 50 % face-mask adherence in schools resulted in a proportional increase of 42.9 (95 % CrI: 41.3-44.3) and 9.2 (95 % CrI: 8.9-9.5) times that number of infections and deaths, respectively. In contrast, our results showed that at 50 % capacity with 100 % face-mask adherence, the number of infections and deaths were 22 % (95 % CrI: 16 %-28 %) and 11 % (95 % CrI: 5 %-18 %) higher than the scenario in which schools operated remotely. Within this range of possibilities, we found that high levels of school operating capacity (80-95 %) and intermediate levels of face-mask adherence (40-70 %) resulted in model behavior most consistent with observed data. Together, these results underscore the importance of precautions taken in schools for the benefit of their communities.

Keywords: Agent-based model; COVID-19; Face masks; Public health; School reopening.


Conflict of interest statement

The authors declare that they have no known competing financial interests or personal relationships that could have appeared to influence the work reported in this paper.

Figures

None
Graphical abstract
Fig. 1
Fig. 1
Model calibration to statewide data: A) daily incidence of death; B) proportion of deaths through July 13 in decadal age bins; C) daily incidence of hospitalization; and D) daily proportion of tests administered that are positive for SARS-CoV-2. In all panels, blue diamonds represent data. In A, C, and D, the gray line is the median, the dark shaded region the 50 % posterior predictive interval, and the light shaded region the 95 % posterior predictive interval.
Fig. 2
Fig. 2
Model comparison with data withheld from fitting. We validated the model’s predictions against statewide data withheld from fitting on A) the cumulative proportion of the population of Indiana infected through late April and early June, and B) the cumulative proportion infected among individuals aged 12–40, 40–60, and 60+. Data are shown in navy and come from a random, statewide serological survey (Menachemi et al., 2020). Model predictions are shown in gray. In A, the line and band indicate the median and 95 % posterior predictive interval. In B, lines, boxes, and error bars indicate median, interquartile range, and 95 % posterior predictive interval.
Fig. 3
Fig. 3
The impact of school reopening on August 24 under a scenario with 100 % school operating capacity and 0% face-mask adherence in schools. Model outputs shown include: A) the reproduction number, Rt, over time; B) the proportion of infections acquired in different location types (colors) over time; and C) the daily incidence of infection statewide over time. In A and C, the line represents the median, and the shaded region represents the 50 % posterior predictive interval.
Fig. 4
Fig. 4
The impact of different scenarios about conditions for school reopening on A) cumulative infections and B) cumulative deaths in Indiana between August 24 and December 31. Scenarios are defined by school operating capacity (x-axis) and face-mask adherence in schools (shading). Orange lines represent projections under a scenario of school reopening at full capacity without masks (solid: median; dotted: 95 % posterior predictive interval). Blue lines represent a scenario where schools operate remotely. Error bars indicate inter-quartile ranges.
Fig. 5
Fig. 5
The impact of different scenarios about conditions for school reopening on infections (top row), symptomatic infections (middle row), and deaths (bottom row) per 1,000 people. These outcomes are presented separately for students (left column), teachers (middle column), and school-affiliated families (right column). Scenarios are defined by school operating capacity (x-axis) and face-mask adherence in schools (shading). Orange lines represent projections under a scenario of school reopening at full capacity without masks (solid: median; dotted: 95 % posterior predictive interval). Blue lines represent a scenario where schools operate remotely. Error bars indicate inter-quartile ranges.
Fig. 6
Fig. 6
Retrospective analysis of the model calibrated to statewide data from fall 2020. Under two alternative scenarios about the daily probability of sheltering in place (summer vs. pre-pandemic mobility level in gray and red, respectively), we calibrated the parameters for school operating capacity and face-mask adherence in schools to data from August 24 through December 31, 2020 (blue diamonds). The calibrated model’s correspondence to daily incidence of death statewide is shown in the top two panels, and values of the calibrated parameters are shown in the bottom panels.

References

    1. Abdollahi E., Haworth-Brockman M., Keynan Y., Langley J.M., Moghadas S.M. Simulating the effect of school closure during COVID-19 outbreaks in Ontario, Canada. BMC Med. 2020;18:230. doi: 10.1186/s12916-020-01705-8. - DOI - PMC - PubMed
    1. Auger K.A., Shah S.S., Richardson T., Hartley D., Hall M., Warniment A., et al. Association between statewide school closure and COVID-19 incidence and mortality in the US. JAMA. 2020 doi: 10.1001/jama.2020.14348. - DOI - PMC - PubMed
    1. Badr H.S., Du H., Marshall M., Dong E., Squire M.M., Gardner L.M. Association between mobility patterns and COVID-19 transmission in the USA: a mathematical modelling study. Lancet Infect. Dis. 2020 doi: 10.1016/S1473-3099(20)30553-3. - DOI - PMC - PubMed
    1. Bi Q., Wu Y., Mei S., Ye C., Zou X., Zhang Z., et al. Epidemiology and transmission of COVID-19 in 391 cases and 1286 of their close contacts in Shenzhen, China: a retrospective cohort study. Lancet Infect. Dis. 2020 - PMC - PubMed
    1. Cauchemez S., Valleron A.-J., Boëlle P.-Y., Flahault A., Ferguson N.M. Estimating the impact of school closure on influenza transmission from Sentinel data. Nature. 2008;452:750–754. doi: 10.1038/nature06732. - DOI - PubMed