. 2021 Nov 1;27(21):5912-5921.
doi: 10.1158/1078-0432.CCR-20-3925. Epub 2021 Aug 23.

Elucidation of Tumor-Stromal Heterogeneity and the Ligand-Receptor Interactome by Single-Cell Transcriptomics in Real-world Pancreatic Cancer Biopsies

Affiliations

Elucidation of Tumor-Stromal Heterogeneity and the Ligand-Receptor Interactome by Single-Cell Transcriptomics in Real-world Pancreatic Cancer Biopsies

Jaewon J Lee et al. Clin Cancer Res. .

Abstract

Purpose: Precision medicine approaches in pancreatic ductal adenocarcinoma (PDAC) are imperative for improving disease outcomes. With molecular subtypes of PDAC gaining relevance in the context of therapeutic stratification, the ability to characterize heterogeneity of cancer-specific gene expression patterns is of great interest. In addition, understanding patterns of immune evasion within PDAC is of importance as novel immunotherapeutic strategies are developed.

Experimental design: Single-cell RNA sequencing (scRNA-seq) is readily applicable to limited biopsies from human primary and metastatic PDAC and identifies most cancers as being an admixture of previously described epithelial transcriptomic subtypes.

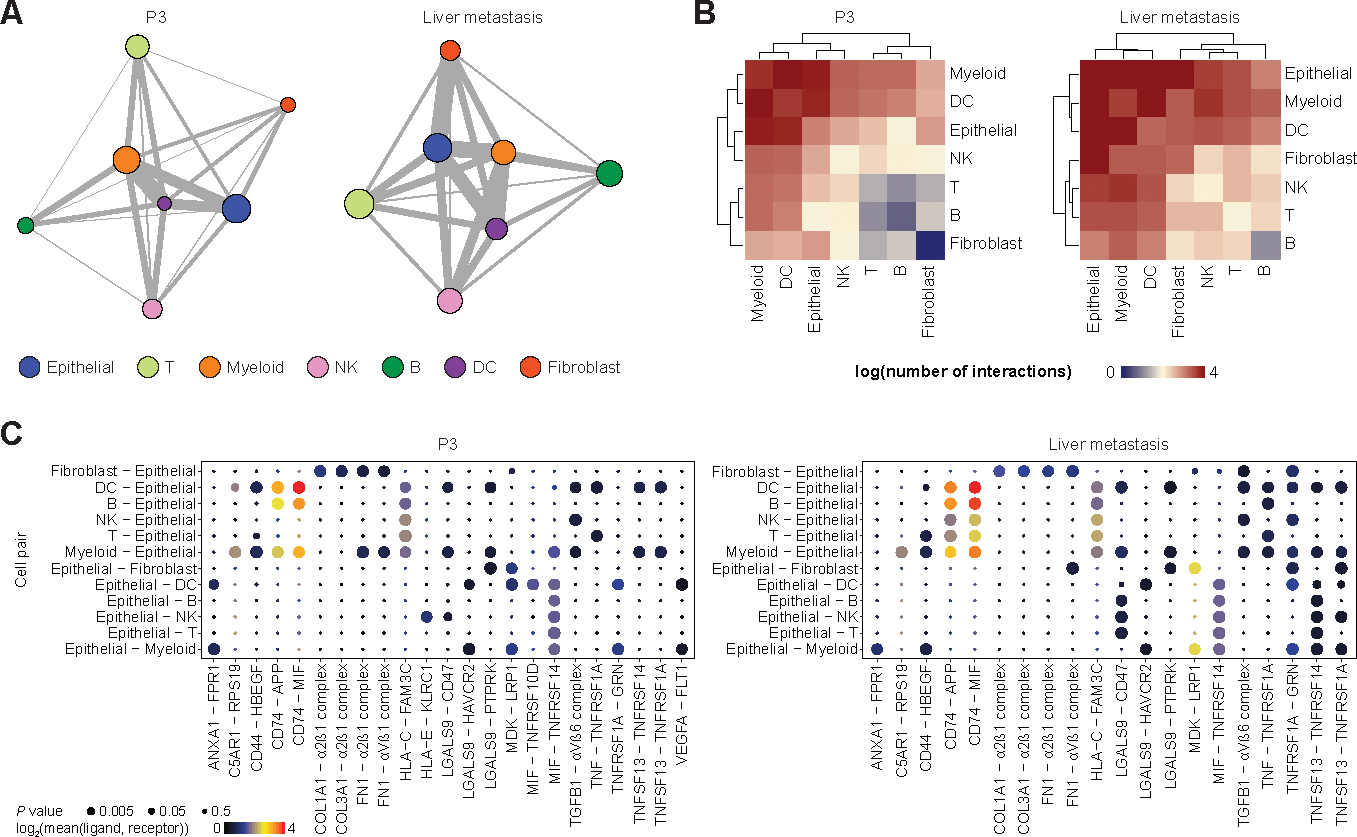
Results: Integrative analyses of our data provide an in-depth characterization of the heterogeneity within the tumor microenvironment, including cancer-associated fibroblast subclasses, and predicts for a multitude of ligand-receptor interactions, revealing potential targets for immunotherapy approaches.

Conclusions: Our analysis demonstrates that the use of de novo biopsies from patients with PDAC paired with scRNA-seq may facilitate therapeutic prediction from limited biopsy samples.


Conflict of interest statement

Disclosures: A.M. receives royalties for a pancreatic cancer biomarker test from Cosmos Wisdom Biotechnology, and this financial relationship is managed and monitored by the UTMDACC Conflict of Interest Committee. A.M. is also listed as an inventor on a patent that has been licensed by Johns Hopkins University to Thrive Earlier Detection. C.L.H. is on the Scientific Advisory Board of BriaCell and has no conflict of interest relevant to this study.

Figures

Figure 1.
Figure 1.. PDAC biopsies contain diverse cell types.
A. UMAP plot of single cells from 9 biopsy samples (left) and bar plot showing proportions of cell types in pooled primary and metastatic samples (right). B. Bubble plot showing highly expressed marker genes in each cell type, with cell types in rows and genes in columns. Size of each bubble represents percent of cells expressing marker and color represents the level of expression. C. UMAP plot of epithelial cells re-clustered from A (left) and bar plot showing proportions of epithelial cell sub-clusters in pooled primary and metastatic samples (right). D. Violin plots showing relative expression levels of selected marker genes in all epithelial sub-clusters.
Figure 2.
Figure 2.. PDAC molecular subtypes at single-cell resolution.
A-C. Bar plots showing proportions of epithelial cells classifying into Bailey (A), Collisson (B), and Moffitt (C) subtypes with FDR < 0.2 in pooled primary and metastatic samples (left) and individual samples (right). D. Pseudotime trajectory of epithelial cells from all biopsy samples labeled with Moffitt molecular subtypes or Raghavan hybrid subtype (top) and bar plot representing the proportions of cells in each pseudotime bin (50 bins total) classifying into one of three subtypes (bottom). E. Pseudotime trajectory plot from D labeled with sample identification separated into primary lesions (top) and metastatic lesions (bottom). F. Branched heatmap showing dynamic gene expression changes in epithelial cells along the pseudotime trajectory, with pseudotime progressing from left to right. Enriched Hallmark or Gene Ontology biological process (GO-BP) terms for each gene cluster are listed on the right. P1–5, primary 1–5; VM, vaginal apex metastasis; LiM, liver metastasis; LuM, lung metastasis; PM, peritoneal metastasis.
Figure 3.
Figure 3.. Stromal heterogeneity of PDAC is captured by biopsies.
A. Co-expression of selected apCAF marker genes projected onto UMAP plot of CAFs. CD74 expression is represented by black (low) to red (high), whereas the expression of HLA genes is represented by black (low) to green (high). High expression of both CD74 and variant MHC II molecule is shown as yellow. B. CAF subtypes from nearest template prediction projected onto UMAP plot. C. Heatmap showing scaled expression of apCAF, iCAF, and myCAF marker genes ordered by subtype. D. Correlation plot between apCAF abundance in each sample and the ratio of CD8 T cells (memory and effector) to regulatory T (Treg) cells.
Figure 4.
Figure 4.. Acquisition of immune suppressive phenotype by tumor-infiltrating immune cells.
A. UMAP plot of immune cells from peripheral blood mononuclear cells (PBMC) and tumors colored by cell type. B. UMAP of myeloid cells re-clustered from A colored by cell type (left) and bar plot showing proportions of each myeloid cell type as percent of all cells in PBMC, primary, and metastatic samples (right). C. Pseudotime trajectory of monocytes and macrophages. D. Dot plot representing the expression of MARCO (top) and TREM2 (bottom) along the pseudotime trajectory from D colored by cell type. Solid black line indicates the mean expression at a given pseudotime. E. Heatmap showing dynamic gene expression changes through pseudotime (left) and enrichment of Gene Ontology biological processes (GO-BP) terms for selected gene cluster (right). F. UMAP of myeloid cells re-clustered from Figure 1A (left) and bar plot showing proportions of myeloid cell types in pooled primary and metastatic samples (right). Mono, monocyte; mac, macrophage; DC, dendritic cell; pDC, plasmacytoid DC. G. Heatmap showing scaled expression of select marker genes in each myeloid sub-cluster. H. UMAP of T and NK cell re-clustered from Figure 1A (left) and bar plot showing proportions of T and NK cell types in pooled primary and metastatic samples (right). Trm, tissue resident memory; MAIT, mucosal-associated invariant T; Treg, regulatory T; IFN, interferon. I. Heatmap showing scaled expression of select marker genes in each T and NK sub-cluster.
Figure 5.
Figure 5.. Ligand-receptor interaction predictions between major cell types.
A. Network plots of a primary PDAC (P3, left) and liver metastasis (right) demonstrating potential ligand-receptor interactions. Each node represents a cell type and size reflects relative number of cells. Each edge represents the number of significant interactions between each cell-type pair and its thickness is proportional to the number of interactions. B. Heatmaps of log-transformed number of significant interactions between cell-type pairs in a primary PDAC (P3, left) and liver metastasis (right). C. Bubble plots representing top significant ligand-receptor interactions between different cell-type pairs involving epithelial cells in a primary PDAC (P3, left) and liver metastasis (right). Size of each bubble represents P value and color represents the mean expression of ligand and receptor genes.
Figure 6.
Figure 6.. Ligand-receptor interaction predictions between single cells.
A. Network plots of a primary PDAC (P3, left) and liver metastasis (right) demonstrating potential ligand-receptor interactions in which epithelial cells express the receptor. Each node represents a single cell and the edge represents the number of ligand-receptor pairs between two cells. B. Heatmap showing top interaction scores (normalized number of ligand-receptor interactions) for each cell-type pair where epithelial cells express the receptor. Sample origin, stage, and ligand-expressing cells are annotated above the heatmap. See bottom of figure for legend. C. Network plots of a primary PDAC (P3, left) and liver metastasis (right) demonstrating potential ligand-receptor interactions in which epithelial cells express the ligand. D. Heatmap showing top interaction scores for each cell-type pair where epithelial cells express the ligand. Sample origin, stage, and receptor-expressing cells are annotated above the heatmap. Ligand-receptor interaction class is annotated to the left. P1–5, primary 1–5; VM, vaginal apex metastasis; LiM, liver metastasis; LuM, lung metastasis; PM, peritoneal metastasis.

References

    1. Kleeff J, Korc M, Apte M, Vecchia CL, Johnson CD, Biankin AV, et al. Pancreatic cancer. Nat Rev Dis Primers. 2016;2:16022. - PubMed
    1. Conrad R, Castelino-Prabhu S, Cobb C, Raza A. Cytopathology of the pancreatobiliary tract-the agony, and sometimes, the ease of it. J Gastrointest Oncol. 2013;4:210–9. - PMC - PubMed
    1. VanderLaan PA. Fine‐needle aspiration and core needle biopsy: An update on 2 common minimally invasive tissue sampling modalities. Cancer Cytopathol. 2016;124:862–70. - PubMed
    1. Chantrill LA, Nagrial AM, Watson C, Johns AL, Martyn-Smith M, Simpson S, et al. Precision Medicine for Advanced Pancreas Cancer: The Individualized Molecular Pancreatic Cancer Therapy (IMPaCT) Trial. Clin Cancer Res. 2015;21:2029–37. - PubMed
    1. Aguirre AJ, Nowak JA, Camarda ND, Moffitt RA, Ghazani AA, Hazar-Rethinam M, et al. Real-time genomic characterization of advanced pancreatic cancer to enable precision medicine. Cancer Discov. 2018;8:CD-18–0275. - PMC - PubMed

Publication types