. 2021 Nov;70(11):2532-2544.
doi: 10.2337/db21-0078. Epub 2021 Aug 23.

Cavβ3 Regulates Ca2+ Signaling and Insulin Expression in Pancreatic β-Cells in a Cell-Autonomous Manner

Affiliations

Cavβ3 Regulates Ca2+ Signaling and Insulin Expression in Pancreatic β-Cells in a Cell-Autonomous Manner

Alexander Becker et al. Diabetes. 2021 Nov.

Abstract

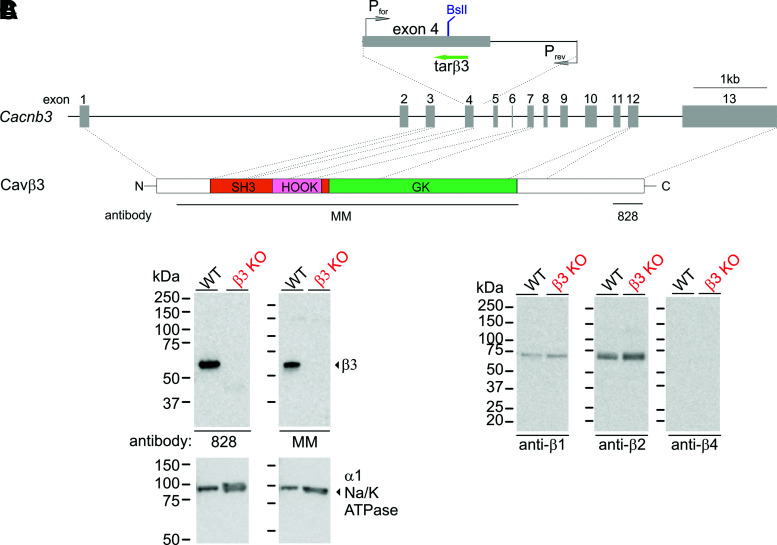
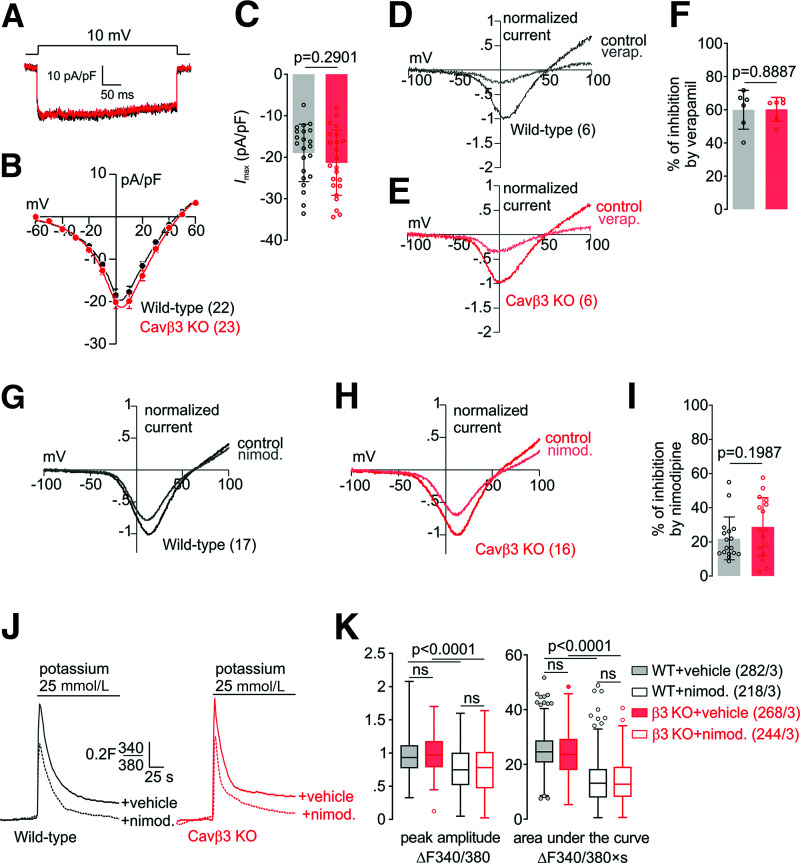
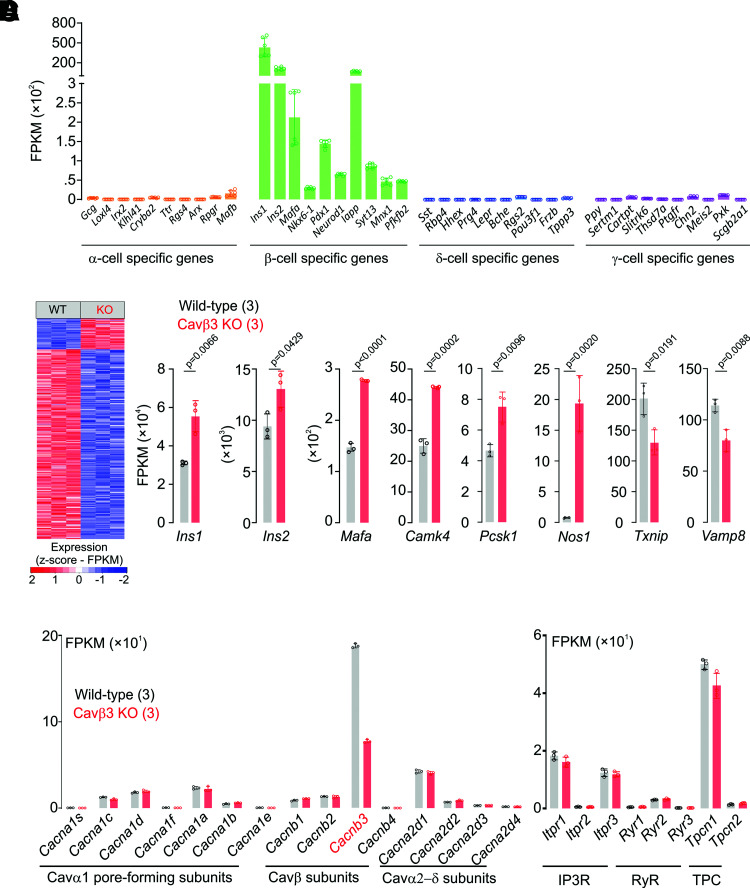
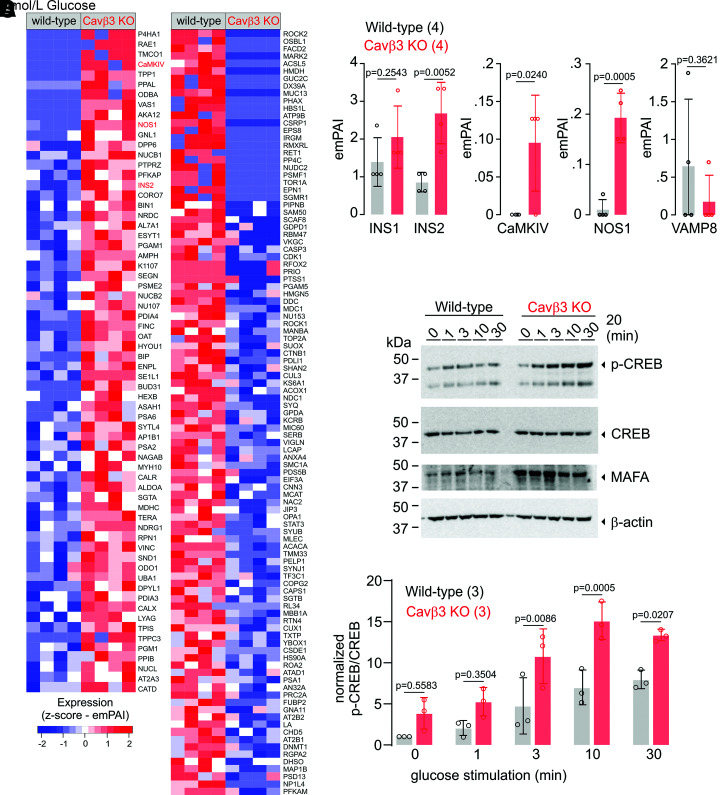
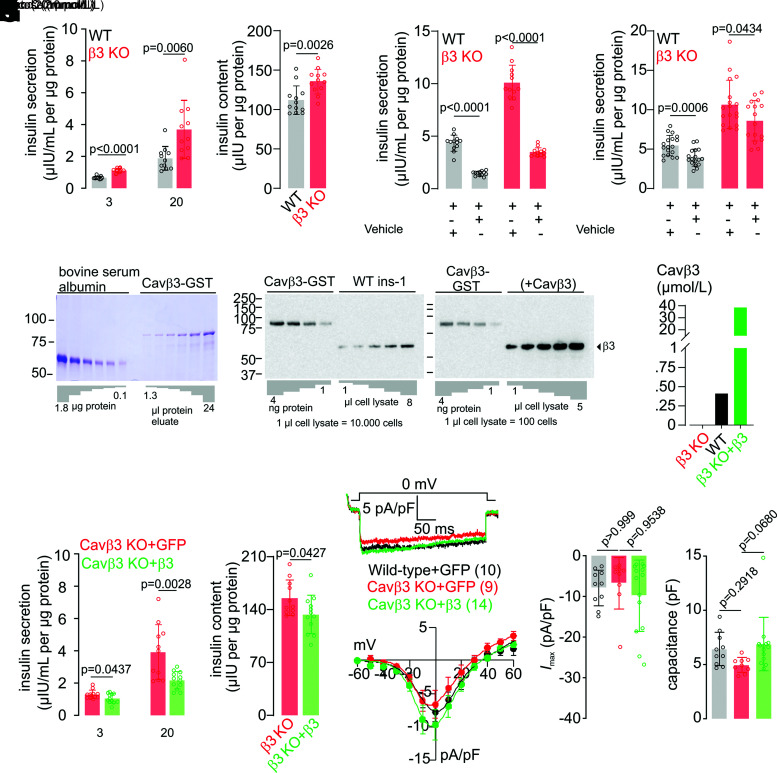
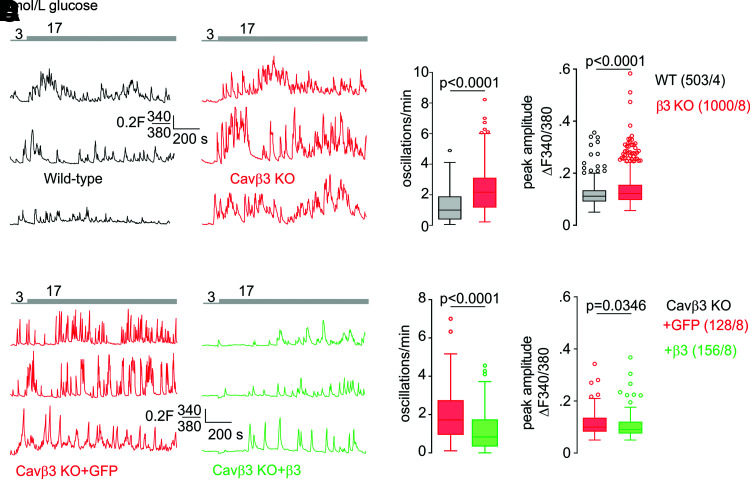
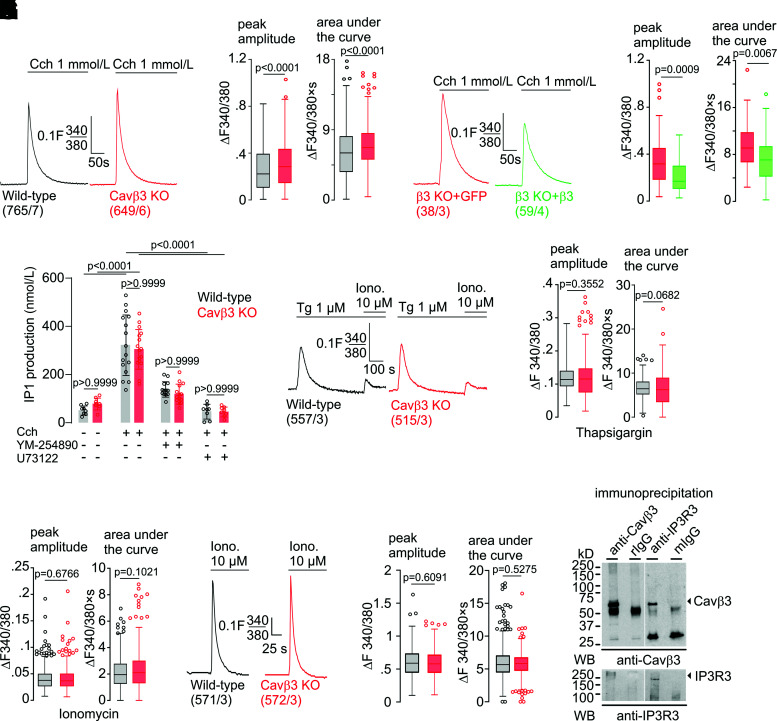
Voltage-gated Ca2+ (Cav) channels consist of a pore-forming Cavα1 subunit and auxiliary Cavα2-δ and Cavβ subunits. In fibroblasts, Cavβ3, independent of its role as a Cav subunit, reduces the sensitivity to low concentrations of inositol-1,4,5-trisphosphate (IP3). Similarly, Cavβ3 could affect cytosolic calcium concentration ([Ca2 +]) in pancreatic β-cells. In this study, we deleted the Cavβ3-encoding gene Cacnb3 in insulin-secreting rat β-(Ins-1) cells using CRISPR/Cas9. These cells were used as controls to investigate the role of Cavβ3 on Ca2+ signaling, glucose-induced insulin secretion (GIIS), Cav channel activity, and gene expression in wild-type cells in which Cavβ3 and the IP3 receptor were coimmunoprecipitated. Transcript and protein profiling revealed significantly increased levels of insulin transcription factor Mafa, CaMKIV, proprotein convertase subtilisin/kexin type-1, and nitric oxide synthase-1 in Cavβ3-knockout cells. In the absence of Cavβ3, Cav currents were not altered. In contrast, CREB activity, the amount of MAFA protein and GIIS, the extent of IP3-dependent Ca2+ release and the frequency of Ca2+ oscillations were increased. These processes were decreased by the Cavβ3 protein in a concentration-dependent manner. Our study shows that Cavβ3 interacts with the IP3 receptor in isolated β-cells, controls IP3-dependent Ca2+-signaling independently of Cav channel functions, and thereby regulates insulin expression and its glucose-dependent release in a cell-autonomous manner.


Figures

Figure 1
Figure 1
Generation of Cavβ3-deficient β-cells. A: CRISPR/Cas9-based strategy to delete the Cacnb3 gene. The positions of the target sequence for the guide RNA tarβ3, of the restriction enzyme BslI site present in wild-type and absent in the introduced mutation, and of the oligonucleotide primers used to amplify Cavβ3 fragments are indicated (top). The Cacnb3 gene (middle), the Cavβ3 protein domains (bottom) (N, N-terminus [white]; SH3, Src-homology 3 [orange]; HOOK [pink]; GK, guanylate kinase [green]; C, C-terminus [white]), and the Cavβ3 fragments used to generate the anti-Cavβ3 antibodies MM and 828 are indicated. Western blot of protein extracts from wild-type (WT) and Cavβ3-KO Ins-1 β-cells (100 µg protein/lane) using antibodies against the Cavβ3 (B) and Cavβ1, β2, and β4 (C). Western blots indicate the absence of Cavβ3 protein in Cavβ3-KO cells and the presence of Cavβ1, β2, and β3 but not of Cavβ4 in WT cells. The α-subunit of the Na+/K+ ATPase protein served as a loading control (B).
Figure 2
Figure 2
Voltage-gated Ca2+ currents and Ca2+ entry in wild-type and Cavβ3-KO β-cells. A: Whole cell currents in wild-type (black) and Cavβ3-KO (red) cells during a voltage step from a holding potential of −60 mV to 10 mV plotted vs. time. B: Current-voltage relationship obtained by voltage steps (400 ms) applied every 2 s from a holding potential of −60 mV up to +60 mV with 10-mV increments, shown as mean ± SEM of the maximal current amplitudes extracted at each voltage step. C: Maximal current amplitude (Imax) at 10 mV shown as single values (dot) and bar graph with mean ± SD. The number of cells included in the analysis is shown in B. Current-voltage relationships from wild-type (D) and Cavβ3-KO β-cells (E) obtained by 50-ms voltage ramps from −100 mV to +100 mV applied every 2 s from a holding potential of −60 mV before (control) and after the application of verapamil (verap.; 10 μmol/L) as indicated. F: Percentage of the Cav-current inhibition after application of verapamil analyzed from experiments in D and E. The number of cells included in the analysis are shown in D and E. Current-voltage relationships from wild-type (G) and Cavβ3-KO β-cells (H) obtained by 50-ms voltage ramps from −100 mV to +100 mV applied every 2 s from a holding potential of −60 mV before (control) and after the application of nimodipine (nimod.; 2 μmol/L) as indicated. I: Percentage of the Cav-current inhibition after application of nimodipine analyzed from experiments in G and H. Data in F and I are shown as single values and bar graph with mean ± SD, with the indicated P values calculated by unpaired two-tailed Student t test. J: Mean Fura-2 (F340/F380) ratiometric traces in the presence of 2 mmol/L extracellular Ca2+ before and after addition of 25 mmol/L potassium in wild-type (black) and Cavβ3-KO (red) cells. Cells were pretreated with 2 μmol/L nimodipine (+nimod., dashed lines) or vehicle (+vehicle, solid lines) for 10 min, and nimodipine was maintained during the whole experiment. K: Peak amplitude and the area under the curve of the potassium-induced Ca2+-influx, shown as Tukey box and whiskers, with the boxes extending from the 25th to the 75th percentile and the line inside the box shows the median. The interquartile ranges represent the difference between the 25th and 75th percentiles. Whiskers are extended to the most extreme data point that is no more than 1.5 times the interquartile range from the edge of the box, and outliers beyond the whiskers are depicted as dots. The indicated P values were calculated by Kruskal–Wallis with Dunn multiple-comparisons test, and the number of measured cells (x) per experiment (y) are indicated as (x/y).
Figure 3
Figure 3
RNA profiling of pancreatic β-cells in the presence (wild-type) and absence (KO) of Cavβ3. A: Expression levels of pancreatic α-, β-, δ-, and γ-cell-specific genes in wild-type and Cavβ3-KO (n = 6) Ins-1 cells. Data are shown as single values of FPKM and bar graphs with mean ± SD. B: Differentially expressed genes identified by RNA sequencing in wild-type (WT; n = 3) and Cavβ3-KO (KO; n = 3) β-cells with an FDR-adjusted P value <0.05. C: Expression levels of Ins1, Ins2, Mafa, Camk4, Pcsk1, Nos1, Txnip, and Vamp8 genes from WT (black; n = 3) and Cavβ3-KO (red; n = 3) cells, shown as single FPKM values and bar graphs with mean ± SD, with the indicated P values calculated by unpaired two-tailed Student t test. D: Gene expression levels of high voltage-gated Ca2+ channel subunits and of intracellular ion channels obtained by RNA sequencing from WT (black; n = 3) and Cavβ3-KO (red; n = 3) cells, shown as single FPKM values and bar graphs with mean ± SD.
Figure 4
Figure 4
Protein profiling of pancreatic β-cells in the presence (wild-type) and absence (KO) of Cavβ3. A: Protein abundances identified by mass spectrometry, upregulated (66 proteins, left panel) and downregulated (103 proteins, right panel) in Cavβ3-KO compared with the wild-type β-cells (identified based on the emPAI values with a P value <0.05, calculated by unpaired two-tailed Student t test) (n = 4: three biological replicates and one technical replicate). B: Protein levels of INS1, INS2, CaMKIV, NOS1, and VAMP8 shown as single emPAI values and bar graphs with mean ± SD, with the indicated P values calculated by unpaired two-tailed Student t test. C: Western blot of protein extracts from wild-type and Cavβ3-KO cells (50 µg protein/lane) using specific antibodies against the phosphorylated form of CREB (p-CREB), total CREB, MAFA, and β-actin as indicated. Cells were stimulated with KRBH buffer containing 20 mmol/L glucose for 1, 3, 10, and 30 min or left untreated (0). D: Densitometric quantification of the antibody stain showing the p-CREB/CREB ratio obtained from three Western blots running protein lysates obtained from independent β-cell cultures. Data are shown as single values and bar graphs with mean ± SD, with the indicated P values calculated using two-way ANOVA followed by Bonferroni multiple-comparison test.
Figure 5
Figure 5
The Cavβ3 protein decreases insulin secretion in a dose-dependent manner without affecting the Cav channel function. Glucose-dependent (3 mmol/L and 20 mmol/L) insulin secretion (A) and total insulin content (B) normalized to total cellular protein content measured from wild-type (WT; black) and Cavβ3-KO (β3 KO; red) β-cells shown as single values and bar graphs with mean ± SD, with the indicated P values calculated by unpaired two-tailed Student t test. Insulin secretion normalized to total cellular protein content measured from wild-type (black) and Cavβ3-KO (red) β-cells exposed to 20 mmol/L glucose (Gluc.) in the absence or presence of nimodipine (Nimod.; 2 μmol/L) (C) or xestospongin C (Xest. C; 10 μmol/L) (D). Data are shown as single values and bar graphs with mean ± SD, with the indicated P values calculated by unpaired two-tailed Student t test. E: Estimation of the Cavβ3 protein concentration in β-cells. The concentration of recombinant GST-Cavβ3 was determined by densitometric analysis relative to the known concentrations of BSA (left) in Coomassie-stained SDS-PAGE. Immunostain intensities obtained from anti-Cavβ3 Western blots from known amounts of recombinant GST-Cavβ3 protein (1, 2, 3, and 4 ng) were compared with endogenous Cavβ3 protein of a defined number of wild-type β-cells (middle) and Cavβ3-KO β-cells transfected with the Cacnb3 cDNA (+Cavβ3, right). Transfected cells were identified by their green fluorescence and sorted by preparative FACS before analyses. Cavβ3 is estimated at 36.8 fg/single wild-type β-cell and 3.4 pg/single Cavβ3-cDNA–expressing cell. F: Considering the β-cell volume of 1.6 pL, Cavβ3 protein concentrations were calculated as 0.41 μmol/L in wild-type cells and as 38.6 μmol/L per cell after transfection with the Cavβ3 cDNA. Glucose-dependent (3 mmol/L and 20 mmol/L) insulin secretion (G) and total insulin content (H) normalized to total cellular protein content measured from Cavβ3-KO cells transfected with either IRES-GFP (Cavβ3 KO+GFP; red) or Cavβ3-IRES-GFP (Cavβ3 KO+β3; green) cDNA shown as single values and bar graphs with mean ± SD, with the indicated P values calculated by unpaired two-tailed Student t test. Note: insulin release and content are overestimated in β3 KO+β3 cells, a mixture of transfected and nontransfected cells. I: Whole cell currents during voltage steps from a holding potential of −60 mV to 0 mV plotted vs. time recorded from wild-type cells (black, transfected with IRES-GFP as a control) or Cavβ3-KO cells transfected with IRES-GFP (red) or with Cavβ3-IRES-GFP (green). J: Current-voltage relationships obtained by voltage steps (400 ms) applied every 2 s from a holding potential of −60 mV up to +60 mV with 10-mV increments shown as mean ± SEM of the maximal current amplitudes extracted at each voltage step. K and L: Maximal current amplitude (Imax) at 0 mV and cell capacitance shown as single values and bar graphs with mean ± SD, with the indicated P values calculated by one-way ANOVA followed by Bonferroni multiple-comparison test. The number of cells analyzed in IL is indicated in I.
Figure 6
Figure 6
Cavβ3 inhibits frequency of glucose-induced Ca2+ oscillations. Representative Fura-2 (F340/380) ratiometric traces in the presence of extracellular Ca2+ from wild-type (WT; black) and Cavβ3-KO (red) β-cells (A) or from Cavβ3-KO β-cells transfected with either IRES-GFP (red) or Cavβ3-IRES-GFP (green) (C) in the presence of 3 mmol/L and 17 mmol/L extracellular glucose as indicated. B and D: Numbers of glucose-evoked Ca2+ oscillations per minute (left) and mean peak amplitude per cell (right) from experiments in A and C. Data in B and D are shown as Tukey box and whiskers with the boxes extending from the 25th to the 75th percentile, and the line inside the box shows the median. The interquartile ranges represent the difference between the 25th and 75th percentiles. Whiskers are extended to the most extreme data point that is no more than 1.5 times the interquartile range from the edge of the box, and outliers beyond the whiskers are depicted as dots. The indicated P values were calculated by Mann-Whitney test, and the number of measured cells (x) per experiment (y) are indicated as (x/y).
Figure 7
Figure 7
Cavβ3 binds to the IP3 receptor and inhibits IP3-dependent Ca2+ release. Mean Fura-2 (F340/380) ratiometric traces in the absence of extracellular Ca2+ from wild-type (black) and Cavβ3-KO β-cells (red) (A) and from Cavβ3-KO β-cells transfected with either IRES-GFP (red) or Cavβ3-IRES-GFP (green) (C) before and after application of carbachol (Cch; 1 mmol/L). B and D: Peak amplitude (left) and the area under the curve (right) of carbachol-evoked Ca2+ signals from experiments shown in A and C. E: IP3 production as measured by the accumulation of IP1 (in nanomoles per liter) in wild-type (black) and Cavβ3-KO β-cells (red) in response to carbachol stimulation in the absence or presence of the Gαq/11-specific inhibitor YM-254890 (100 nmol/L) or the phospholipase C inhibitor U73122 (10 μmol/L). Data are shown as single values and bar graphs with mean ± SD, with the indicated P values calculated by one-way ANOVA followed by Bonferroni multiple-comparison test. F: Mean Fura-2 (F340/380) ratiometric traces in the absence of extracellular Ca2+ from wild-type (black) and Cavβ3-KO (red) β-cells before and after application of thapsigargin (Tg; 1 μmol/L) and then ionomycin (Iono.; 10 μmol/L). Peak amplitude (left) and area under the curve (right) of thapsigargin (G) and ionomycin-evoked (H) Ca2+ signal. I: Mean Fura-2 (F340/380) ratiometric traces in the absence of extracellular Ca2+ from wild-type (black) and Cavβ3-KO (red) β-cells before and after application of ionomycin (10 μmol/L). J: Peak amplitude and area under the curve of ionomycin-evoked Ca2+ signal. Data in B, D, G, H, and J are shown as Tukey box and whiskers with the boxes extend from the 25th to the 75th percentile, and the line inside the box shows the median. The interquartile ranges represent the difference between the 25th and 75th percentiles. Whiskers are extended to the most extreme data point that is no more than 1.5 times the interquartile range from the edge of the box, and outliers beyond the whiskers are depicted as dots. The indicated P values were calculated by Mann-Whitney test, and the number of measured cells (x) per experiment (y) are indicated as (x/y). K: Coimmunoprecipitation of Cavβ3 and the IP3R3. Immunoprecipitations were performed with antibodies against Cavβ3, nonspecific rabbit Ig (rIgG), anti-IP3R3, and nonspecific mouse Ig (mIgG). Eluted protein complexes were subjected to Western blot (WB) using anti-Cavβ3 (top blot) and anti-IP3R3 (bottom blot).

References

    1. Ashcroft FM, Rorsman P. Electrophysiology of the pancreatic beta-cell. Prog Biophys Mol Biol 1989;54:87–143 - PubMed
    1. Grapengiesser E, Gylfe E, Hellman B. Glucose-induced oscillations of cytoplasmic Ca2+ in the pancreatic beta-cell. Biochem Biophys Res Commun 1988;151:1299–1304 - PubMed
    1. Henquin JC, Meissner HP. Significance of ionic fluxes and changes in membrane potential for stimulus-secretion coupling in pancreatic B-cells. Experientia 1984;40:1043–1052 - PubMed
    1. Kindmark H, Köhler M, Efendić S, Rorsman P, Larsson O, Berggren PO. Protein kinase C activity affects glucose-induced oscillations in cytoplasmic free Ca2+ in the pancreatic B-cell. FEBS Lett 1992;303:85–90 - PubMed
    1. Srivastava M, Atwater I, Glasman M, et al. . Defects in inositol 1,4,5-trisphosphate receptor expression, Ca2+ signaling, and insulin secretion in the anx7(+) knockout mouse. Proc Natl Acad Sci USA 1999;96:13783–13788 - PMC - PubMed

Publication types

MeSH terms