. 2021 Sep 7;118(36):e2026076118.
doi: 10.1073/pnas.2026076118.

The genetic structure of the Turkish population reveals high levels of variation and admixture

Affiliations

The genetic structure of the Turkish population reveals high levels of variation and admixture

M Ece Kars et al. Proc Natl Acad Sci U S A. .

Erratum in

Abstract

The construction of population-based variomes has contributed substantially to our understanding of the genetic basis of human inherited disease. Here, we investigated the genetic structure of Turkey from 3,362 unrelated subjects whose whole exomes (n = 2,589) or whole genomes (n = 773) were sequenced to generate a Turkish (TR) Variome that should serve to facilitate disease gene discovery in Turkey. Consistent with the history of present-day Turkey as a crossroads between Europe and Asia, we found extensive admixture between Balkan, Caucasus, Middle Eastern, and European populations with a closer genetic relationship of the TR population to Europeans than hitherto appreciated. We determined that 50% of TR individuals had high inbreeding coefficients (≥0.0156) with runs of homozygosity longer than 4 Mb being found exclusively in the TR population when compared to 1000 Genomes Project populations. We also found that 28% of exome and 49% of genome variants in the very rare range (allele frequency < 0.005) are unique to the modern TR population. We annotated these variants based on their functional consequences to establish a TR Variome containing alleles of potential medical relevance, a repository of homozygous loss-of-function variants and a TR reference panel for genotype imputation using high-quality haplotypes, to facilitate genome-wide association studies. In addition to providing information on the genetic structure of the modern TR population, these data provide an invaluable resource for future studies to identify variants that are associated with specific phenotypes as well as establishing the phenotypic consequences of mutations in specific genes.

Keywords: Turkish Variome; admixture; population genetics; sequencing; variation.


Conflict of interest statement

The authors declare no competing interest.

Figures
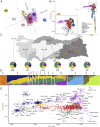
Fig. 1.
Fig. 1.
TR as a hub of extensive human admixture. (A) Procrustes analysis based on unprojected coordinates of geographical locations and PC1 and PC2 coordinates of 1,460 TR individuals with known origin. (B) PCA for individuals from the TR WGS (n = 773), the populations from Lazaridis et al. (n = 1,430) (16), and 1000GP populations (n = 1,299). Individuals were projected along the PC1 and PC2 axes. (Inset) Zoomed view of TR and nearby populations. (C) Map of TR showing the number of chromosomes (WGS/WES) and mean admixture proportions of individuals with known birthplaces who originated from present day TR and former Ottoman Empire territories (TR-B, Balkan; TR-W, West; TR-C, Central; TR-N, North; TR-S, South; TR-E, East). (D) Admixture results of the TR WGS individuals with known origin (n = 647), the populations from Lazaridis et al. (16), and the 1000GP (k = 8). (E) PCA of TR individuals in a regional context. The populations with the lowest pairwise Wright’s FST values were included.
Fig. 2.
Fig. 2.
The Turkish Peninsula as a bridge in the migration trajectories and high inbreeding levels in the TR population. (A) TreeMix phylogeny of the TR population (n = 3,362) along with the 1000GP controls (n = 1,299) and the GME populations (n = 696) representing divergence patterns. The length of branches is proportional to the extent of population drift. (B) The populations with a pairwise Wright's FST value < 0.01. The blue color indicates a closer genetic relationship. (C) The rate of LD decay in the TR population and in the populations of 1000GP and Lazaridis et al. (16). Mean variant correlations (r2) are shown for each 700–base pair (bp) bin over 70,000 bp. EUR and BLK samples were combined as EUR because of the relatively low number of samples in the BLK population. (D) Distributions of the inbreeding coefficient (Fplink). Box plots show the median (horizontal line), 25th percentile (lower edge), 75th percentile (upper edge), and minimum and maximum observations (whiskers).
Fig. 3.
Fig. 3.
The TR Variome possesses a significant number of very rare and unique variants that are poorly represented in gnomAD and GME. The proportion of TR variants represented in the TR Variome and other databases. (A) TR WES versus gnomAD WES, (B) TR WGS versus gnomAD WGS, (C) TR WES versus GME WES. The correlation of DAFs of rare TR variants in the (D) TR WES versus gnomAD WES, (E) TR WGS versus gnomAD WGS, and (F) TR WES versus GME WES. Hexagonal bins are shaded by the log-transformed number of variants in each bin.
Fig. 4.
Fig. 4.
Per-genome variant summary and imputation. (A) The number of variant sites per genome for autosomes. (B) The average number of singletons per genome for autosomes. (C) Evaluation of imputation performance on chromosome 20. The aggregate squared Pearson correlation coefficient (R2) was calculated for genotypes called from WGS and imputed genotypes and plotted against alternative allele frequency for the three reference haplotype panels. A two-tailed Wilcoxon rank-sum test was used to assess the significance of the R2 difference: P = 0.002 for the TR (mean ± SD: 0.88 ± 0.12) versus 1000GP (mean ± SD: 0.86 ± 0.14); P = 0.002 for the TR + 1000GP (mean ± SD: 0.89 ± 0.09) versus 1000GP. (D) The number of imputed variants as a function of expected alternative allele frequency. The density of shading reflects the expected imputation R2, whereas colors represent the reference panels used for the imputation: 1000GP (blue), TR (red), or combined 1000GP and TR (green).

References

    1. Skourtanioti E., et al. ., Genomic history of neolithic to bronze age Anatolia, northern Levant, and southern Caucasus. Cell 181, 1158–1175.e28 (2020). - PubMed
    1. Golden P. B., An Introduction to the History of the Turkic Peoples. Ethnogenesis and State-Formation in Medieval and Early Modern Eurasia and the Middle East (Otto Harrassowitz, Wiesbaden, 1992).
    1. Cinnioğlu C., et al. ., Excavating Y-chromosome haplotype strata in Anatolia. Hum. Genet. 114, 127–148 (2004). - PubMed
    1. Akbayram S., et al. ., The frequency of consanguineous marriage in eastern Turkey. Genet. Couns. 20, 207–214 (2009). - PubMed
    1. Bittles A. H., Black M. L., Evolution in health and medicine Sackler colloquium: Consanguinity, human evolution, and complex diseases. Proc. Natl. Acad. Sci. U.S.A. 107 (suppl. 1), 1779–1786 (2010). - PMC - PubMed

Publication types

LinkOut - more resources