. 2021 Sep;22(9):1163-1174.
doi: 10.1038/s41590-021-01001-4. Epub 2021 Aug 23.

Regulatory T cells function in established systemic inflammation and reverse fatal autoimmunity

Affiliations

Regulatory T cells function in established systemic inflammation and reverse fatal autoimmunity

Wei Hu et al. Nat Immunol. 2021 Sep.

Abstract

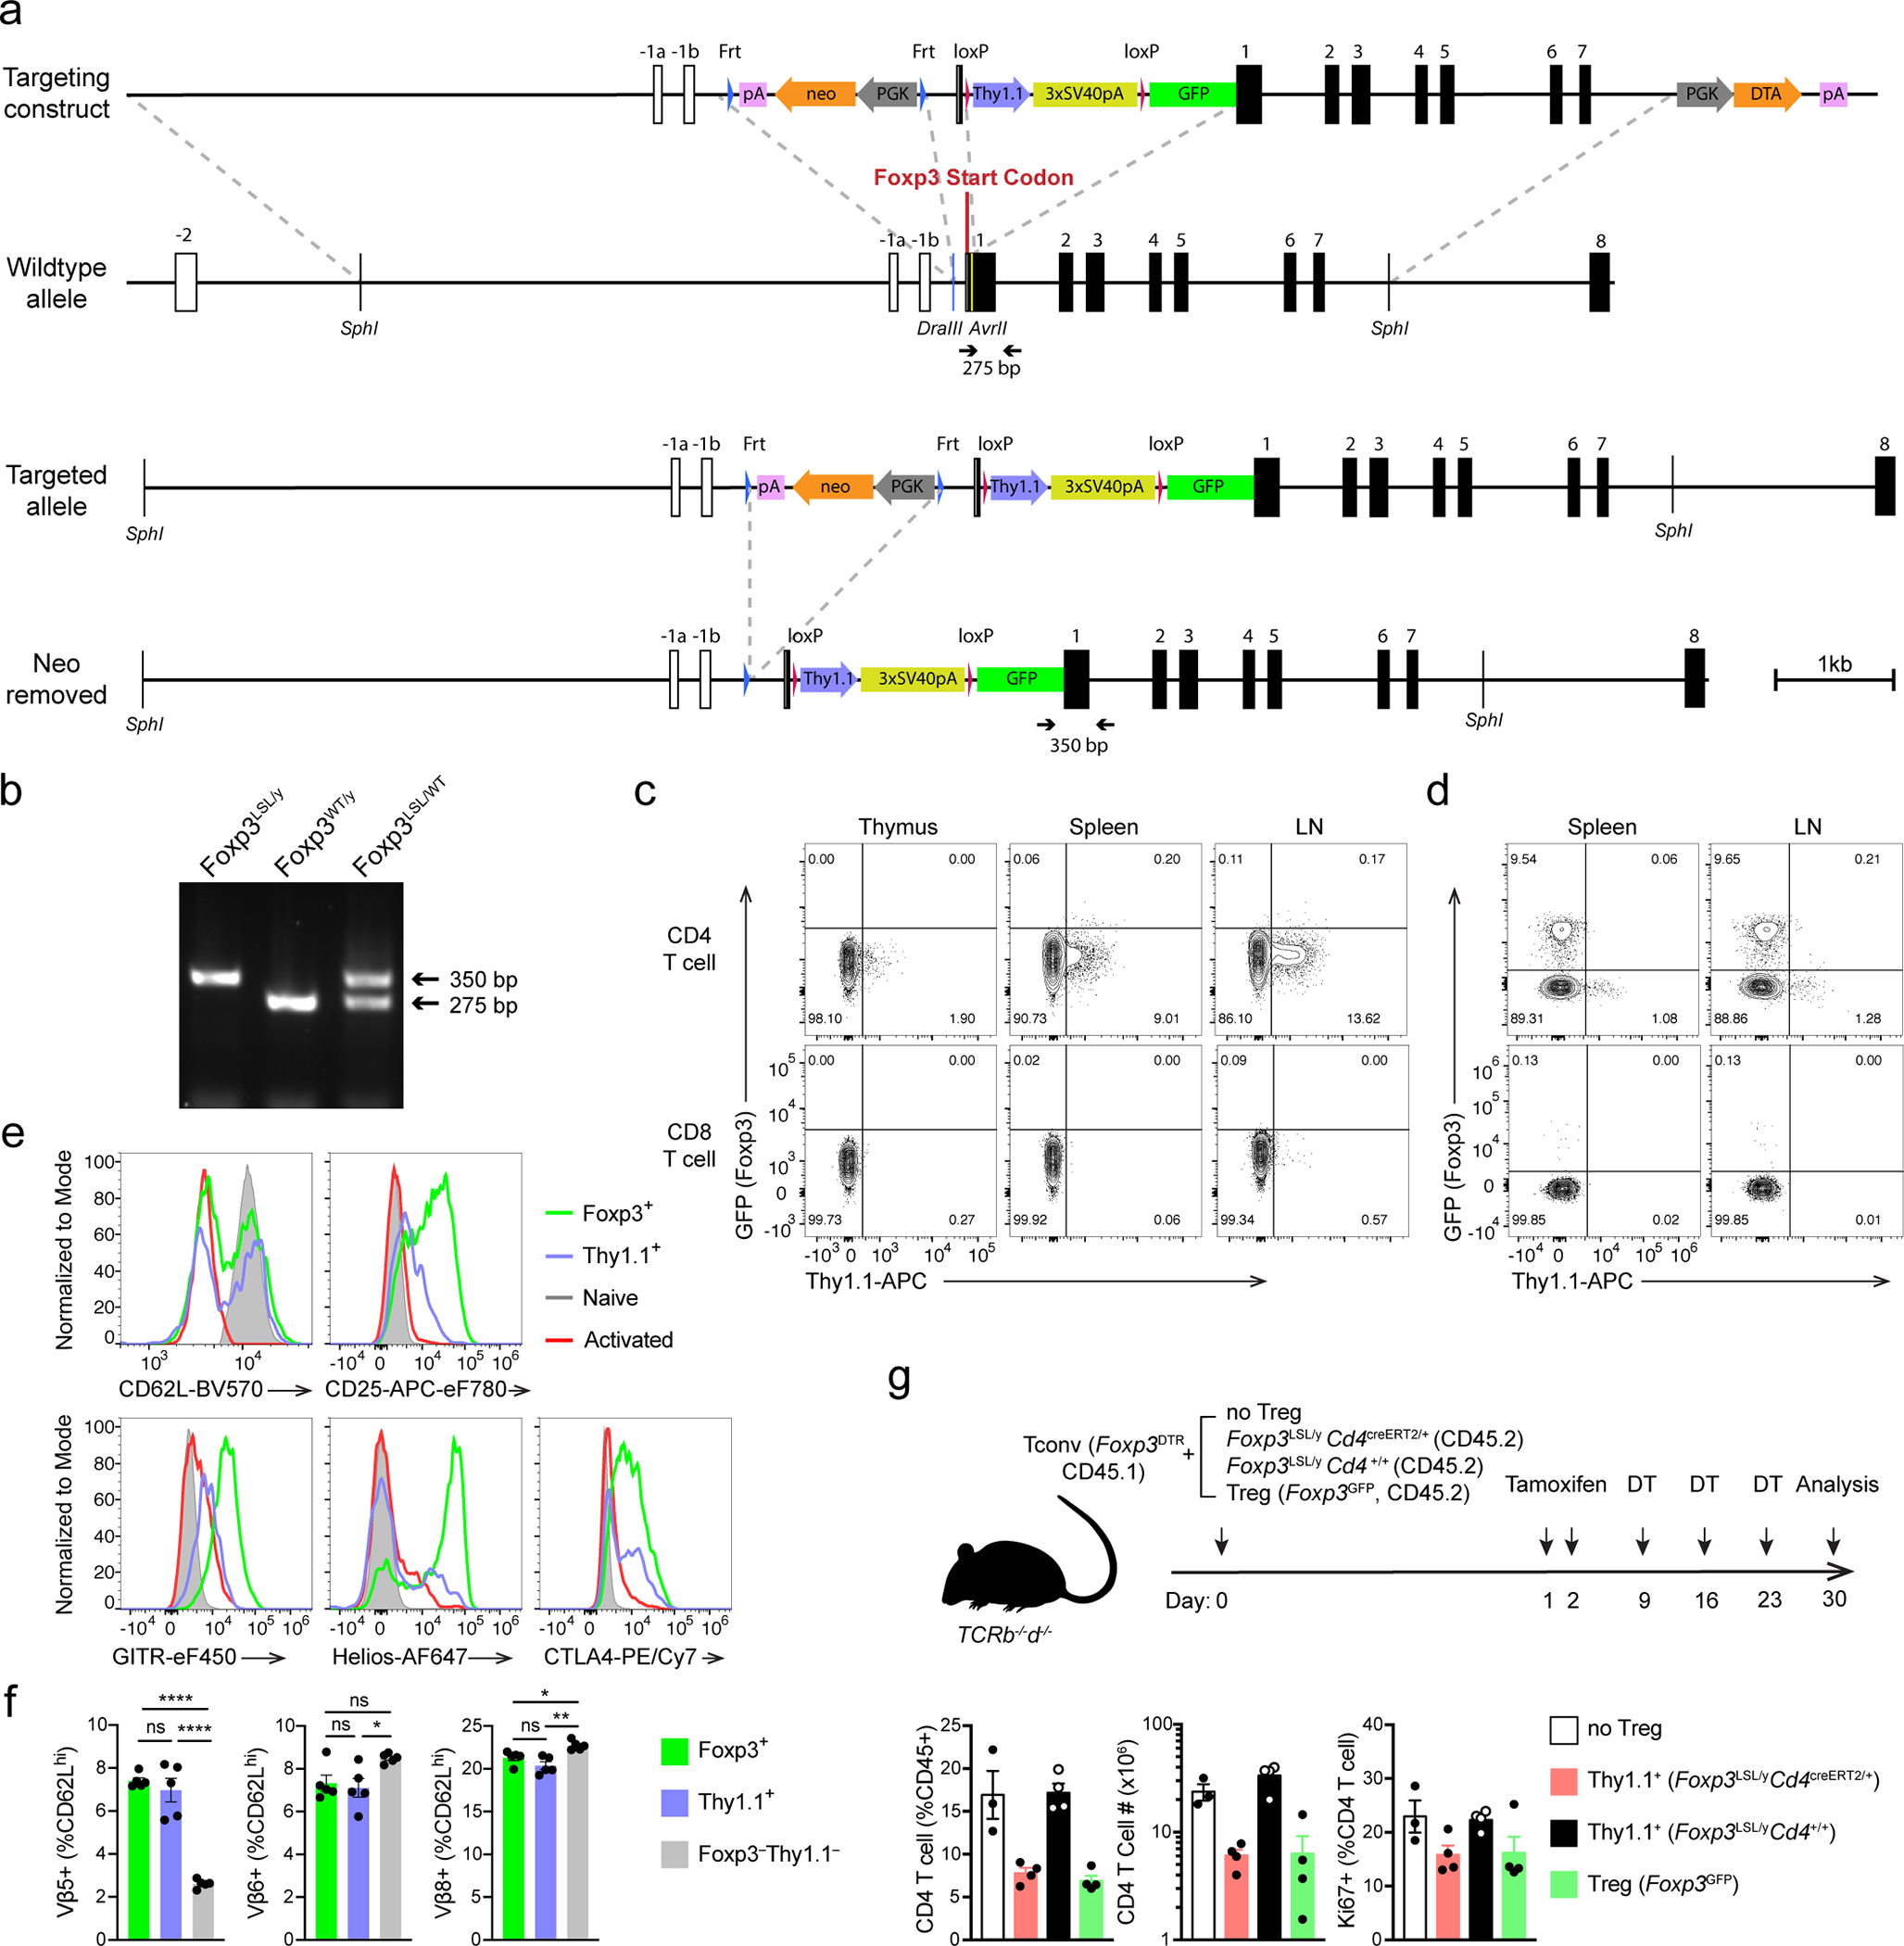
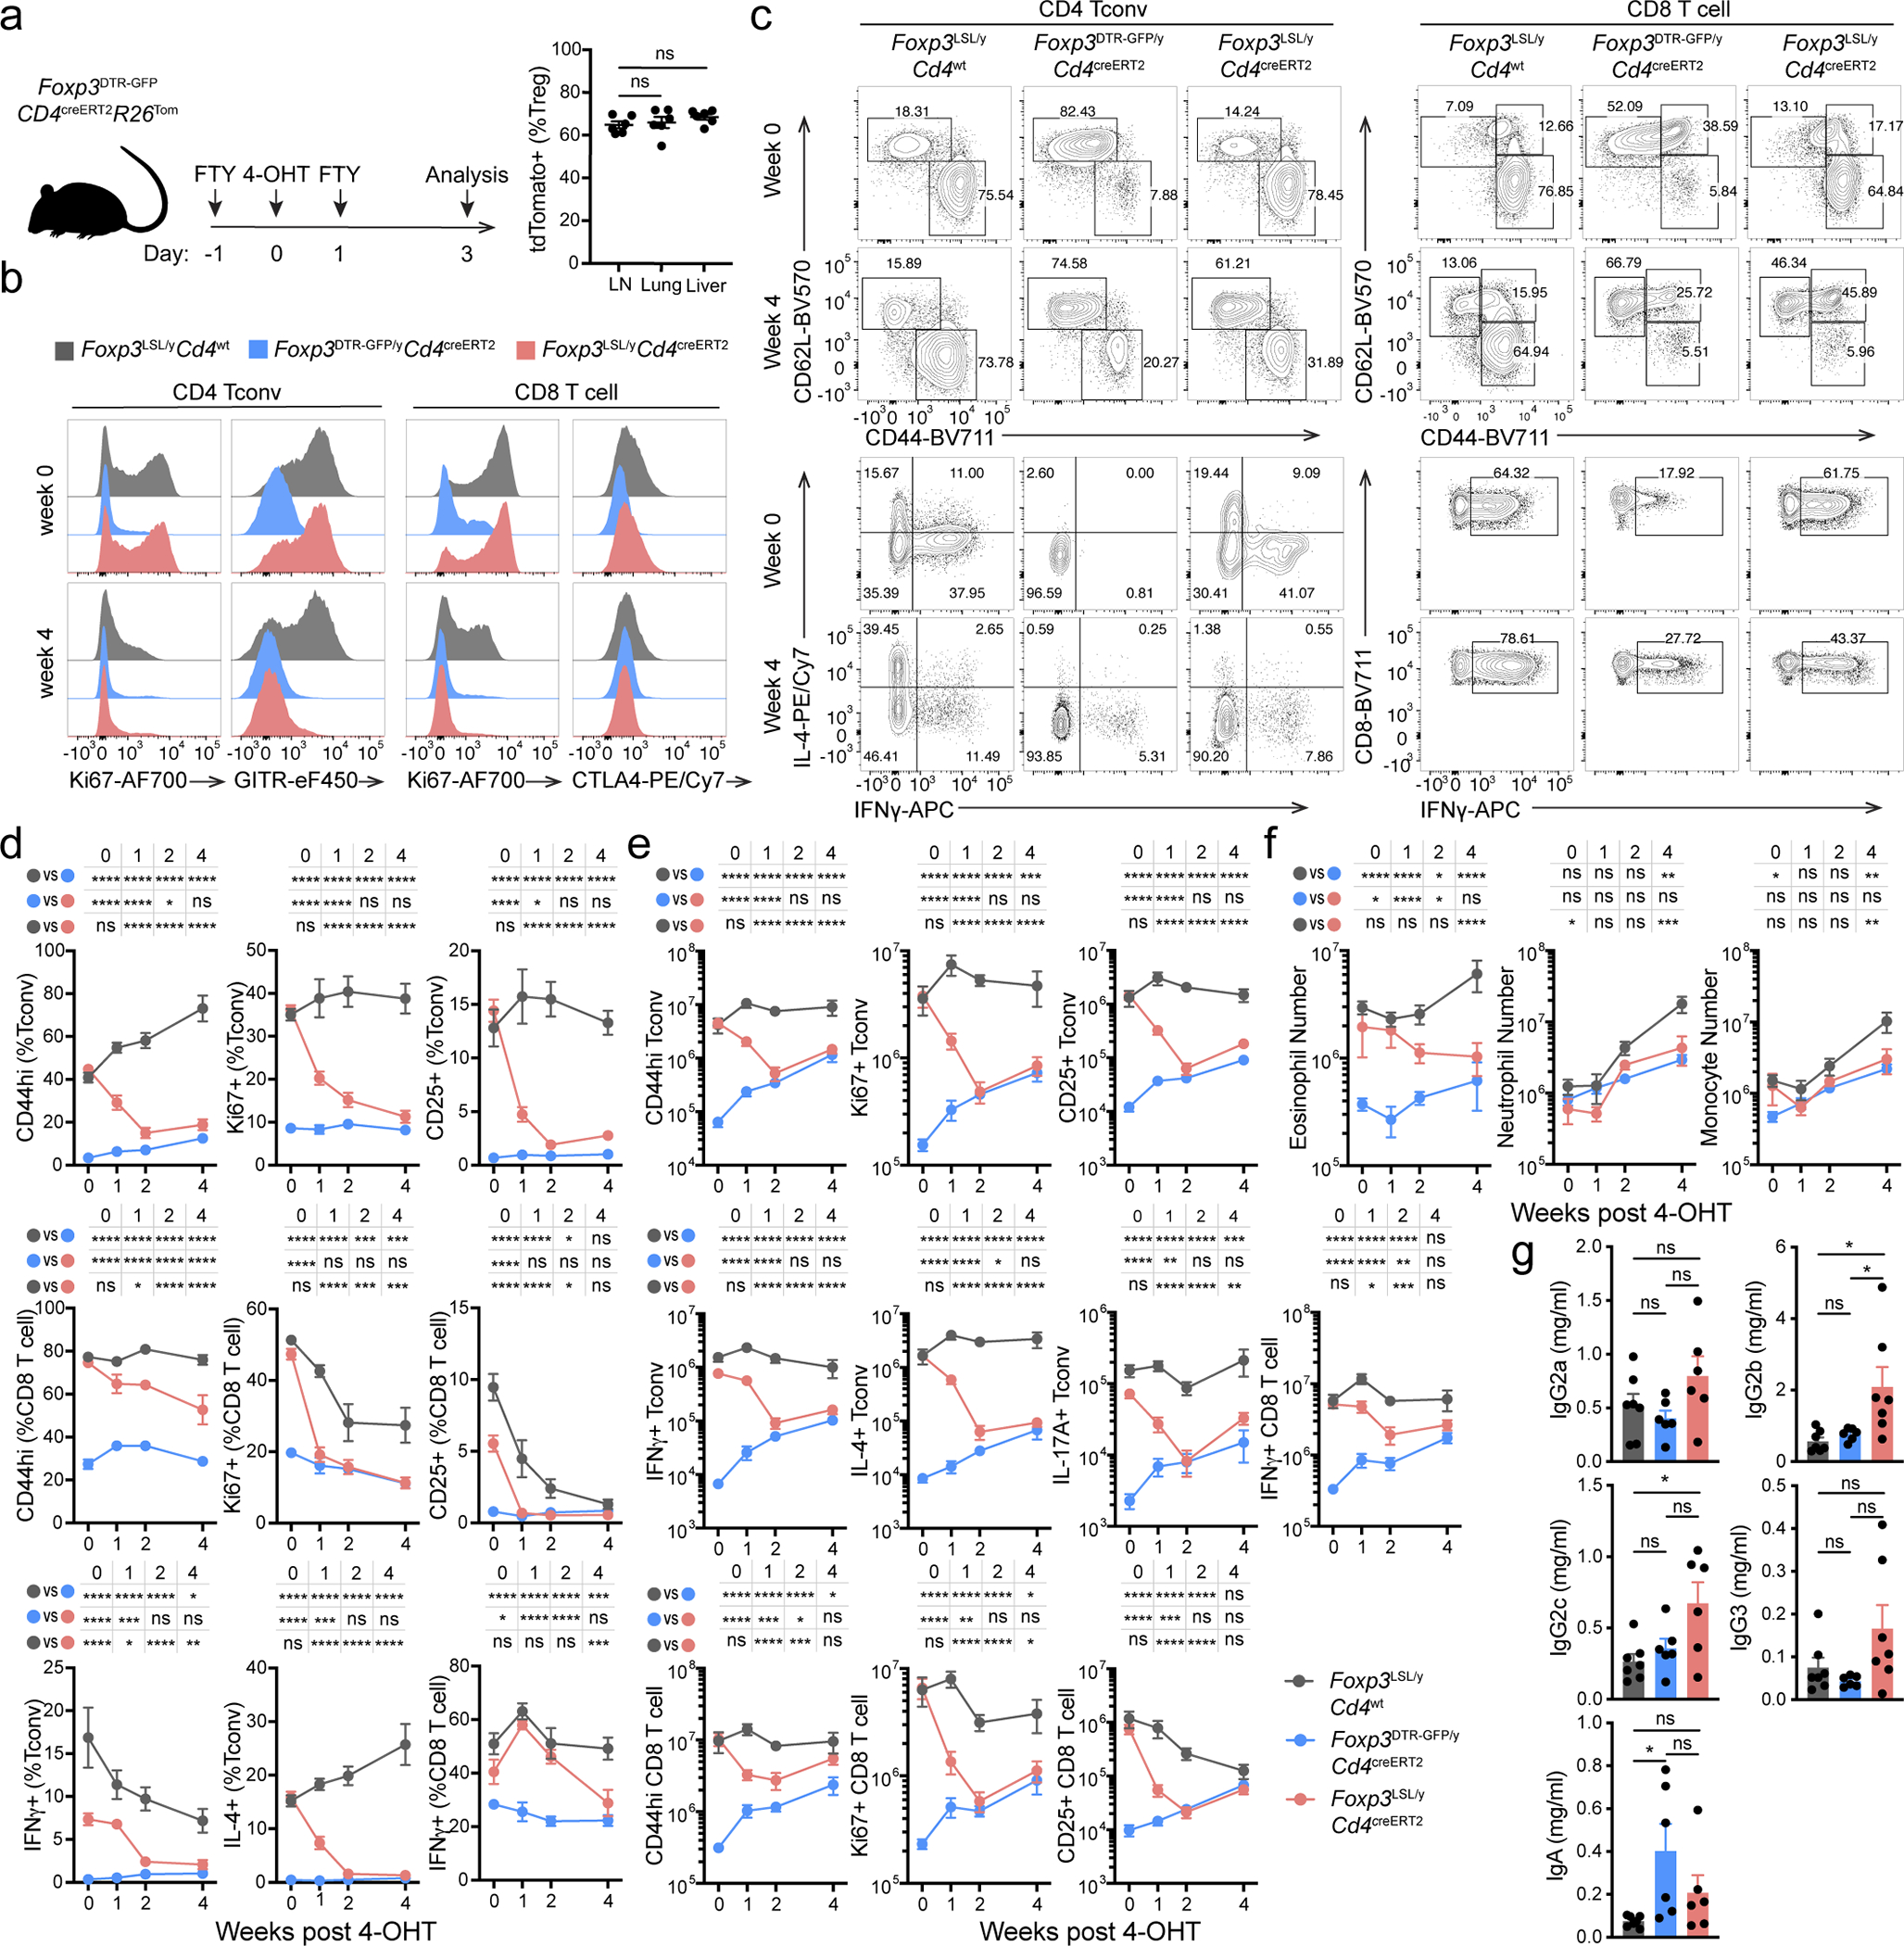
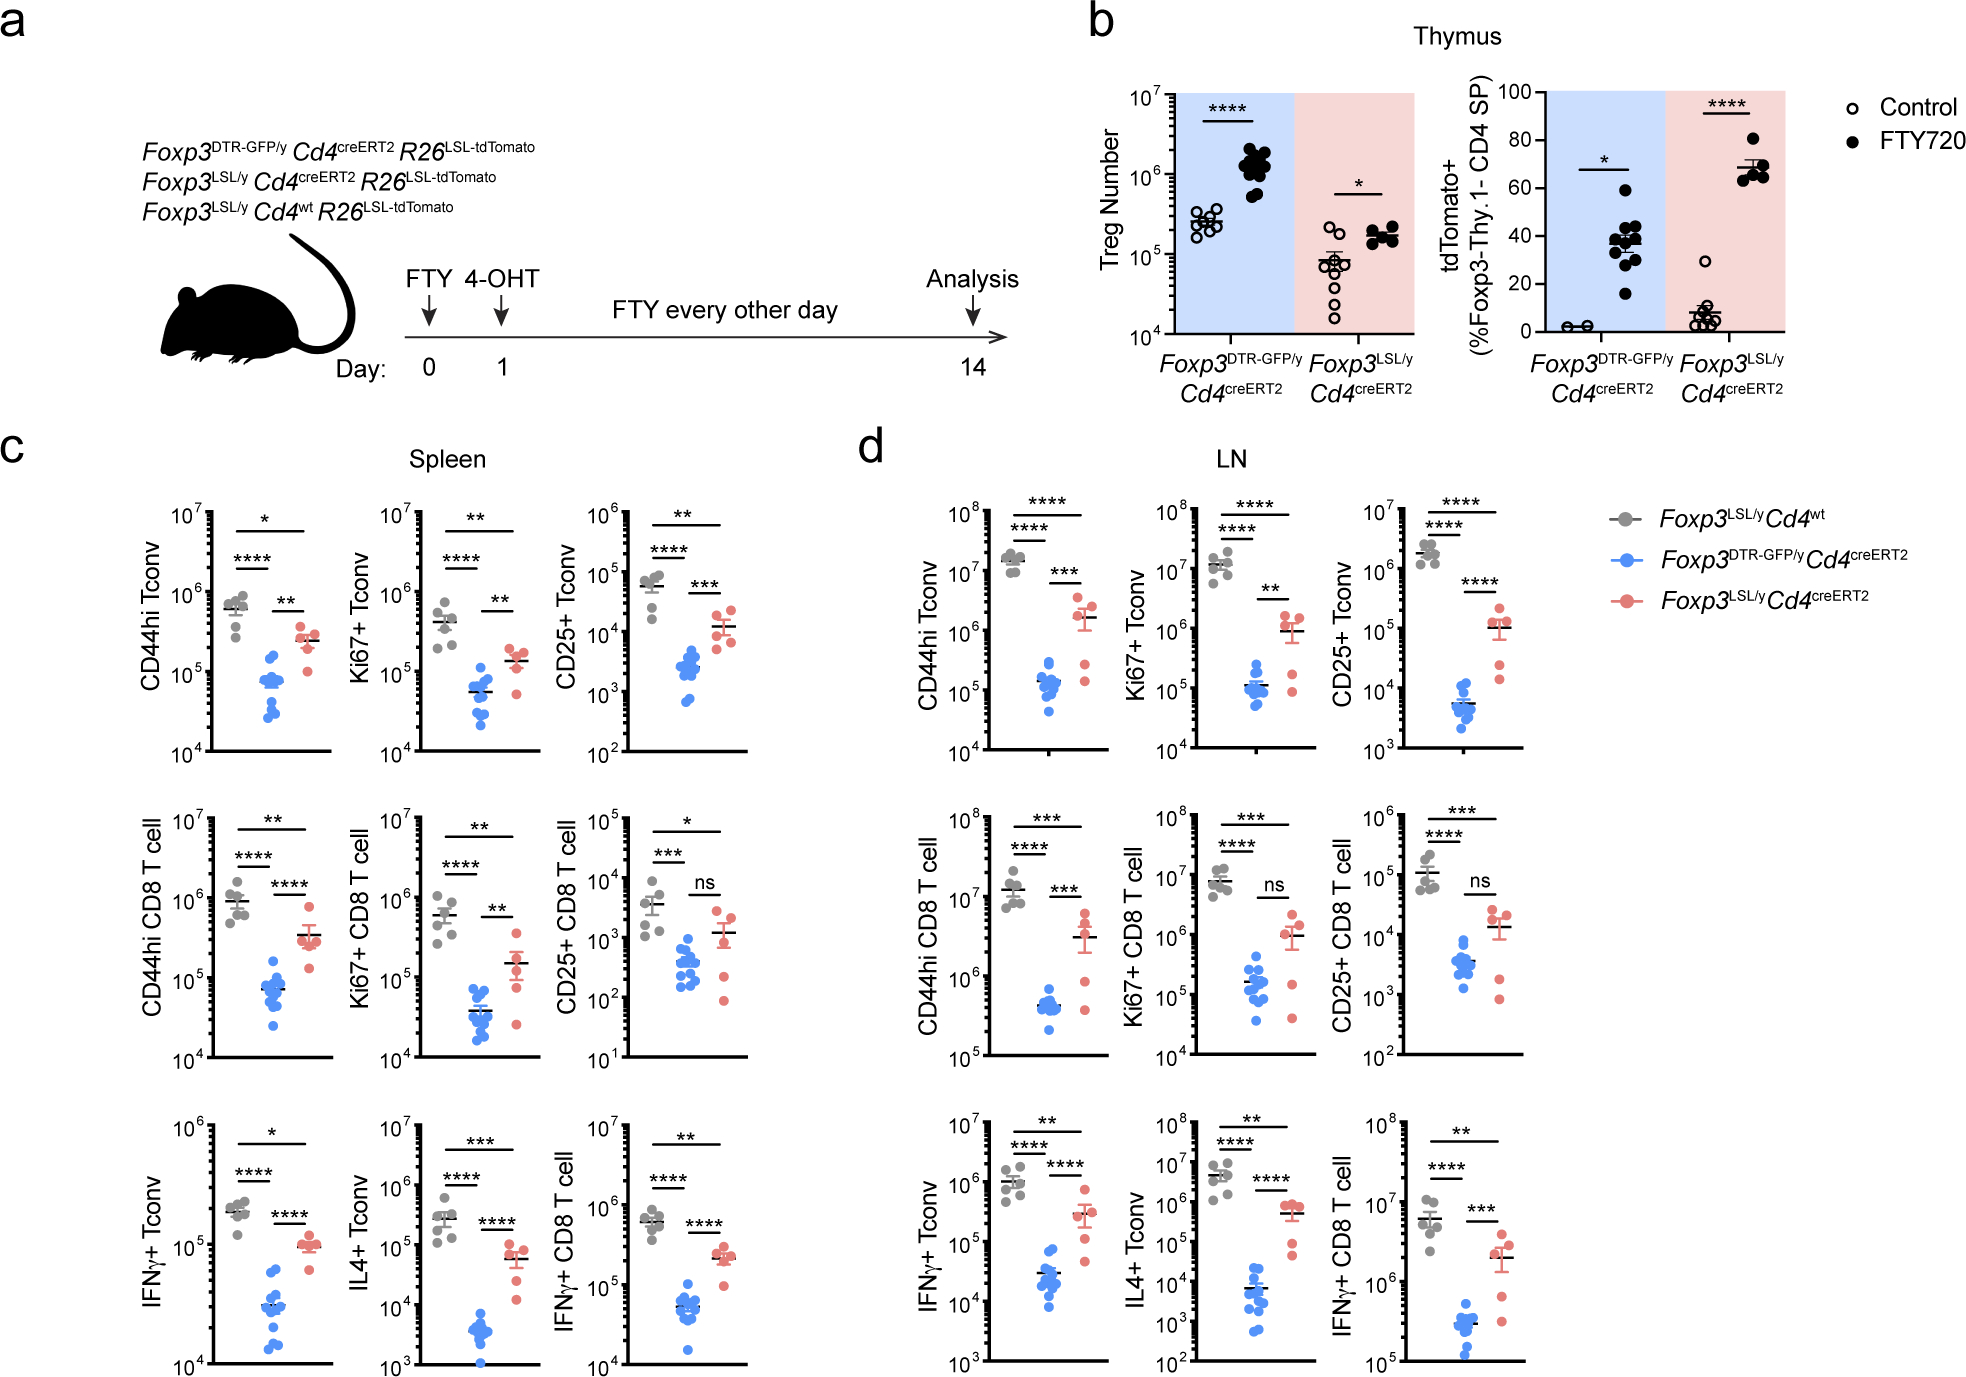
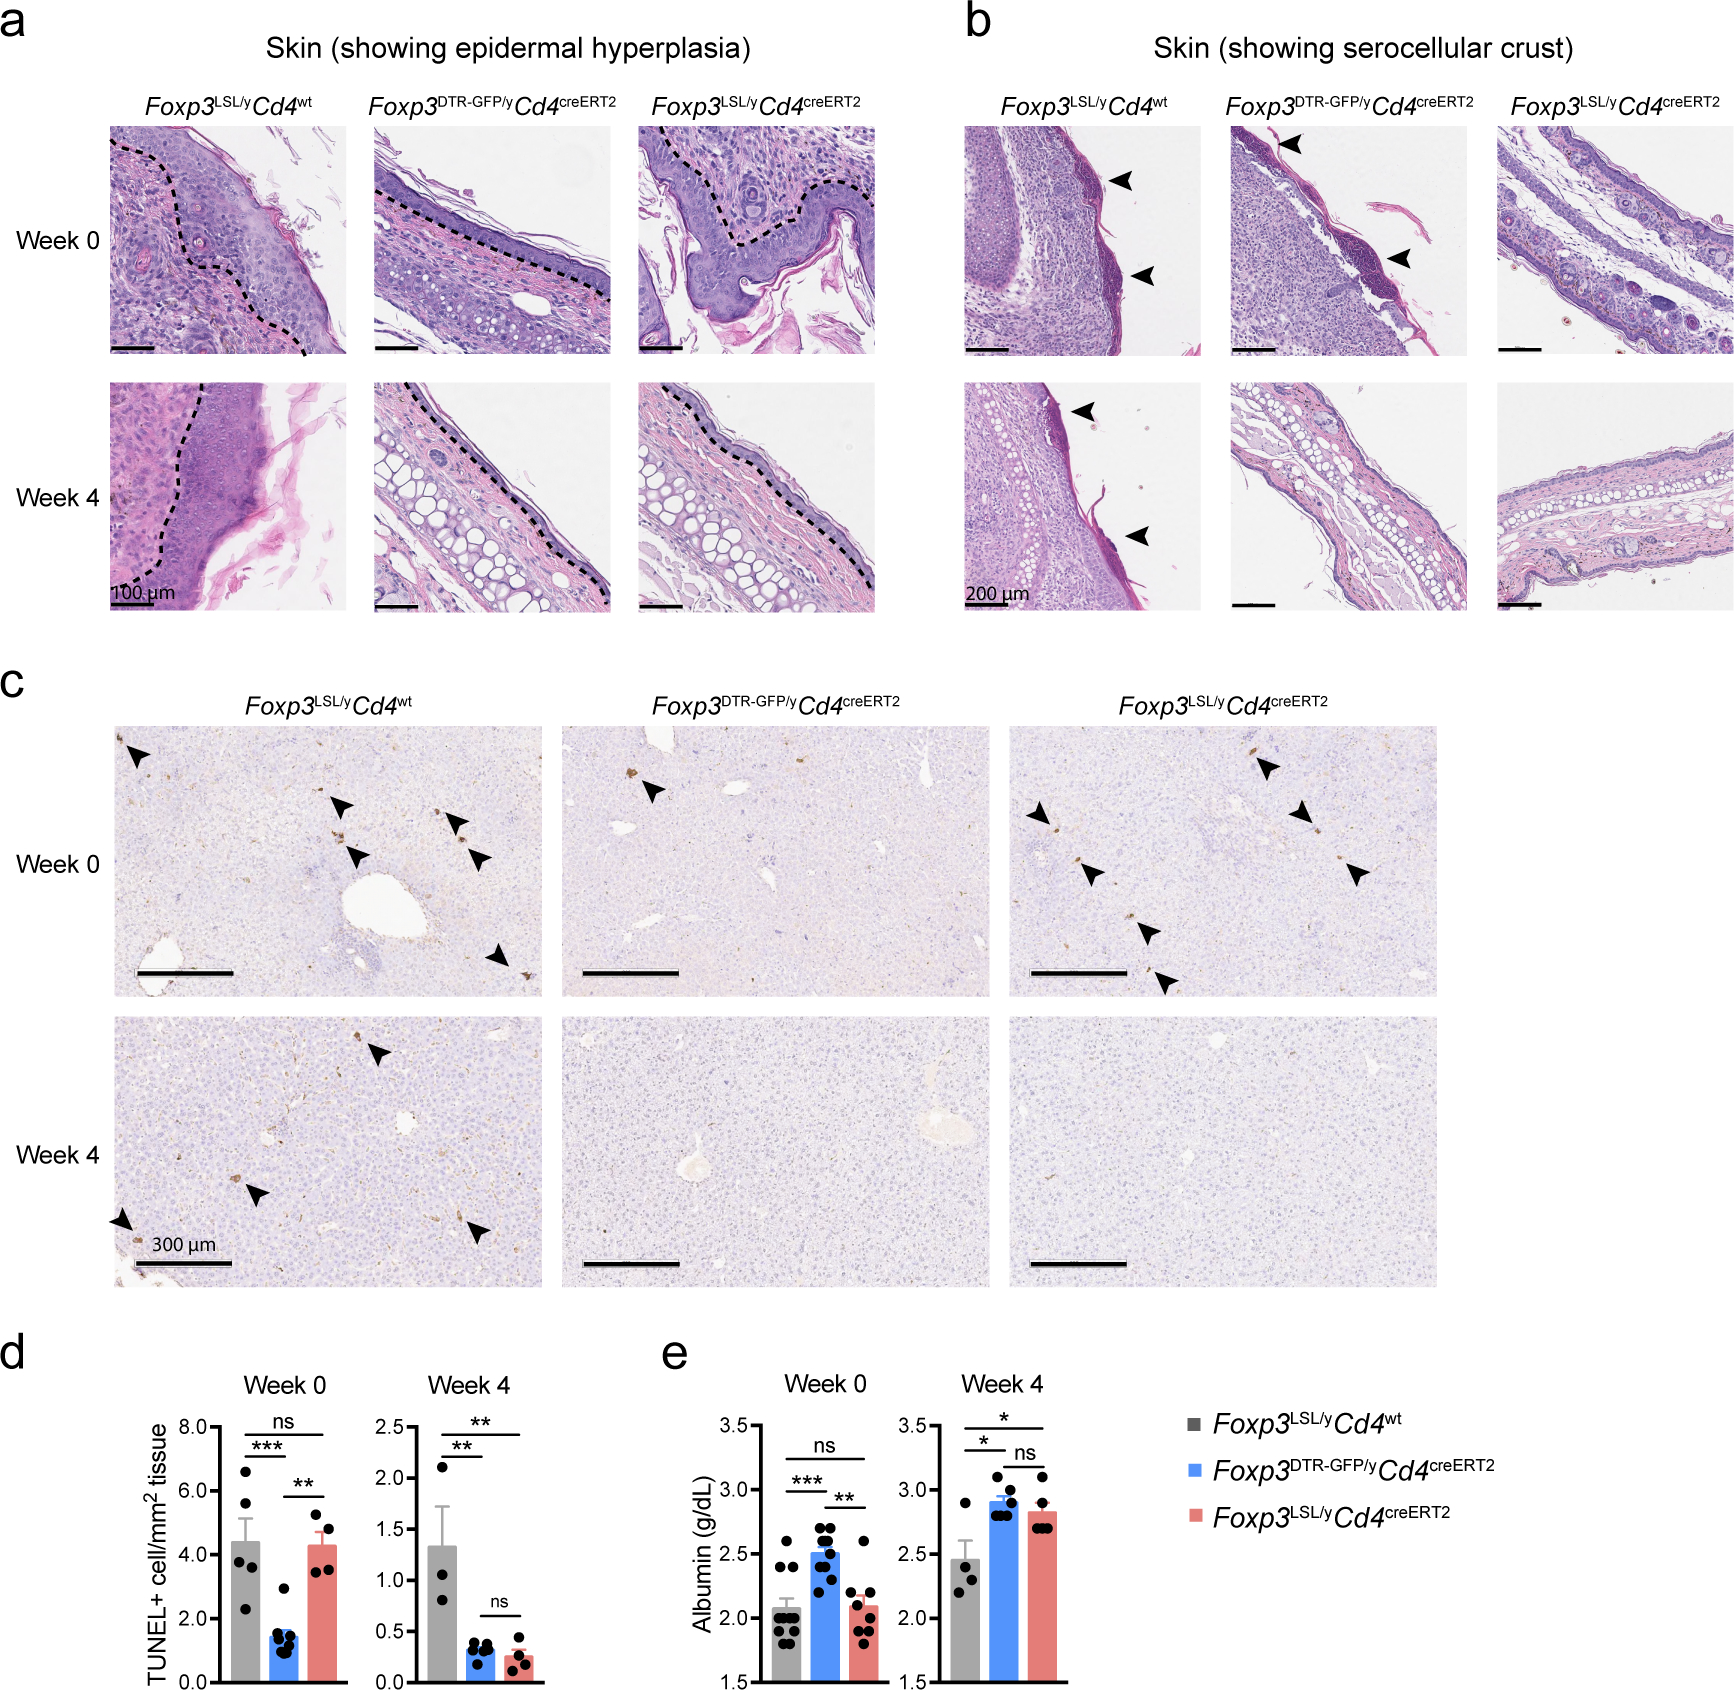
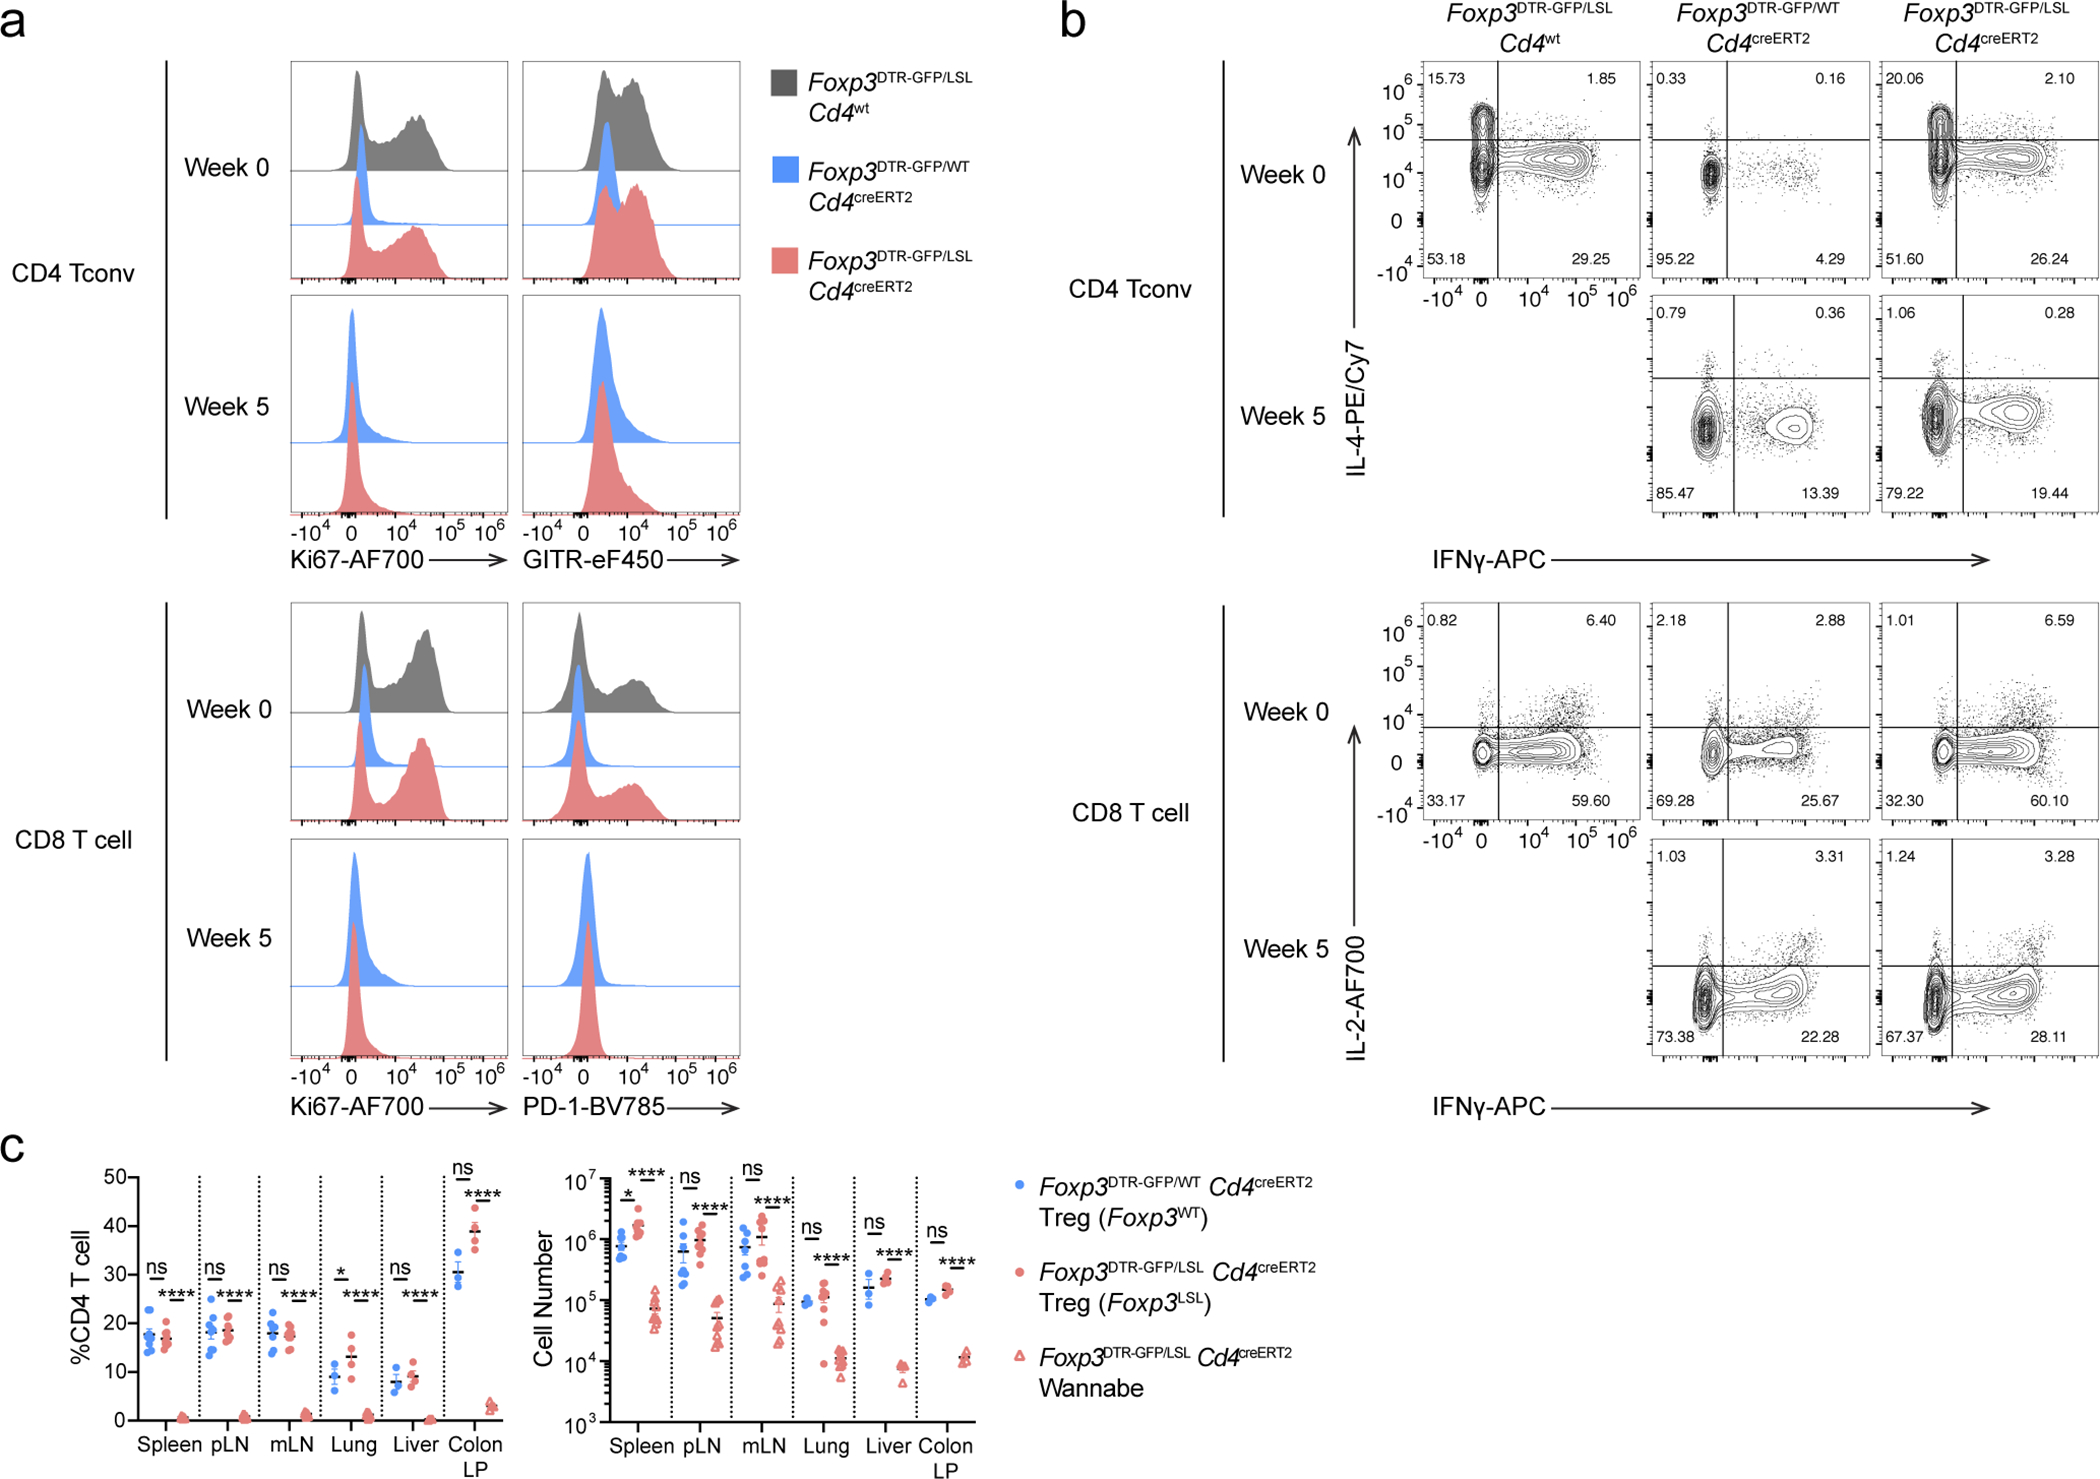
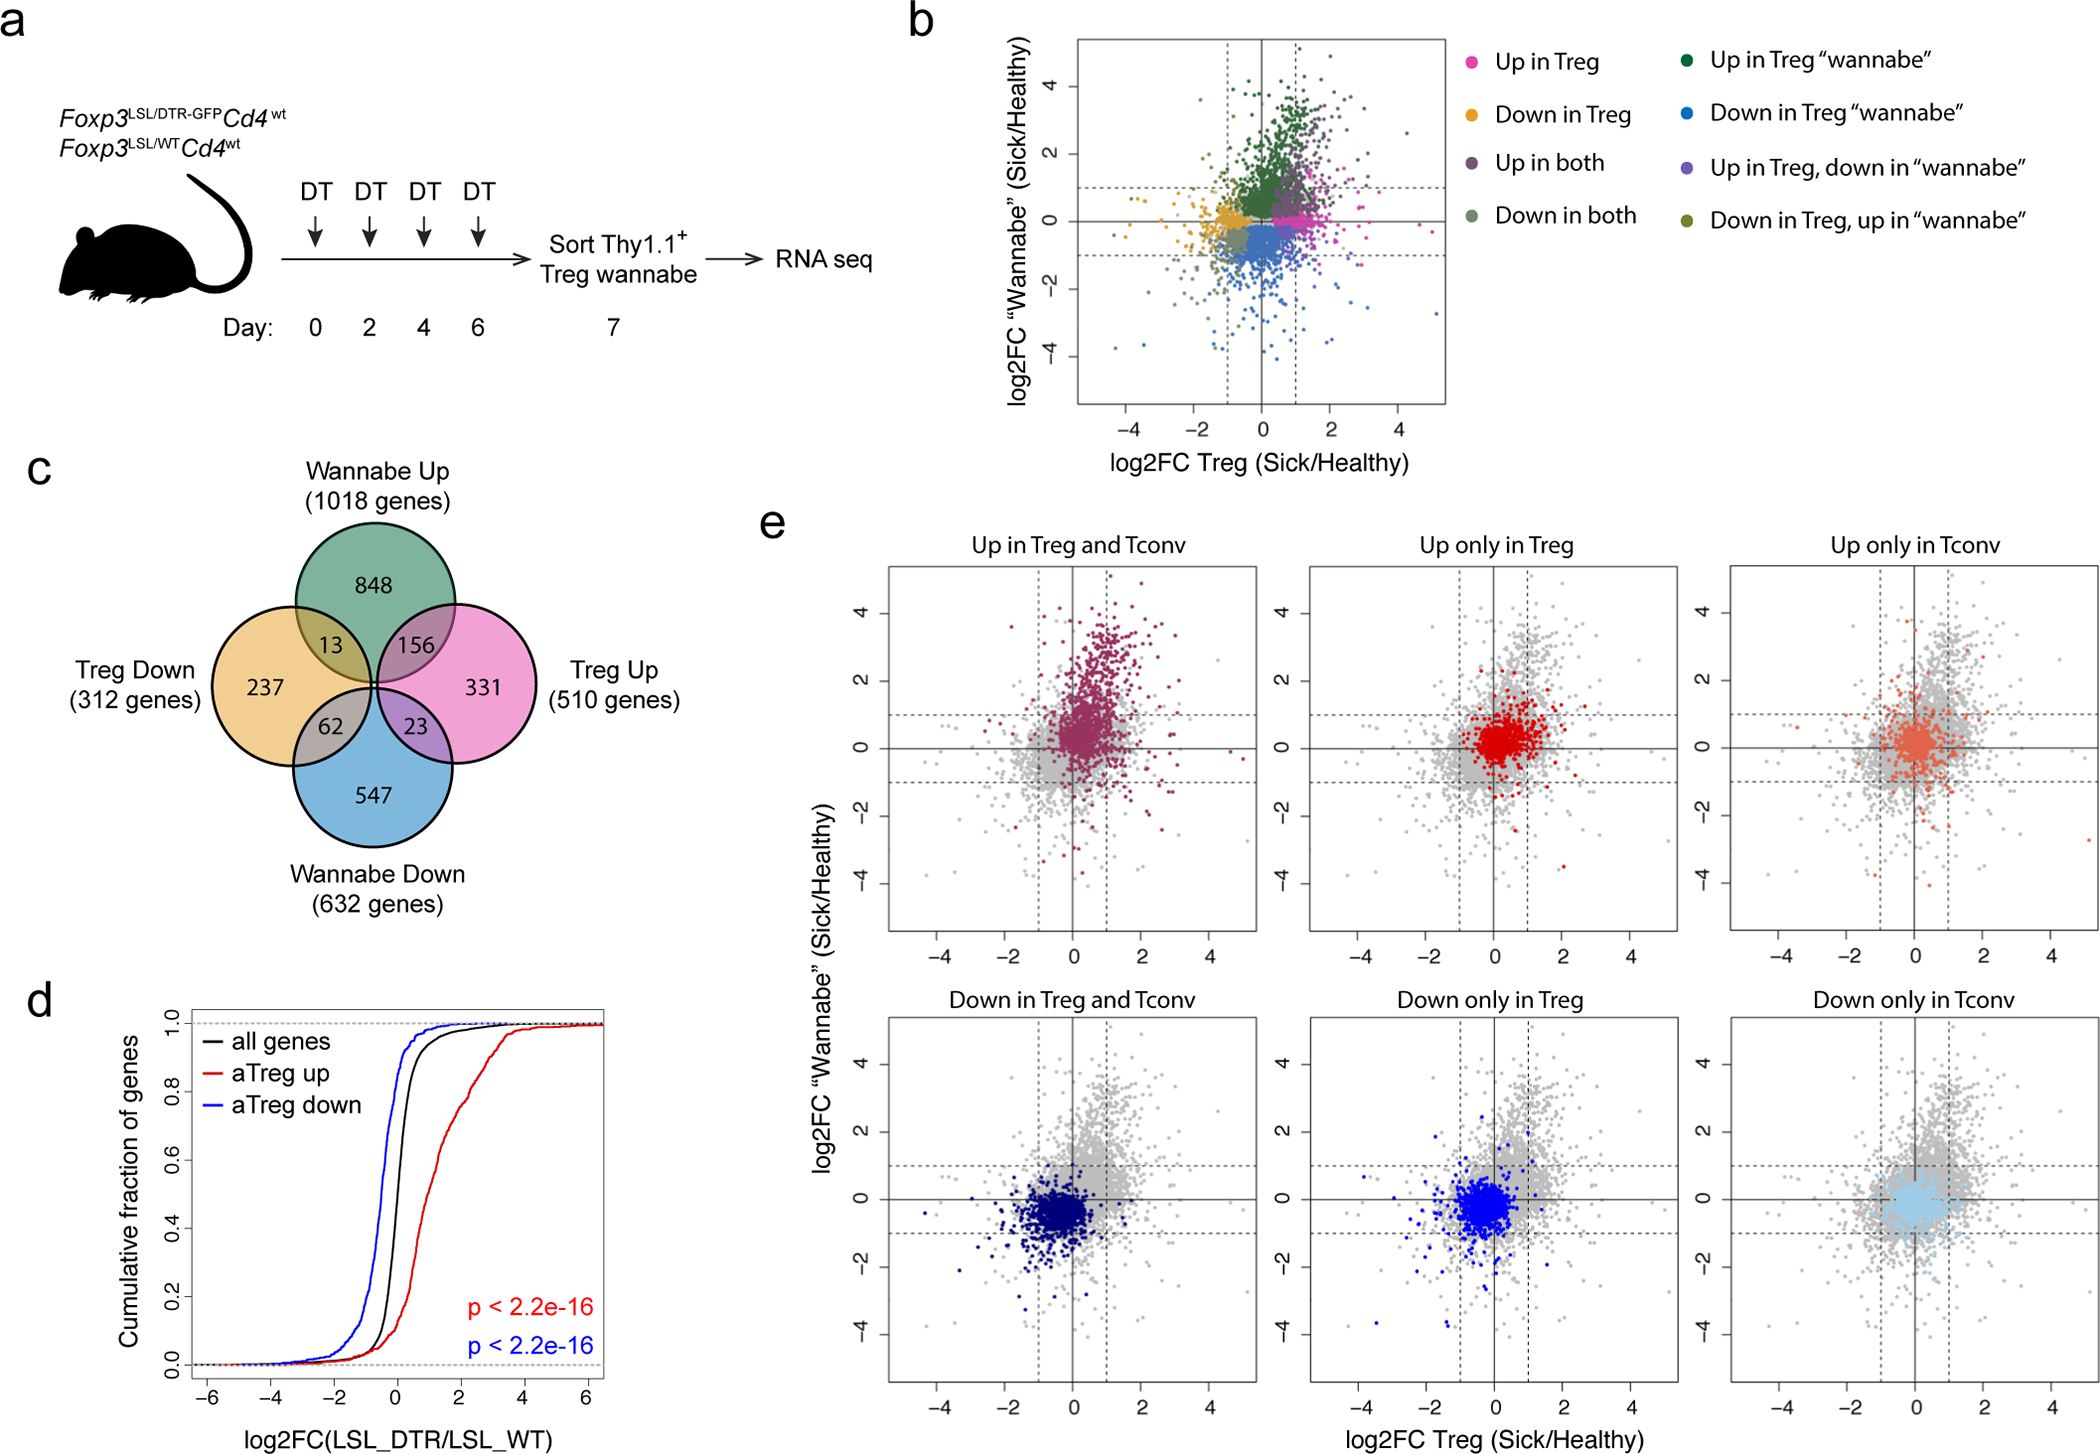
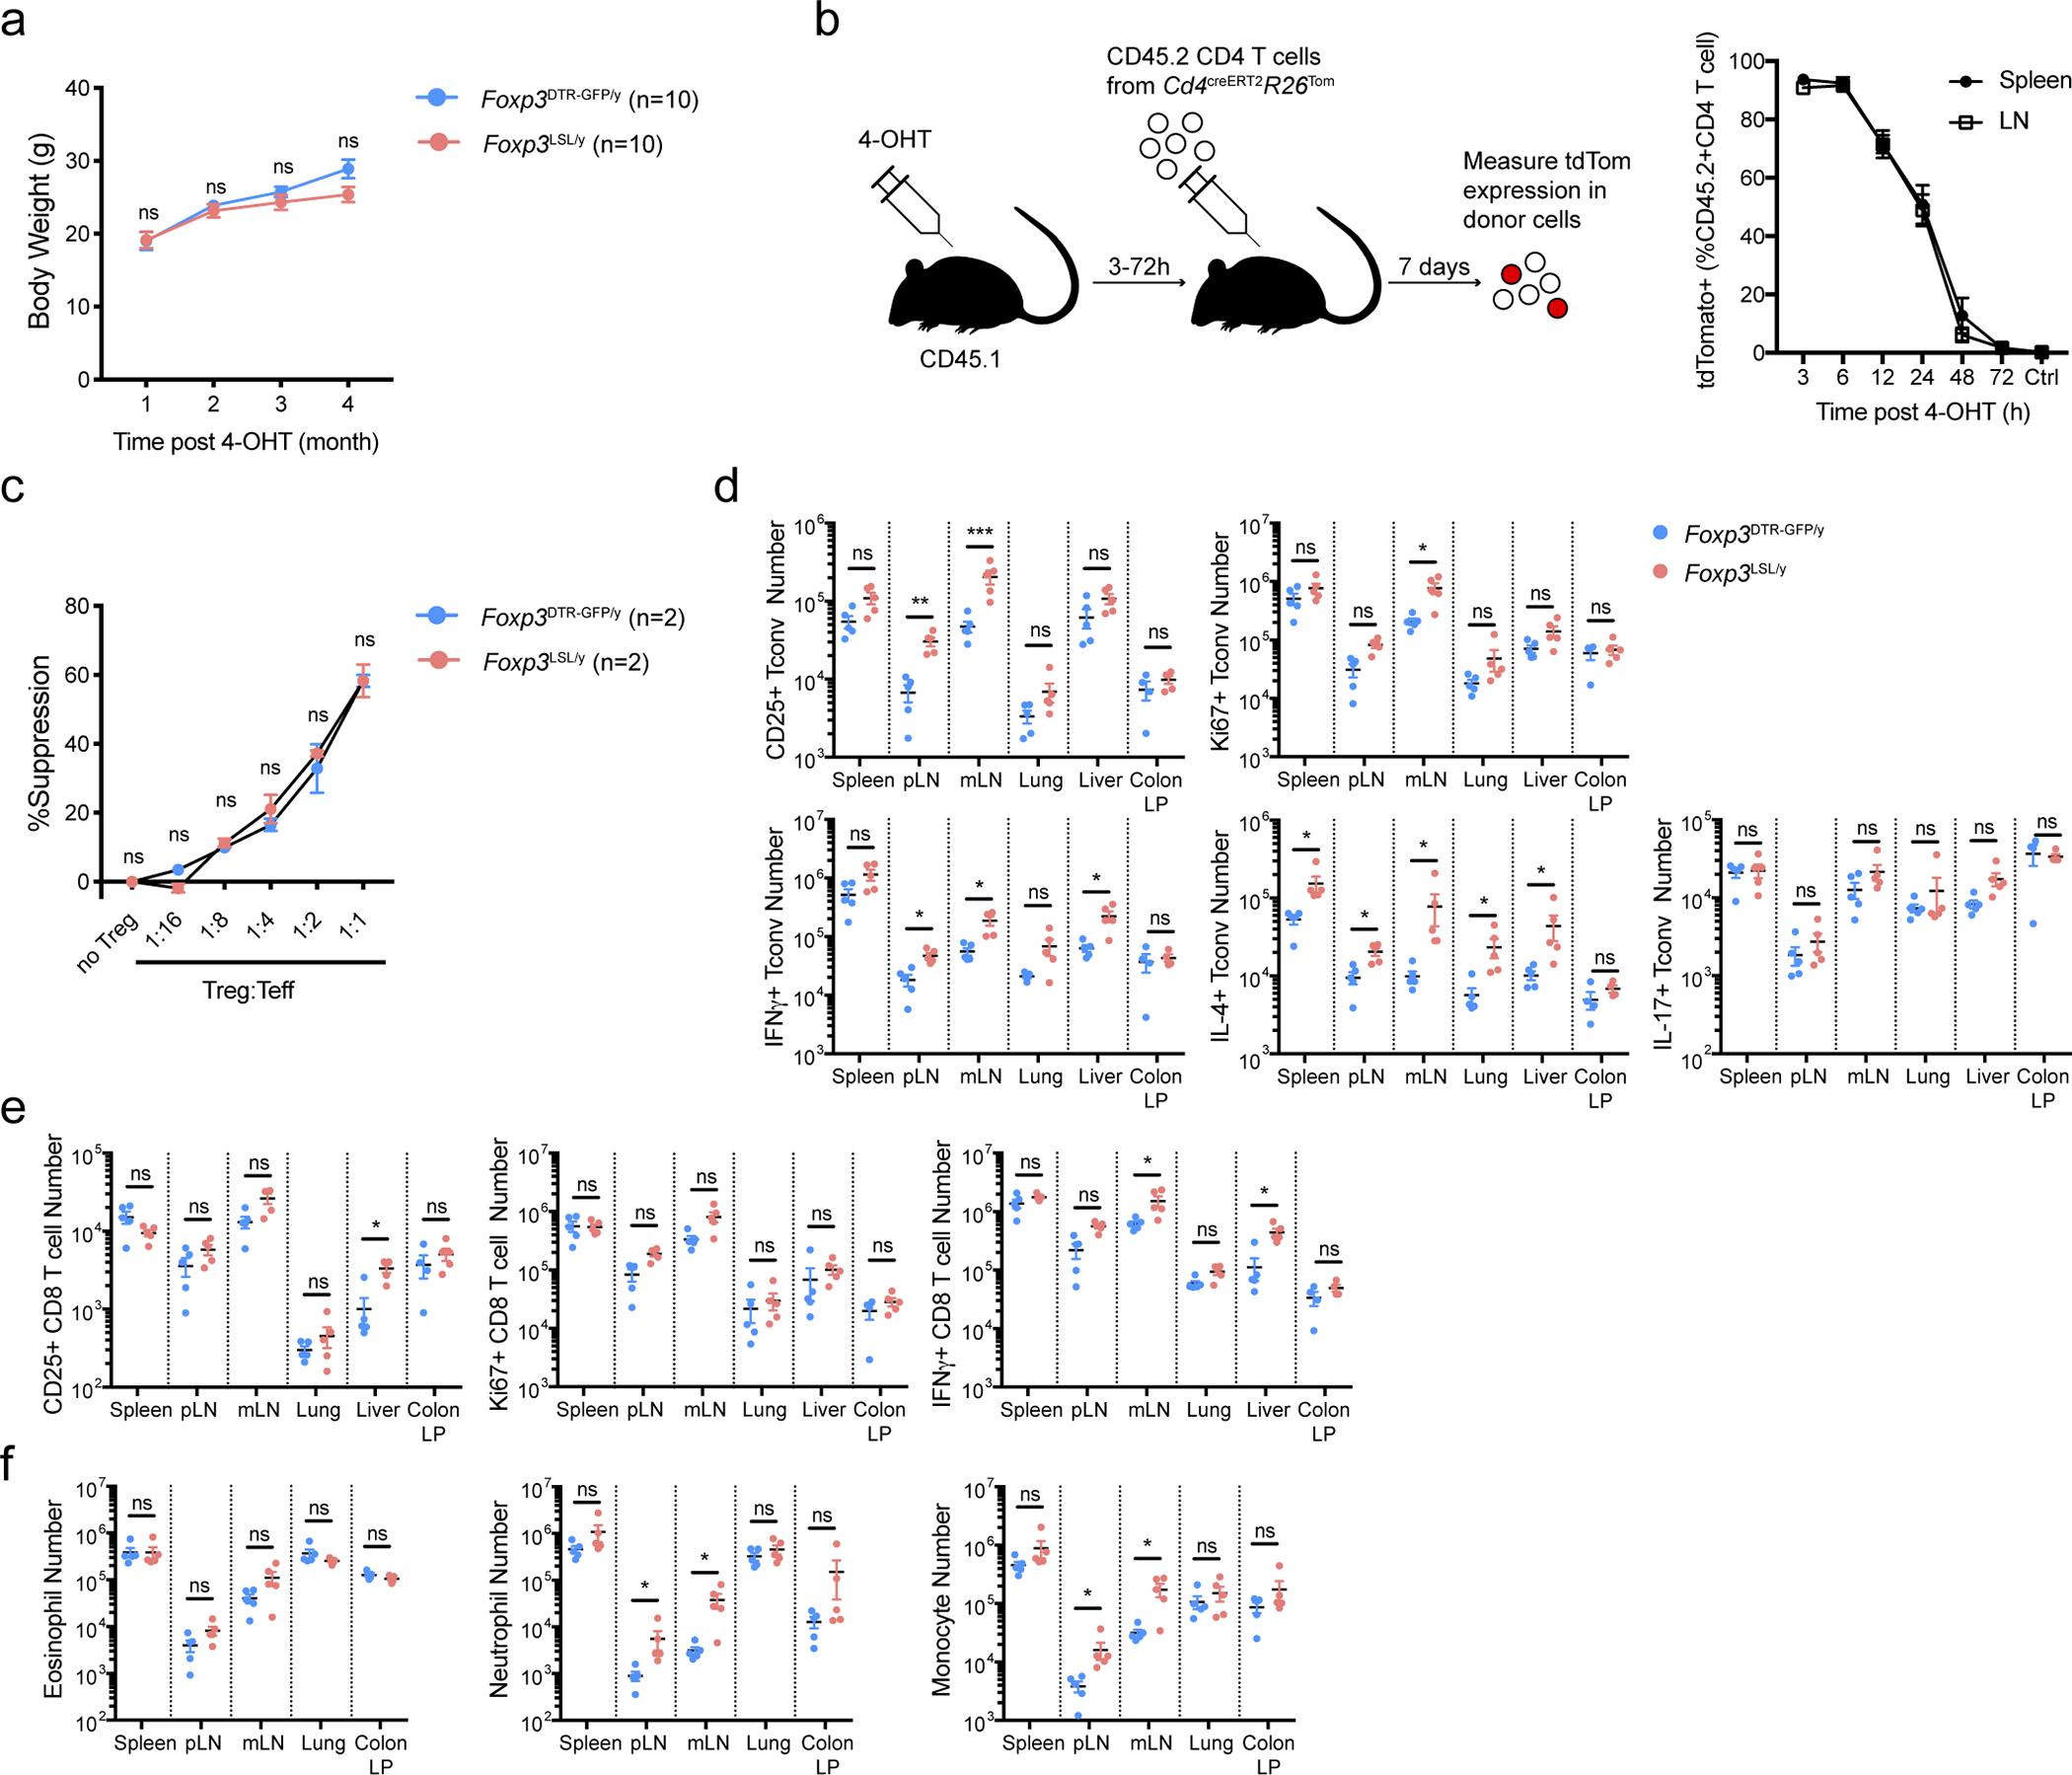
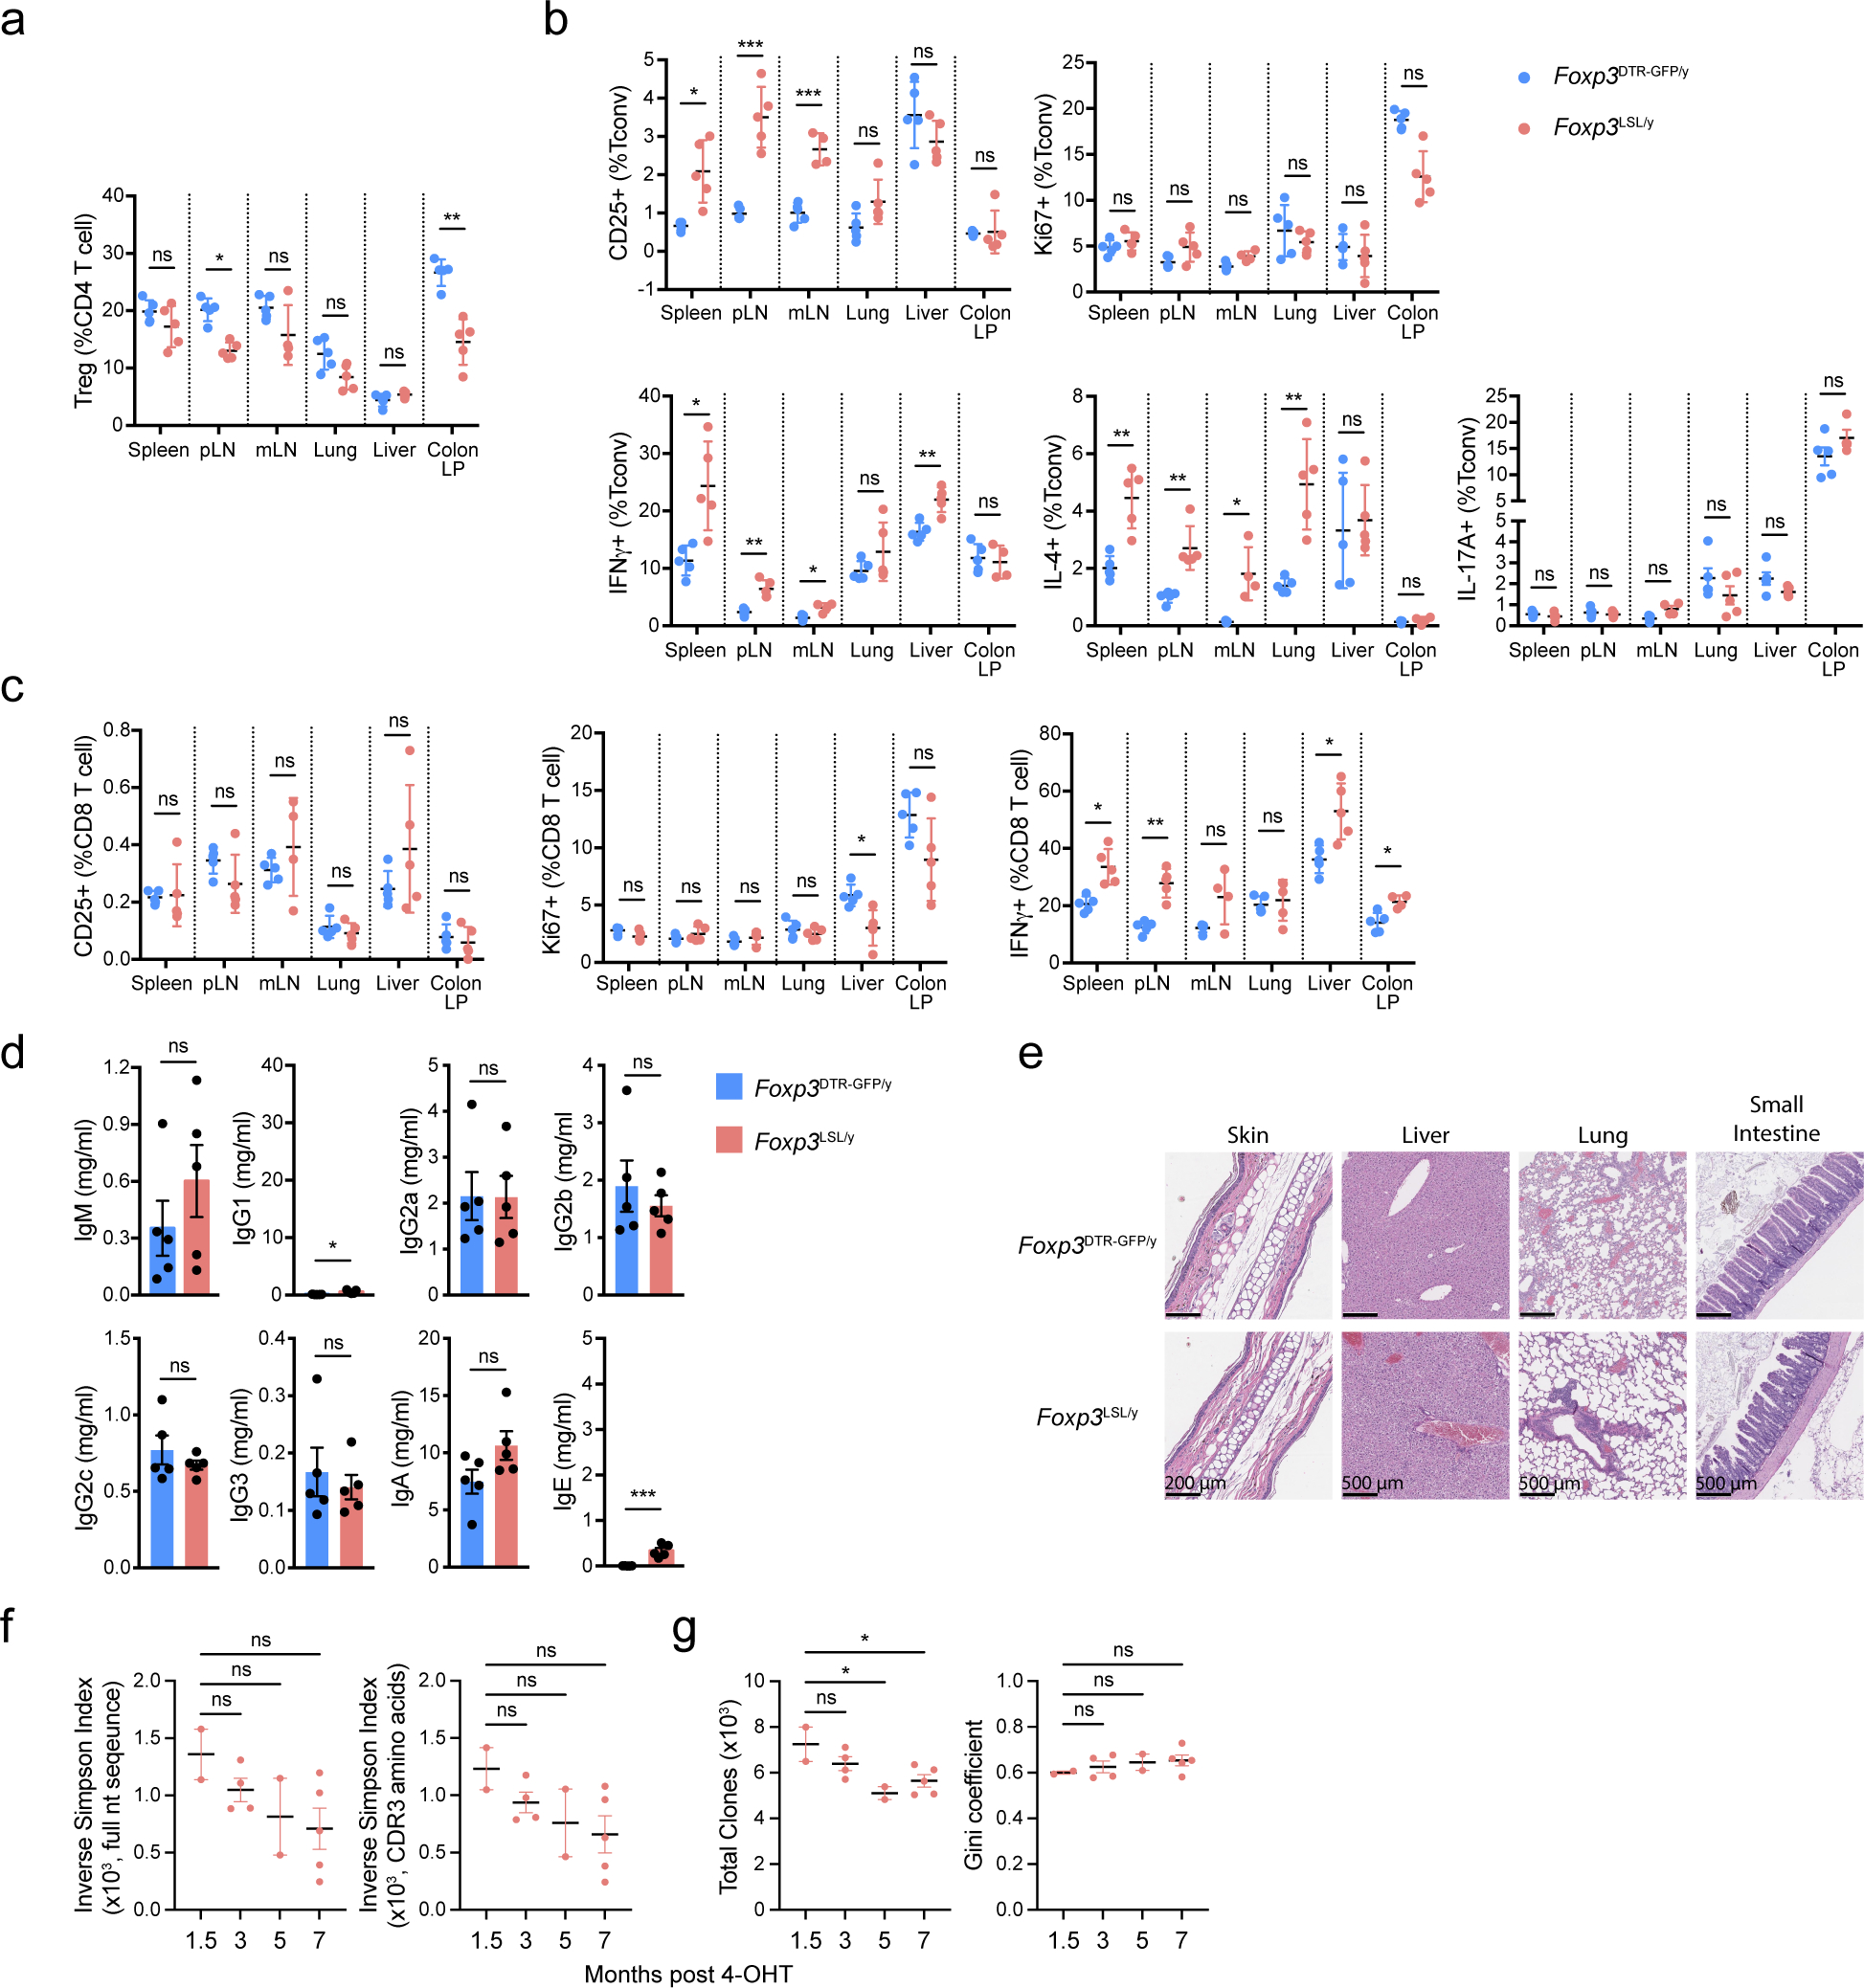
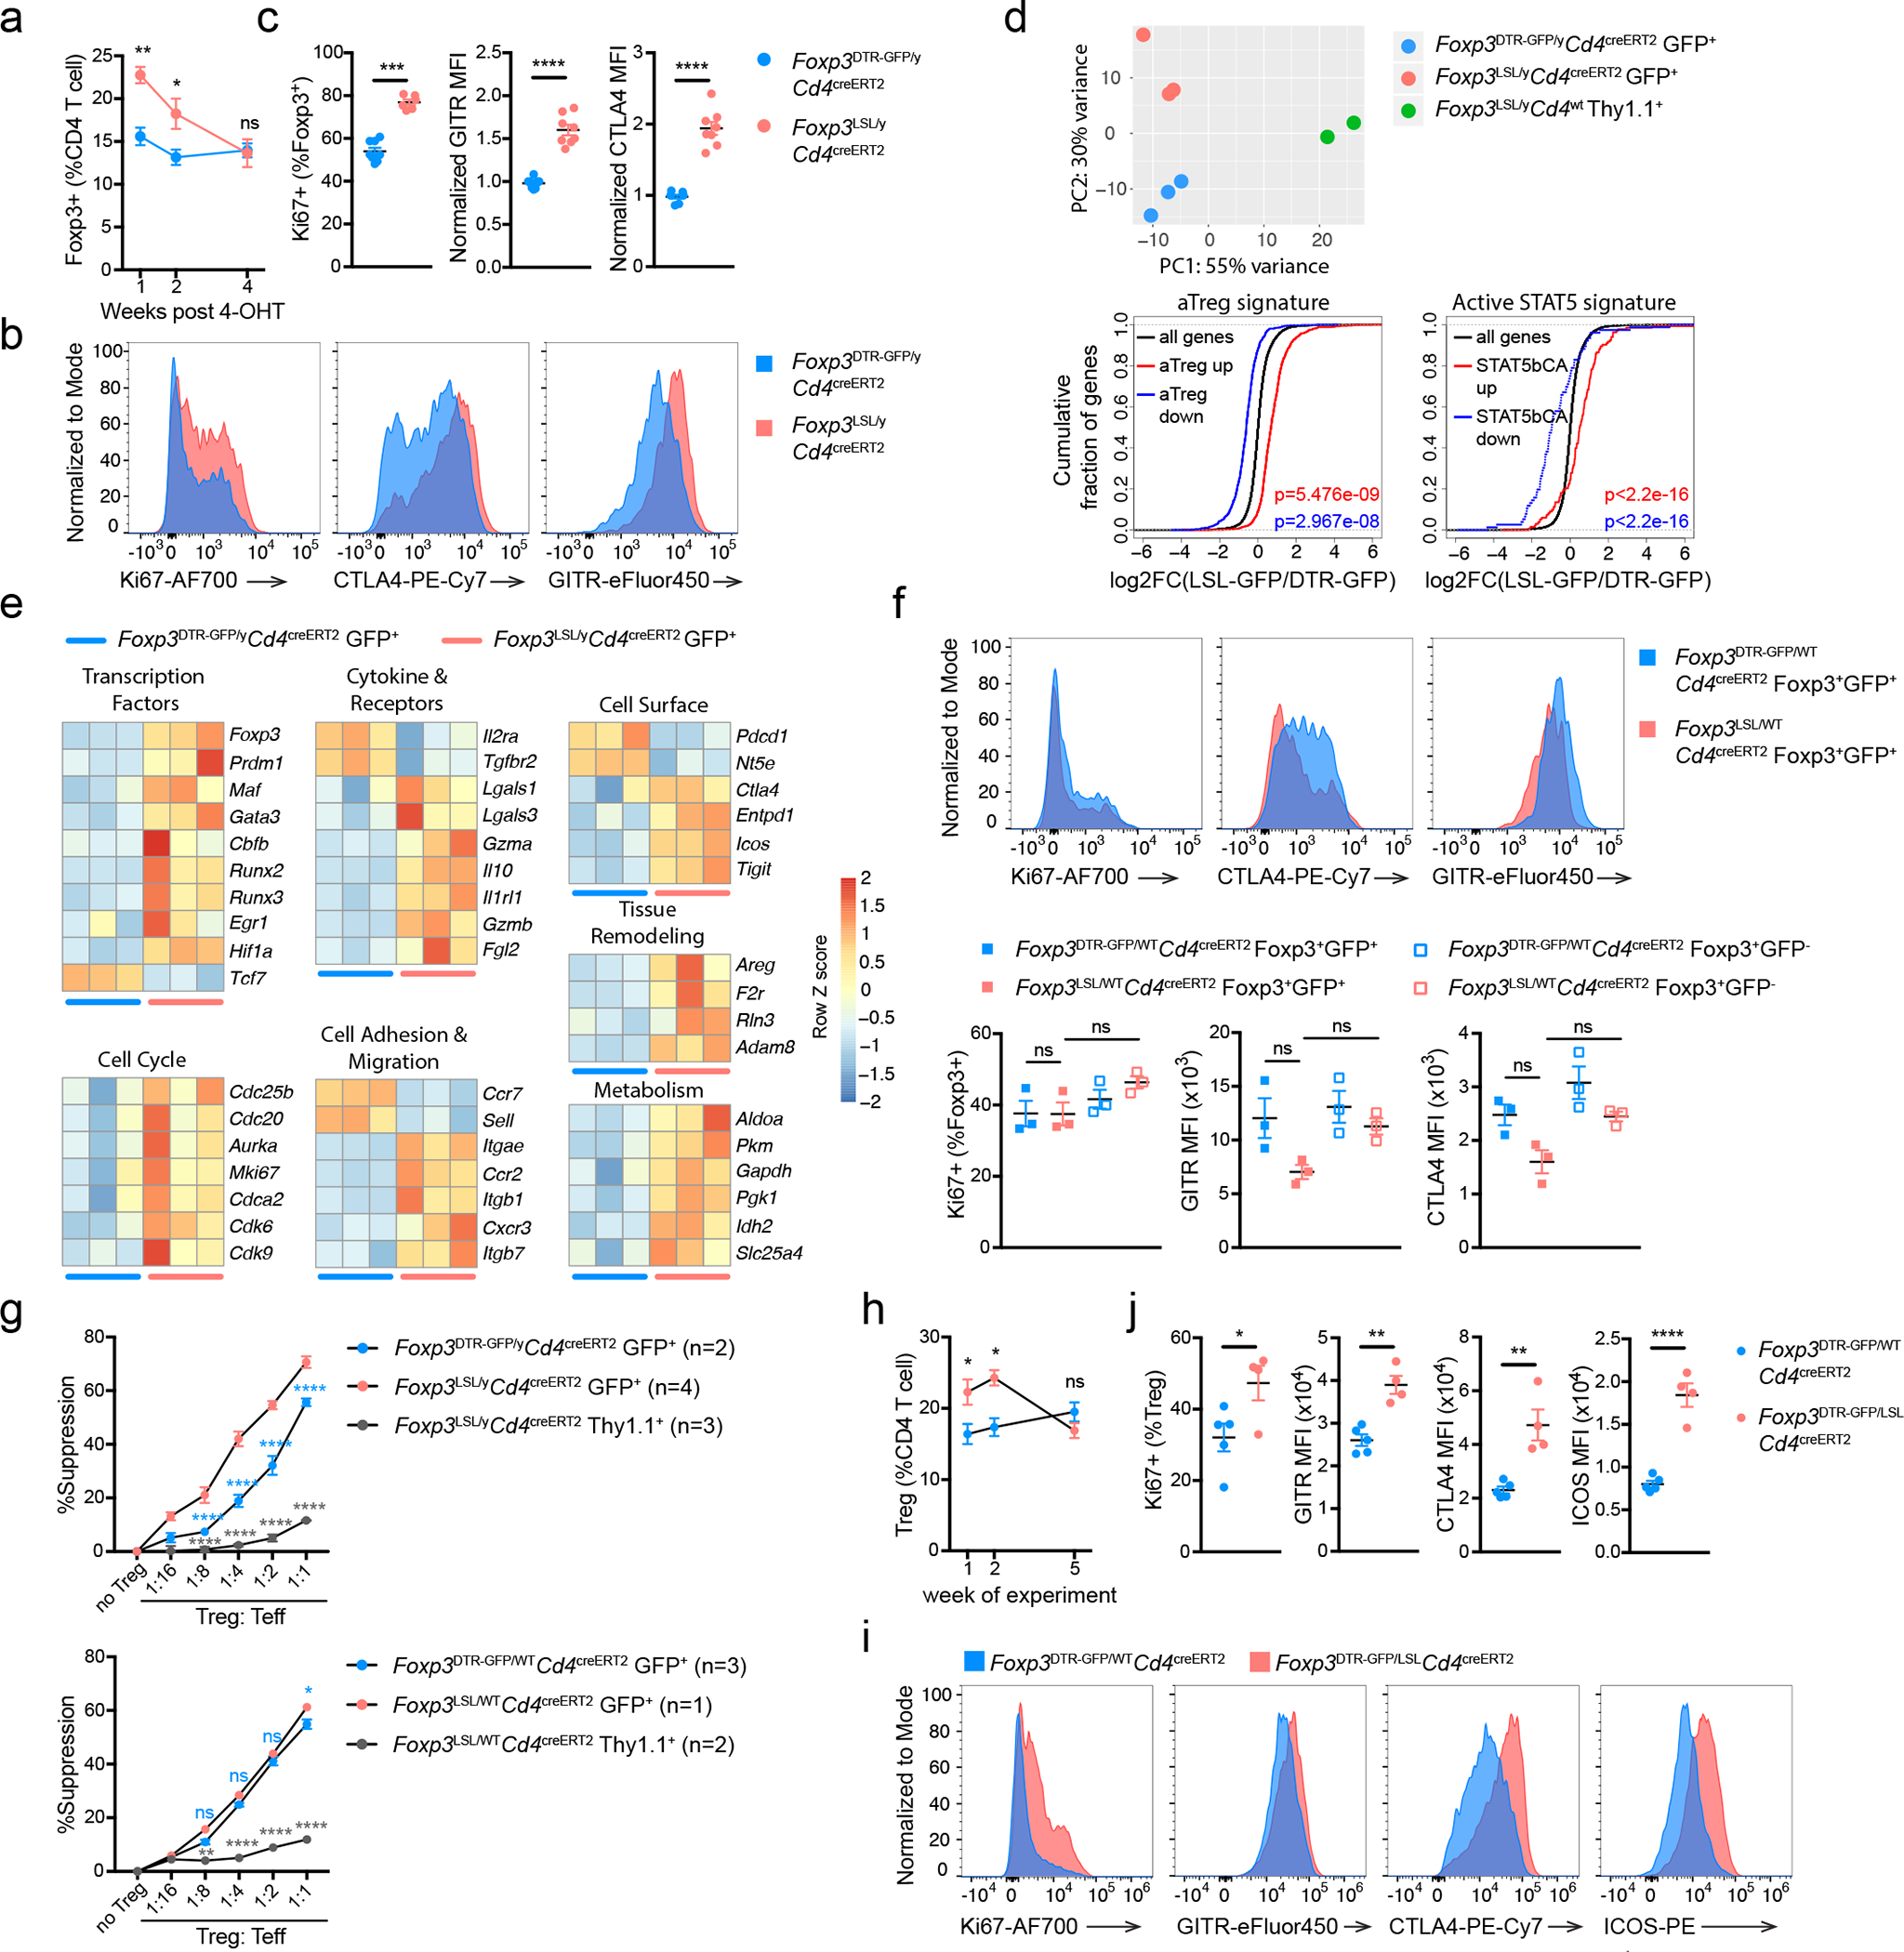
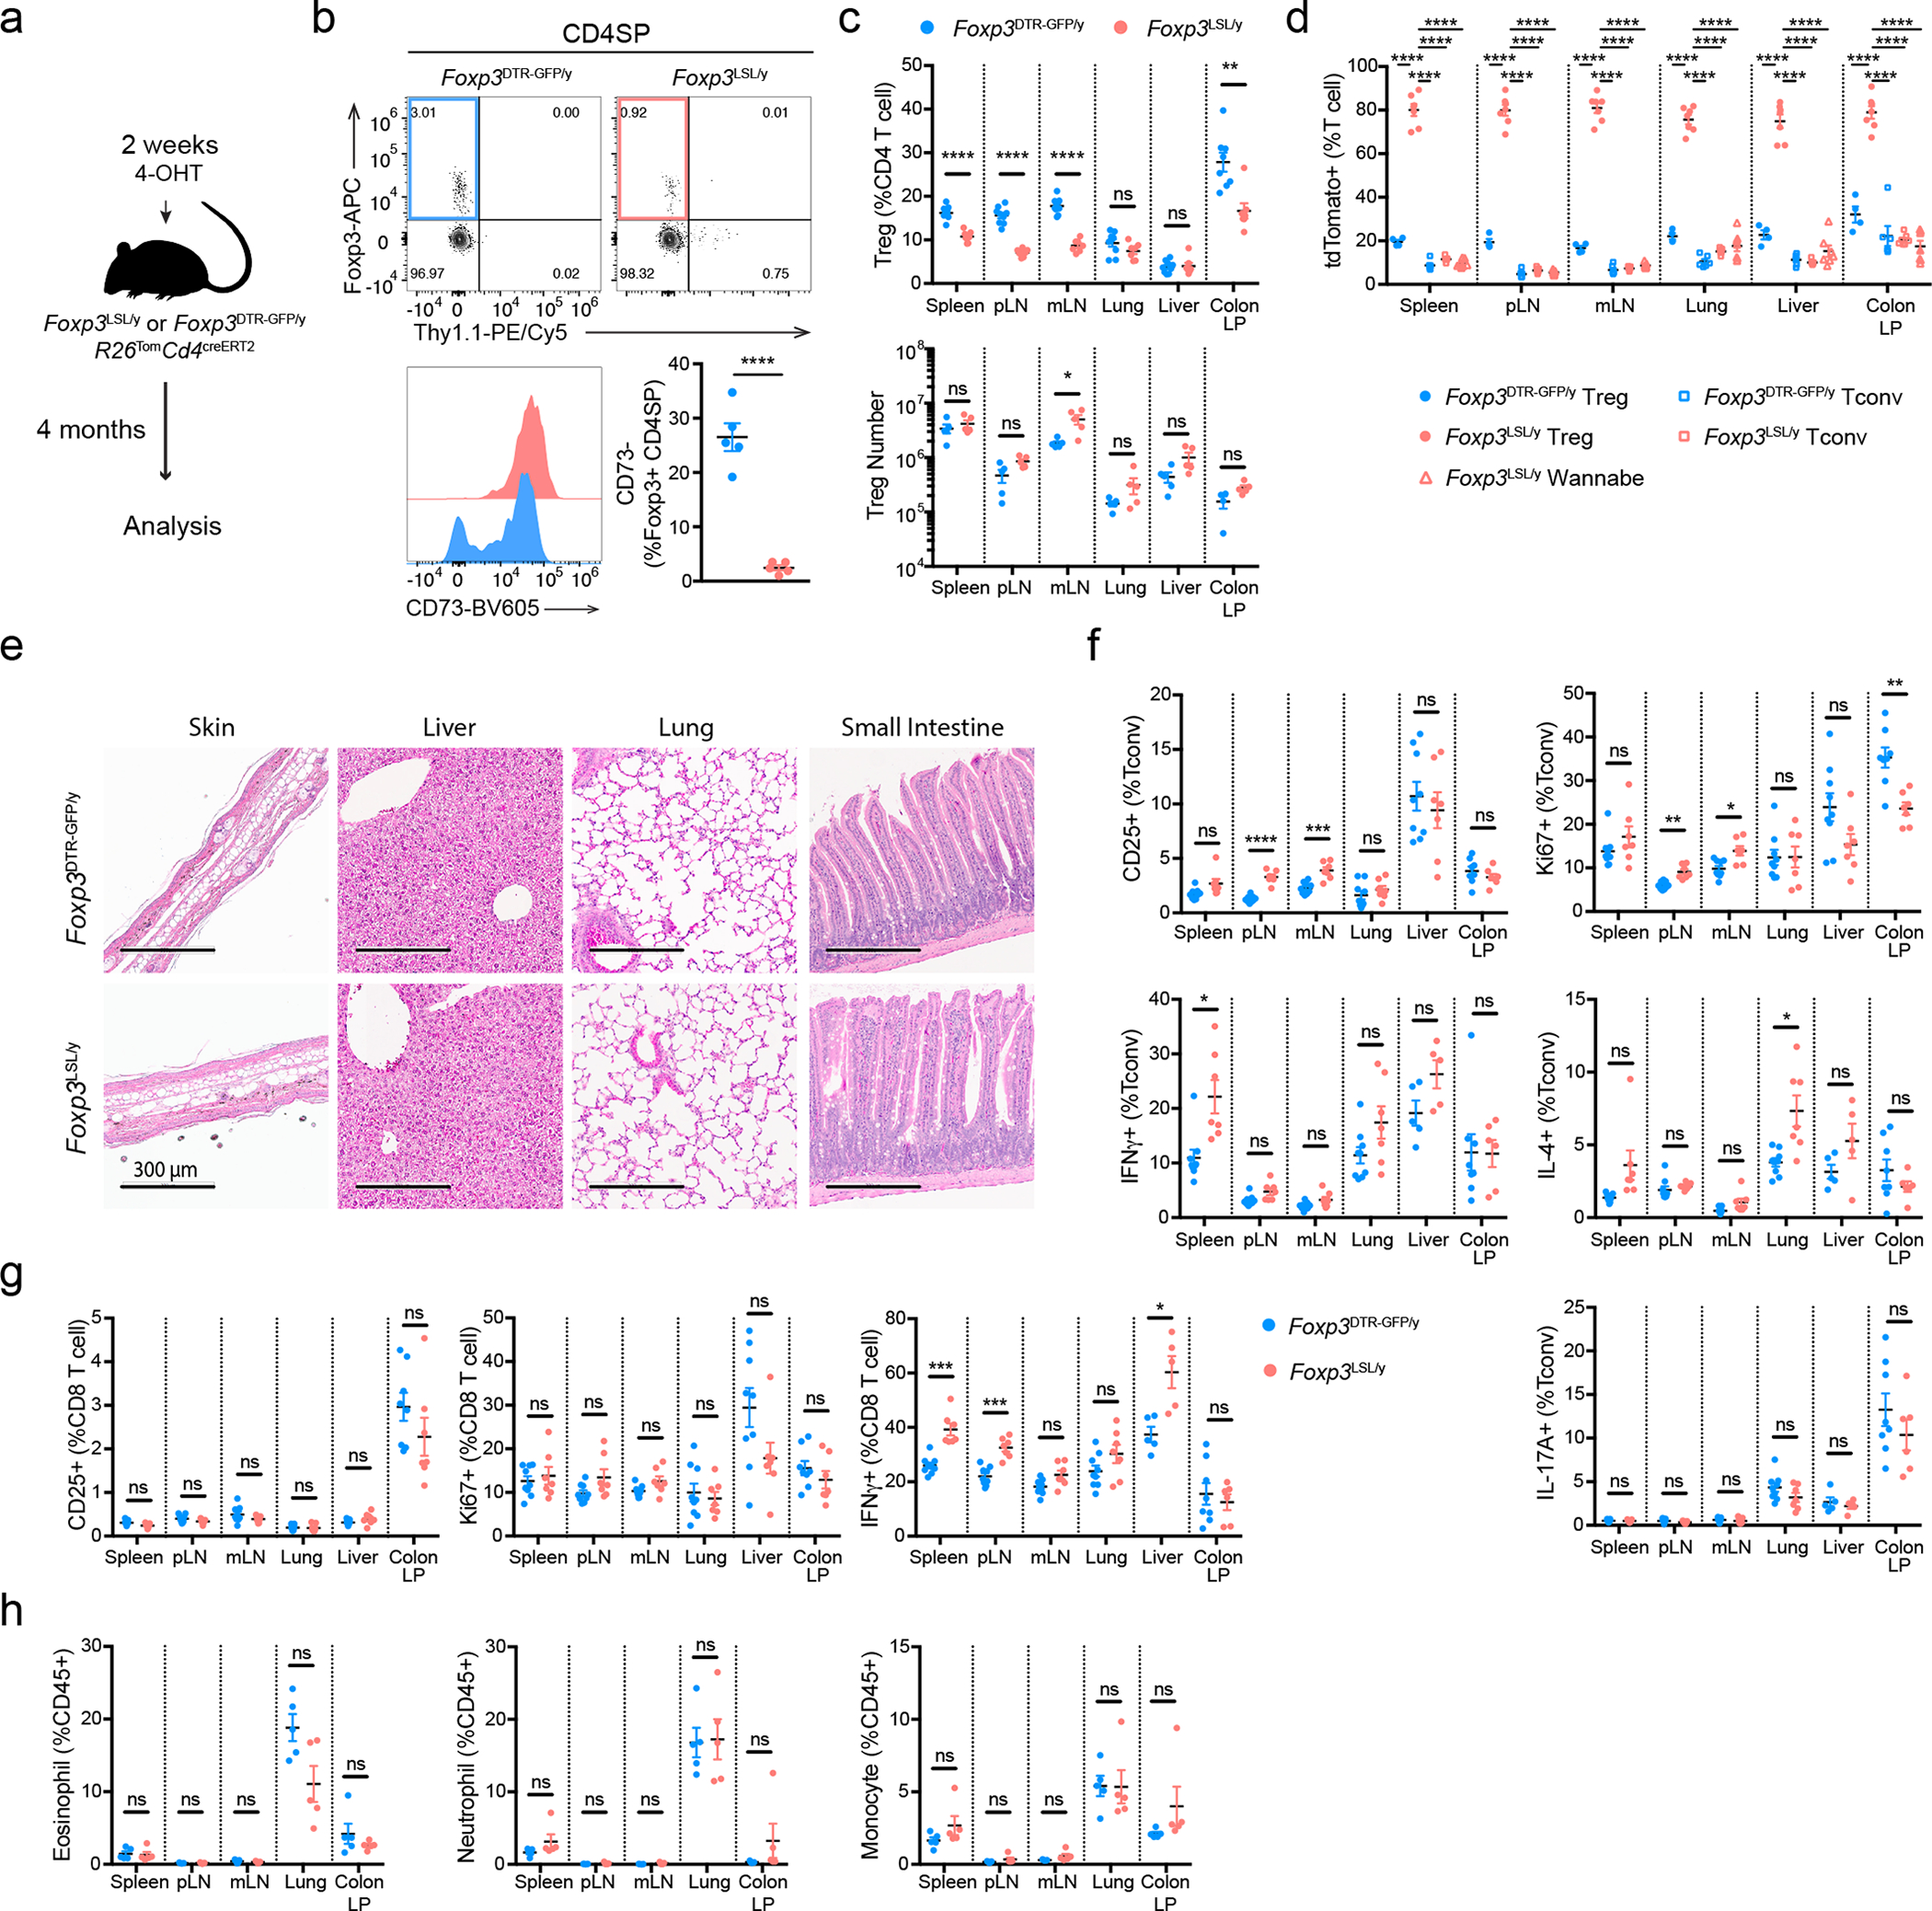
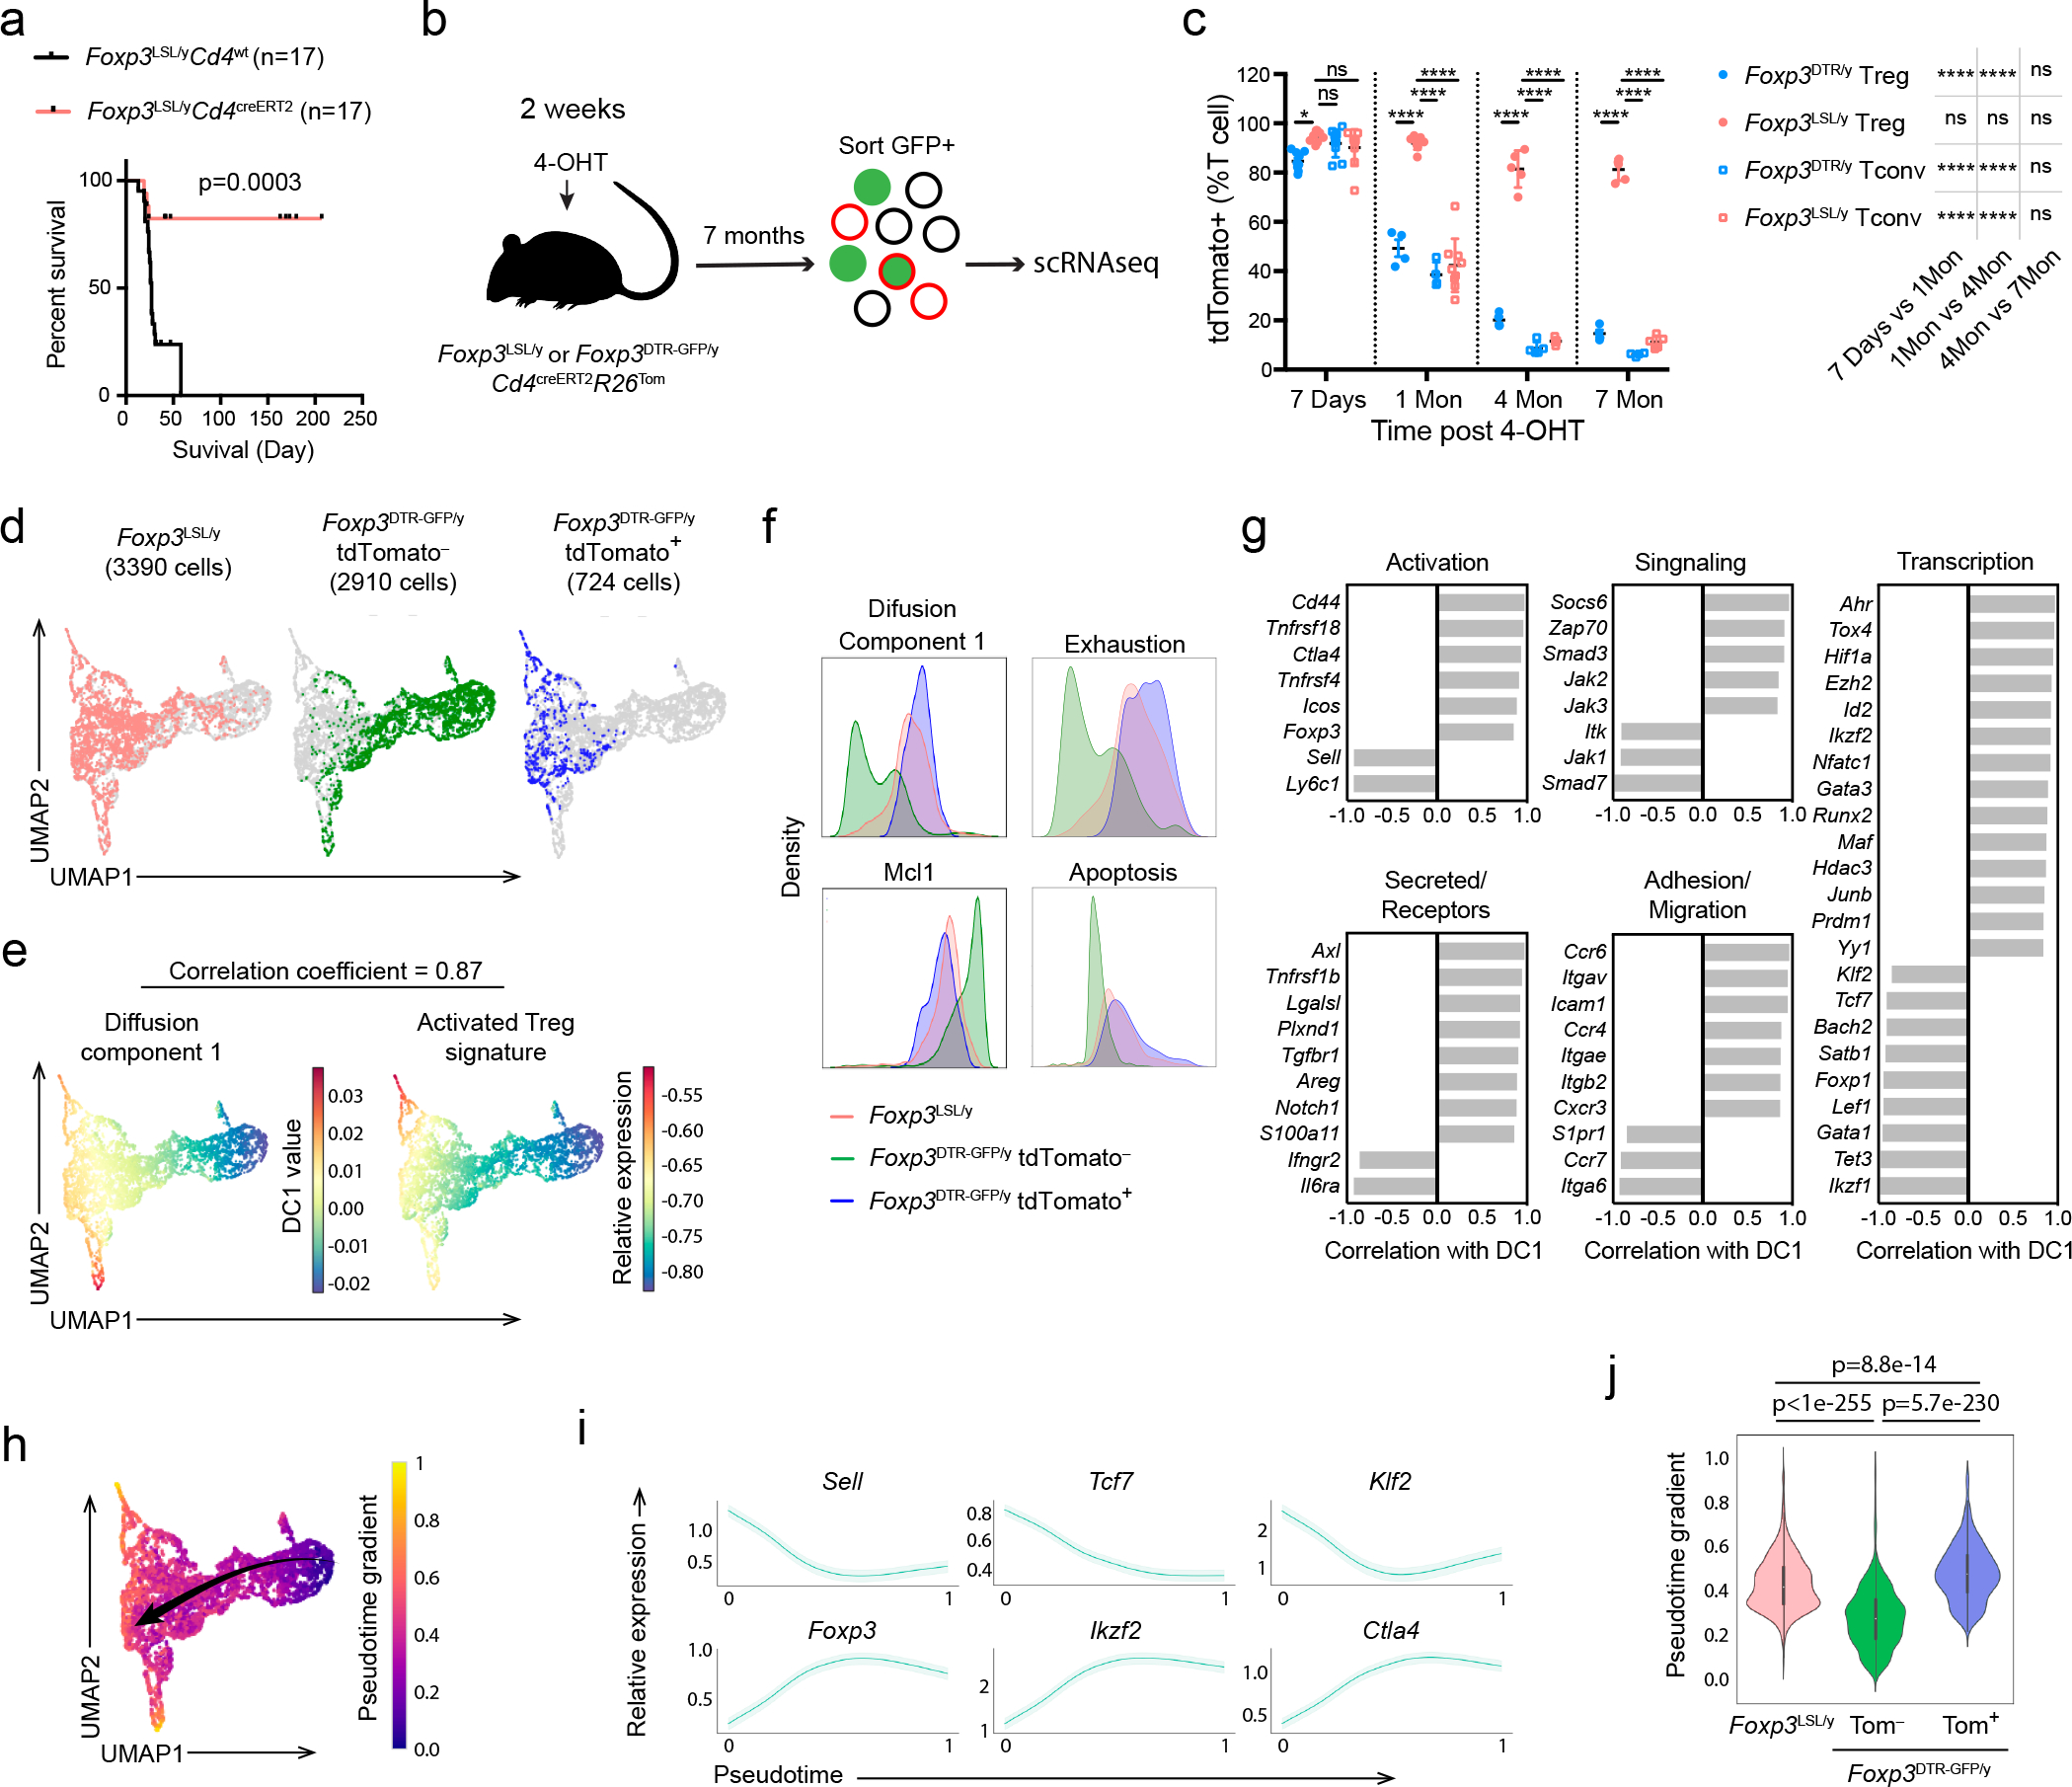
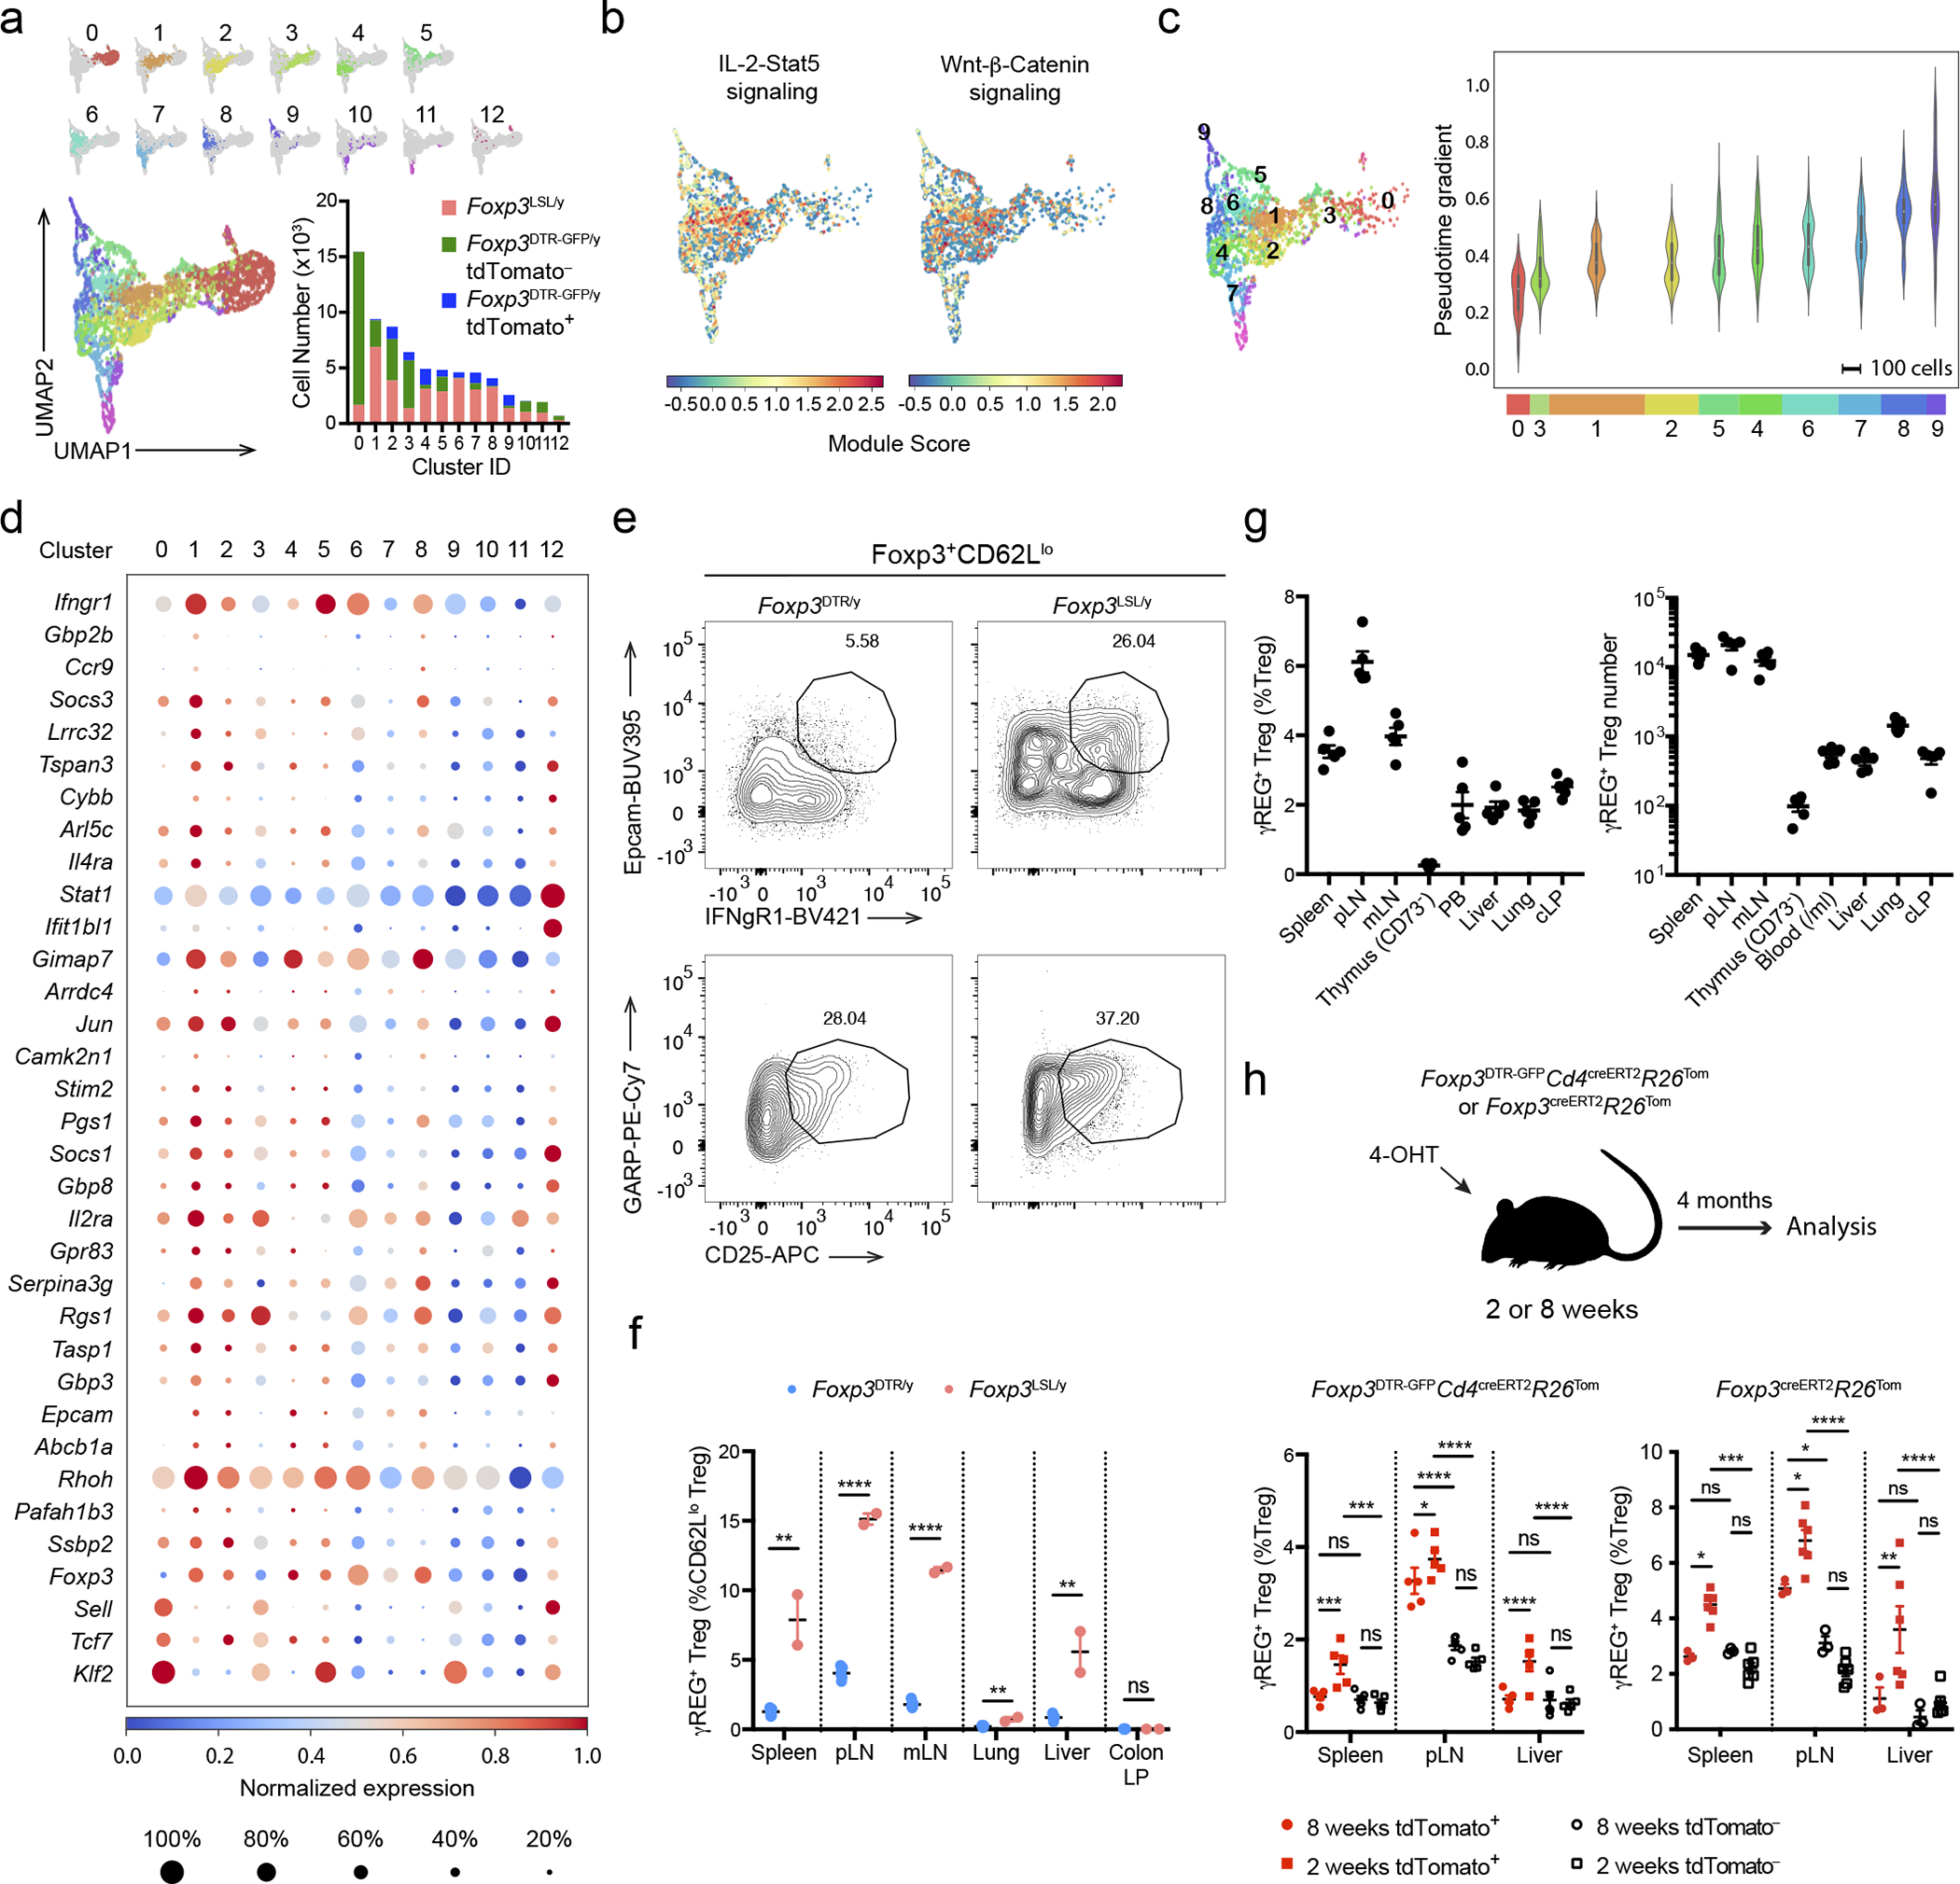
The immunosuppressive function of regulatory T (Treg) cells is dependent on continuous expression of the transcription factor Foxp3. Foxp3 loss of function or induced ablation of Treg cells results in a fatal autoimmune disease featuring all known types of inflammatory responses with every manifestation stemming from Treg cell paucity, highlighting a vital function of Treg cells in preventing fatal autoimmune inflammation. However, a major question remains whether Treg cells can persist and effectively exert their function in a disease state, where a broad spectrum of inflammatory mediators can either inactivate Treg cells or render innate and adaptive pro-inflammatory effector cells insensitive to suppression. By reinstating Foxp3 protein expression and suppressor function in cells expressing a reversible Foxp3 null allele in severely diseased mice, we found that the resulting single pool of rescued Treg cells normalized immune activation, quelled severe tissue inflammation, reversed fatal autoimmune disease and provided long-term protection against them. Thus, Treg cells are functional in settings of established broad-spectrum systemic inflammation and are capable of affording sustained reset of immune homeostasis.


Conflict of interest statement

Competing interest:

A.Y.R. is a co-founder and SAB member of and holds stock options in Vedanta Bioscience and Sonoma Biotherapeitics. No other authors declare any conflict of interest.

Figures

Extended Data Figure 1 |
Extended Data Figure 1 |. Generation and characterization of Foxp3LSL mice.
a, Schematics of the targeting construct and the Foxp3LSL allele before and after Flp recombinase-mediated removal of the neo cassette. Homologous regions between the targeting construct and the WT allele are demarcated with dashed gray lines. Gene map is based on RefSeq record NM_001199347.1. pA, bovine growth hormone polyadenylation signal; neo, neomycin resistance gene; PGK, mouse phosphoglycerate kinase 1 promoter; 3xSV40pA, triple-tandem SV40 early polyadenylation signals (STOP cassette); DTA, diphtheria toxin A. b, Genotyping PCR showing the WT (275 bp) and knock-in-specific (350 bp) bands using primers labeled in a. c, d, Flow cytometric analysis of T cells and TCRβhi single positive thymocytes from 3-week-old male Foxp3LSL/y (c) and 8–10-week-old female Foxp3LSL/WT (d) mice. LN, lymph nodes. e, Expression of molecules associated with T cell activation in splenic Foxp3+ Treg and Thy1.1+ Treg “wannabes”, and naïve (CD44loCD62Lhi) and activated (CD44hiCD62Llo) conventional CD4 T cells shown in d. f, Percentages of TCRVβ5+, Vβ6+ and Vβ8+ cells among the indicated splenic CD4 T cell populations from 8–10-week-old female Foxp3LSL/DTR-GFP mice. Cells are gated on the CD44loCD62Lhi subset to avoid potential clonal expansion during activation. One way ANOVA. g, 2×10⁶ CD45.1+Foxp3 conventional CD4 T cells were co-transferred with 2×10⁵ CD45.2+ Treg “wannabes” from 2–3-week-old Foxp3LSL/y mice or Treg cells from 6–8-week-old Foxp3GFP mice into Tcrb–/–Tcrd–/– mice. Recipients were orally gavaged with tamoxifen and injected i.p. with diphtheria toxin (DT) at the indicated time points (top). DT was administered to deplete the few contaminating DTR-expressing Treg cells in the transferred FACS-purified conventional T cells or those induced to express Foxp3 after transfer. Cellularity and proliferation of CD45.1+ responder cells from lymph nodes were analyzed using flow cytometry (bottom). Data are representative of two independent experiments. All error bars denote mean ± s.e.m. ns, non-significant; *, p<0.05; **, p<0.01; ***, p<0.001; ****, p<0.0001.
Extended Data Figure 2 |
Extended Data Figure 2 |. Restoration of Foxp3 expression reverses spontaneous lymphocyte expansion, myelo-proliferation, and cytokine production, and normalizes circulatory Ig levels in male Foxp3LSL mice.
a, 4-OHT mediated recombination efficiency in lymphoid and non-lymphoid organs. Experimental scheme (left) and recombination efficiency of Rosa26Tom in Treg cells from indicated organs (right). One-way ANOVA. LN, lymph nodes. b-g, Male Foxp3LSL mice were treated with 4-OHT on postnatal day 14 and analyzed throughout the following 4 weeks. b, Representative histograms showing expression of proliferation and activation markers by splenic conventional CD4 and CD8 T cells at the indicated time points. c, Representative contour plots of flow cytometric analyses of activated and cytokine-producing splenic conventional CD4 and CD8 T cell populations. d, e, frequencies (d) and numbers (e) of activated, proliferating and cytokine-producing conventional CD4 and CD8 T cells from lymph nodes of mice of indicated genotypes at designated time points after 4-OHT treatment. Two-way ANOVA with Tukey’s multiple comparison correction. f, Numbers of splenic myeloid cell populations at indicated time points after 4-OHT treatment. Two-way ANOVA with Tukey’s multiple comparison correction. g, Serum antibody levels as in Figure 1g. One-way ANOVA with Tukey’s multiple comparison test. All error bars denote mean ± s.e.m. ns, non-significant; *, p<0.05; **, p<0.01; ***, p<0.001; ****, p<0.0001.
Extended Data Figure 3 |
Extended Data Figure 3 |. Restoration of Foxp3 expression in peripheral Treg “wannabes” rescues immune activation in male Foxp3LSL mice.
a, Experimental Design. 2-week-old mice were treated with 4-hydroxytamoxifen (4-OHT) while being continuously treated with FTY720 to block thymic output. A Rosa26loxP-STOP-loxP-tdTomato (R26LSL-tdTomato) recombination reporter allele was introduced to the mice to enable labeling of all CD4 T cells undergoing Cre-mediated recombination induced by 4-OHT. b, Number of Treg cells in the thymus (left), and percentage of tdTomato+ cells among Foxp3Thy1.1 CD4SP thymocytes (right), from FTY720-treated mice and untreated controls on day 14. Two-tailed unpaired t-tests with multiple hypothesis testing correction using the Holm-Sidak method. c, d, Numbers of activated, proliferating, and cytokine-producing conventional CD4 and CD8 T cells in the spleen (c) and lymph nodes (d). One-way ANOVA with Tukey’s multiple comparison test. All error bars denote mean ± s.e.m. ns, non-significant; *, p<0.05; **, p<0.01; ***, p<0.001; ****, p<0.0001.
Extended Data Figure 4 |
Extended Data Figure 4 |. Restoration of Foxp3 expression in Treg “wannabes” rescues tissue damage in the skin and liver of male Foxp3LSL mice.
Mice were treated with 4-OHT on postnatal day 14 and examined at the indicated time points post-treatment. a, b, H&E staining of skin sections showing epidermal hyperplasia and formation of serocellular crust (arrow heads). Dashed lines demarcate the boundary between epidermis and dermis. Images are representative of 4 Foxp3LSL/yCd4wt, 4 Foxp3LSL/yCd4creERT2 and 2 Foxp3DTR-GFP/yCd4creERT2 mice. c, TUNEL (terminal deoxynucleotidyl transferase dUTP nick end labeling) assay followed by immunohistochemistry to visualize apoptotic cells (arrow heads) in H&E counter-stained liver sections from mice of indicated genotypes. d, Quantification of TUNEL+ cells. e, Measurement of serum albumin levels. All error bars denote mean ± s.e.m. ns, non-significant; *, p<0.05; **, p<0.01; ***, p<0.001; ****, p<0.0001.
Extended Data Figure 5 |
Extended Data Figure 5 |. Restoration of Foxp3 expression in Treg “wannabes” in mosaic adult female Foxp3LSL/DTR-GFP mice suppresses immune activation caused by diphtheria toxin-mediated Treg cell ablation.
Experimental scheme shown in Figure 2a. a, Representative histograms showing expression of activation and proliferation markers in splenic conventional T cell populations. b, Representative contour plots of splenic conventional CD4 and CD8 T cells showing cytokine production. c, Percentages (left) and numbers (right) of Treg and Treg “wannabes” from indicated tissues 5 weeks post 4-OHT administration. Two-way ANOVA with Tukey’s multiple comparison test. All error bars denote mean ± s.e.m. ns, non-significant; *, p<0.05; **, p<0.01; ***, p<0.001; ****, p<0.0001. pLN, peripheral (brachial, axillary, and inguinal) lymph nodes; mLN, mesenteric lymph nodes; LP, lamina propria.
Extended Data Figure 6 |
Extended Data Figure 6 |. Analysis of gene expression changes in Treg “wannabes” induced upon activation.
a, Experimental scheme. 8–10-week-old heterozygous female Foxp3LSL/DTR-GFPCd4wt mice were treated with diphtheria toxin (DT) on designated days to deplete Foxp3DTR-GFP-expressing Treg cells and induce activation of Foxp3LSL-expressing Treg “wannabes” which were sorted and analyzed by RNA-seq. b, FC-FC plot of activation-induced gene expression changes in Treg cells and “wannabes”. Genes with mean normalized counts of >100 are shown. Differentially expressed genes (p<0.05) are colored based on the direction of the change in either or both cell types. c, Venn diagram showing the numbers of genes with larger than a 2-fold change in activated Treg cells and “wannabes”. d, eCDF plots showing expression changes in activated Treg “wannabes” for all genes (black) and Treg activation signature genes that are up- (red) or down- (blue) regulated. Two-sided Kolmogorov-Smirnov test. e, FC-FC plots showing gene expression changes in Treg cells vs. “wannabes” isolated from sick and healthy mice. Signature genes that are up- or down-regulated in activated Treg and conventional CD4 T cells are highlighted in different colors.
Extended Data Figure 7 |
Extended Data Figure 7 |. Rescued Treg cells in male Foxp3LSL mice exert long-term control of adaptive and innate immune cells.
Mice were treated with a single dose of 4-OHT at 2 weeks of age and analyzed 4 months later. a, Body weight of rescued Foxp3LSLCd4creERT2 and control Foxp3DTR-GFPCd4creERT2 mice over a 4-month time course. Two-way ANOVA with Sidak’s multiple comparison test. b, Analysis of 4-OHT “functional” pharmacokinetics in 2-week-old male mice. Mice were injected with 4-OHT 3–72 hours before transfer of congenically marked recombination-proficient CD4 T cells from Cd4creERT2R26Tom mice. 4-OHT-induced recombination was assayed 7 days later by tdTomato expression among donor CD4 T cells as a readout for 4-OHT activity. Data are pooled from two independent experiments with 2 to 4 mice per time point each. Ctrl, no 4-OHT injection. c, Suppression of in vitro proliferation of conventional CD4 T cells induced by α-CD3 antibody and antigen-presenting cells by control Treg cells from Foxp3DTR-GFP/y or rescued Treg cells from Foxp3LSL/y mice. Two-way ANOVA with Tukey’s multiple comparison test. d-f, Numbers of activated, proliferating, and cytokine-producing conventional CD4 T cells (d), CD8 T cells (e) and myeloid populations (f) in indicated tissues. pLN, peripheral (brachial, axillary, and inguinal) lymph nodes; mLN, mesenteric lymph nodes; LP, lamina propria. Data are pooled from two independent experiments. Two-tailed t-tests with multiple hypothesis testing correction using the Holm-Sidak method. All error bars denote mean ± s.e.m. ns, non-significant; *, p<0.05; **, p<0.01; ***, p<0.001; ****, p<0.0001.
Extended Data Figure 8 |
Extended Data Figure 8 |. Rescued Treg cell population persisting for 7 months in male Foxp3LSL mice prevents relapse of rampant autoimmunity.
Mice were treated with 4-OHT on postnatal day 14 and analyzed 7 months later. a-c, Frequencies of Treg cells (a) and proliferating, activated, and cytokine-producing conventional CD4 (b) and CD8 (c) T cells. Two-tailed unpaired t-tests with multiple hypothesis testing correction using the Holm-Sidak method. pLN, peripheral (brachial, axillary, and inguinal) lymph nodes; mLN, mesenteric lymph nodes; LP, lamina propria. d, Serum antibody levels. Scales were kept the same as in Figure 1g. Two-tailed unpaired t-test. e, Representative images of haematoxylin and eosin-stained sections of the indicated organs. Images are representative of 5 Foxp3DTR-GFP/y and 5 Foxp3LSL/y mice. f, Clonal diversity of the TCRα repertoire of the long-lived “redeemed” Treg cells from Foxp3LSL/y Cd4creERT2 mice at indicated time points after restoring Foxp3 expression upon 4-OHT treatment. The inverse Simpson Index was calculated based on the clone size distribution using clonotypes defined by full nucleotide sequence (left) or CDR3 amino acid sequence (right). g, Total number of unique clones (left) and Gini coefficient (right) of the TCRα repertoire of the long-lived “redeemed” Treg cells. Clonotypes were defined by using the full nucleotide sequence. One-way ANOVA with Dunnett’s multiple hypothesis test. All error bars denote mean ± s.e.m. ns, non-significant; *, p<0.05; **, p<0.01; ***, p<0.001; ****, p<0.0001.
Extended Data Figure 9 |
Extended Data Figure 9 |. Analysis of long-lived Treg cells in Foxp3LSL and control Foxp3DTR-GFP mice.
Mice were treated with 4-OHT on postnatal day 14 and analyzed 7 months later. a, UMAP visualization of the single-cell transcriptomes colored by imputed expression levels of representative genes. b, Frequencies of CD62Lhi and CD103+ cells among Treg cells in rescued Foxp3LSLCd4creERT2 and control Foxp3DTR-GFPCd4creERT2 mice. Two-tailed multiple t-tests. pLN, peripheral (brachial, axillary, and inguinal) lymph nodes; mLN, mesenteric lymph nodes; LP, lamina propria. c, Foxp3WTCd4creERT2R26Tom mice were treated with 4-OHT on postnatal day 14 and analyzed 4 months later. Representative contour plots show expression of activation markers by tdTomato+ and tdTomato Foxp3+ CD4 T cells. d, Histogram depicting the density of Foxp3LSL and tdTomato+ or tdTomato Foxp3DTR-GFP Treg cells along the average expression values for the indicated gene sets. All error bars denote mean ± s.e.m. ns, non-significant; *, p<0.05; **, p<0.01; ***, p<0.001; ****, p<0.0001.
Extended Data Figure 10 |
Extended Data Figure 10 |. Flow cytometric analysis of γREG+ Treg cells.
a, Gating strategy for γREG+ Treg cells in adult mice. b, c, Representative histogram (b) and quantification (c) of IL-4Rα expression in γREG+ and other Treg cell populations identified in a. Two-way ANOVA with Tukey’s multiple comparison correction. d, e, Representative histogram (d) and quantification (e) of CD25 expression in γREG+ and other Treg cell populations identified in a. Two-way ANOVA with Tukey’s multiple comparison correction. f, Percentages of γREG+ Treg cells in lymphoid organs and non-lymphoid tissues of CD45 i.v.-labeled 8–10-week-old Foxp3GFP mice. One-way ANOVA with Sidak’s multiple comparison test. g, Percentages (left) and numbers (right) of γREG+ Treg cells in different organs of 2- or 8-week-old Foxp3GFP-BirA-AVI-TEV mice. Two-sided unpaired t-tests with correction for multiple hypothesis testing using the Holm-Sidak method. All error bars denote mean ± s.e.m. ns, non-significant; *, p<0.05; **, p<0.01; ***, p<0.001; ****, p<0.0001. pLN, peripheral (brachial, axillary, and inguinal) lymph nodes; mLN, mesenteric lymph nodes; cLP, colonic lamina propria.
Figure 1 |
Figure 1 |. Restoration of Foxp3 expression in Treg “wannabes” cures fulminant autoimmunity in male Foxp3LSL mice.
Mice were treated with 4-hydroxytamoxifen (4-OHT) on postnatal day 14. a, Schematic of the Foxp3LSL allele. b, Flow cytometric analysis of splenic CD4 T cells 1 week post 4-OHT treatment. c, Lymph nodes (top), spleens (middle), and thymi (bottom) of mice of indicated genotypes 4 weeks after 4-OHT treatment. d-f, Percentages of activated, proliferating, and cytokine-producing splenic T cells (d), frequencies of splenic myeloid cell populations (e), and serum amyloid P (SAP) levels (f) at indicated time points after 4-OHT treatment. g, Levels of antibodies in the serum 4 weeks post-4-OHT treatment. h, Haematoxylin and eosin staining of indicated tissues before and 4 weeks after 4-OHT treatment. i, Histology scores of indicated tissues before and 4 weeks after 4-OHT treatment. For d-g, data are combined from three independent experiments with 3 to 12 mice per group per time point. Two-way (d-f, i) or one-way (g) ANOVA with Tukey’s multiple comparison test. All error bars denote mean ± s.e.m. ns, non-significant; *, p<0.05; **, p<0.01; ***, p<0.001; ****, p<0.0001
Figure 2 |
Figure 2 |. Restoration of Foxp3 expression in Treg “wannabes” in mosaic adult female Foxp3LSL/DTR-GFP mice suppresses immune activation caused by diphtheria toxin-mediated Treg cell ablation.
a, Experimental scheme. 8–10-week-old female mice were injected with diphtheria toxin (DT) intraperitoneally and given oral gavage of tamoxifen (Tam) on designated days. b, Frequencies of activated, proliferating, and cytokine producing splenic conventional CD4 and CD8 T cells at the indicated time points. Data are pooled from two independent experiments with 3 to 5 mice per group per time point. Two-way ANOVA with Tukey’s multiple comparison test. c-e, Haematoxylin and eosin staining of sections of skin (c), lung (d), and liver (e) from mice of indicated genotypes at denoted time points post tamoxifen treatment (left), and their respective inflammation scores (right). One-way ANOVA with Tukey’s multiple comparison test. All error bars denote mean ± s.e.m. ns, non-significant; *, p<0.05; **, p<0.01; ***, p<0.001; ****, p<0.0001.
Figure 3 |
Figure 3 |. Rescued Treg cells in inflamed mice are activated and potently suppressive in inflammatory settings.
a-c, Male Foxp3DTR-GFPCd4creERT2 and Foxp3LSLCd4creERT2 mice were treated with 4-OHT on postnatal day 14. Data are pooled from three independent experiments. a, Percentages of splenic Treg cells at indicated time points following 4-OHT treatment. Two-tailed unpaired t-tests with Holm-Sidak multiple comparison. b, c, representative histograms (b) and combined data (c) showing expression of Ki67, CTLA4 and GITR by rescued and control splenic Treg cells on day 7 post 4-OHT treatment. Two-tailed unpaired t-tests. d, e, RNA-seq analysis of rescued Treg cells, control Treg cells, and Treg “wannabes” from male mice of indicated genotypes treated with 4-OHT on postnatal day 14 and analyzed 7 days afterwards. d, Principal component analysis of gene expression in the three indicated cell populations (top), and empirical cumulative distribution function plots showing gene signatures of activated Treg cells (bottom left) and Treg cells expressing a constitutively active form of STAT5b (bottom right). Two-sided Kolmogorov-Smirnov test. e, Heatmaps showing expression of curated genes in rescued and control Treg cells from mice of indicated genotypes. f, Expression of Ki67, CTLA4 and GITR by indicated splenic Treg cell subsets from mosaic heterozygous Foxp3DTR-GFP/WTCd4creERT2 and Foxp3LSL/WTCd4creERT2 female mice treated with 4-OHT on postnatal day 14 and analyzed after 7 days. One-way ANOVA with Tukey’s multiple comparison test. g, Suppression of in vitro proliferation of conventional CD4 T cells induced by α-CD3 antibody and antigen-presenting cells by control or rescued Treg cells (GFP+) or Treg “wannabes” (Thy1.1+) from indicated strains of mice on day 7 post 4-OHT treatment. Two-way ANOVA with Tukey’s multiple comparison test. h-j, Adult mosaic heterozygous female Foxp3DTR-GFP/WTCd4creERT2 and Foxp3DTR-GFP/LSLCd4creERT2 mice were treated as in Figure 2a. h, Percentages of splenic Treg cells at indicated time points following tamoxifen treatment. Multiple t-tests with Holm-Sidak multiple comparison. i, j, Representative histograms (i) and combined data (j) showing expression of indicated markers by Treg cells at week 1. Two-tailed unpaired t-tests. All error bars denote mean ± s.e.m. ns, non-significant; *, p<0.05; **, p<0.01; ***, p<0.001; ****, p<0.0001.
Figure 4 |
Figure 4 |. Rescued Treg cells in male Foxp3LSL mice provide long-term protection from autoimmune inflammatory disease.
a, Experimental design. Mice were treated with a single dose of 4-OHT at 2 weeks of age and analyzed 4 months later. b, Flow cytometric analysis of CD73 expression in Foxp3+ CD4 single-positive thymocytes as a discriminating marker of recirculating vs. recently generated thymic Treg cells. Two-tailed unpaired t-test. c, Flow cytometric analysis of Treg cell percentages (upper panel) and absolute numbers (lower panel) in tissues of mice of indicated genotypes. Two-tailed unpaired t-tests with Holm-Sidak multiple comparison. d, Percentages of lineage-traced (tdTomato+) Treg cells, Treg “wannabes”, and conventional CD4 T cells. One-way ANOVA with Dunnett’s multiple hypothesis test. e, Analysis of histopathology in mice of indicated genotypes. Haematoxylin and eosin staining of sections of the indicated organs. Images are representative of 9 Foxp3DTR-GFP/y and 7 Foxp3LSL/y mice. f-h, Percentages of activated, proliferating, and cytokine-producing conventional CD4 T cells (f), CD8 T cells (g) and myeloid populations (h) from indicated organs. Data are pooled from two independent experiments. Two-tailed unpaired t-tests with Holm-Sidak multiple comparison. pLN, peripheral (brachial, axillary, and inguinal) lymph nodes; mLN, mesenteric lymph nodes; LP, lamina propria. All error bars denote mean ± s.e.m. ns, non-significant; *, p<0.05; **, p<0.01; ***, p<0.001; ****, p<0.0001.
Figure 5 |
Figure 5 |. Single-cell transcriptomic analysis of control and long-lived rescued Treg cells.
a, Survival plot of 4-OHT-treated male Foxp3LSLCd4wt and Foxp3LSLCd4creERT2 mice. Mantel-Cox test. b, Experimental design. Mice were treated with 4-OHT at 2 weeks of age and Foxp3+ Treg cells, FACS-purified based on GFP expression, were subjected to scRNA-seq analysis using 10X Genomics platform 7 months later. c, Percentages of fate-mapped splenic Treg cells and conventional CD4 T cells in control and rescued mice at indicated time points post 4-OHT treatment. Scatter plot shows mean ± s.e.m. Two-way ANOVA with Tukey’s multiple comparison correction. d, UMAP visualization of the single-cell transcriptomes of experimental Foxp3LSL and control tdTomato or tdTomato+ Foxp3DTR-GFP Treg cells. e, UMAP visualization colored by diffusion component 1 (DC1, left) and the expression level of activated Treg cell gene signature (right). f, Histograms depicting the density of Foxp3LSL and tdTomato+ or tdTomato Foxp3DTR-GFP Treg cells along DC1, Mcl1 expression, and the average expression levels of indicated gene sets. g, Correlation of curated genes with DC1. h, UMAP visualization colored by pseudotime generated with Palantir. Arrow indicates the direction of differentiation across the map. i, Expression of representative genes along the pseudotime trajectory. j, Violin plots showing the pseudotime values of Foxp3LSL and tdTomato+ or tdTomato Foxp3DTR-GFP Treg cells. White dots denote medians. Thick vertical bars delimit the interquartile ranges. Thin vertical lines represent upper and lower adjacent values. Histograms show distributions of the data, maxima and minima. Two-tailed t-test.
Figure 6 |
Figure 6 |. Identification and analysis of γREG+ Treg cells from the single-cell RNA-seq data.
a, UMAP visualization colored by the clusters. Bar graph shows the numbers of cells from each sample that contributed to the individual clusters. b, UMAP visualization of Foxp3LSL Treg cells colored by the Seurat module scores for the indicated gene sets. c, Violin plots showing the pseudotime values of Foxp3LSL Treg cells from the top 10 clusters. White dots denote medians. Thick vertical bars delimit the interquartile ranges. Thin vertical lines represent upper and lower adjacent values. Histograms show distributions of the data, maxima and minima. Horizontal bars indicate the numbers of Foxp3LSL Treg cells contributing to each cluster. d, Dot plot showing the expression of top enriched genes and underrepresented genes (p<0.05) from cluster 1 expressed by more than 20% of the cells in at least one cluster. P-values for enriched genes were calculated with two-tailed t-test, as used by the default parameters of Scanpy. See Supplementary Table 1 for list of enriched genes by cluster. e-f, Representative plots (e) and combined data (f) showing the frequencies of γREG+ Treg cells among splenic CD62Llo Treg cells in rescued and control mice treated with 4-OHT on postnatal day 14 and analyzed 4 months later. Two-tailed unpaired t-tests with Holm-Sidak multiple comparison. g, Frequencies (left) and absolute numbers (right) of γREG+ Treg cells in various tissues of unmanipulated 8-week-old Foxp3GFP mice. h, Percentages of γREG+ Treg cells among tdTomato+ or tdTomato Treg cells “time-stamped” in adult (8-week-old) or perinatal (2-week-old) mice and analyzed after 4 months. Two-way ANOVA with Tukey’s multiple comparison test. All error bars denote mean ± s.e.m. ns, non-significant; *, p<0.05; **, p<0.01; ***, p<0.001; ****, p<0.0001. pLN, peripheral (brachial, axillary, and inguinal) lymph nodes; mLN, mesenteric lymph nodes; PB, peripheral blood; cLP, colonic lamina propria.

Comment in

References

    1. Kanangat S et al. Disease in the scurfy (sf) mouse is associated with overexpression of cytokine genes. Eur J Immunol 26, 161–165 (1996). - PubMed
    1. Chatila TA Role of regulatory T cells in human diseases. J Allergy Clin Immunol 116, 949–959; quiz 960 (2005). - PubMed
    1. Godfrey VL, Wilkinson JE & Russell LB X-linked lymphoreticular disease in the scurfy (sf) mutant mouse. Am J Pathol 138, 1379–1387 (1991). - PMC - PubMed
    1. Khattri R, Cox T, Yasayko SA & Ramsdell F An essential role for Scurfin in CD4+CD25+ T regulatory cells. Nat Immunol 4, 337–342 (2003). - PubMed
    1. Fontenot JD, Gavin MA & Rudensky AY Foxp3 programs the development and function of CD4+CD25+ regulatory T cells. Nat Immunol 4, 330–336 (2003). - PubMed

Online Methods References

    1. Sledzinska A et al. TGF-beta signalling is required for CD4(+) T cell homeostasis but dispensable for regulatory T cell function. PLoS Biol 11, e1001674 (2013). - PMC - PubMed
    1. Mombaerts P et al. Mutations in T-cell antigen receptor genes alpha and beta block thymocyte development at different stages. Nature 360, 225–231 (1992). - PubMed
    1. Madisen L et al. A robust and high-throughput Cre reporting and characterization system for the whole mouse brain. Nat Neurosci 13, 133–140 (2010). - PMC - PubMed
    1. Campbell C et al. Extrathymically Generated Regulatory T Cells Establish a Niche for Intestinal Border-Dwelling Bacteria and Affect Physiologic Metabolite Balance. Immunity 48, 1245–1257 e1249 (2018). - PMC - PubMed
    1. Dobin A et al. STAR: ultrafast universal RNA-seq aligner. Bioinformatics 29, 15–21 (2013). - PMC - PubMed

Publication types

MeSH terms

Substances