. 2021 Oct;12(5):1333-1351.
doi: 10.1002/jcsm.12758. Epub 2021 Aug 23.

Association of circulating PLA2G7 levels with cancer cachexia and assessment of darapladib as a therapy

Affiliations

Association of circulating PLA2G7 levels with cancer cachexia and assessment of darapladib as a therapy

Pauline Morigny et al. J Cachexia Sarcopenia Muscle. 2021 Oct.

Abstract

Background: Cancer cachexia (CCx) is a multifactorial wasting disorder characterized by involuntary loss of body weight that affects many cancer patients and implies a poor prognosis, reducing both tolerance to and efficiency of anticancer therapies. Actual challenges in management of CCx remain in the identification of tumour-derived and host-derived mediators involved in systemic inflammation and tissue wasting and in the discovery of biomarkers that would allow for an earlier and personalized care of cancer patients. The aim of this study was to identify new markers of CCx across different species and tumour entities.

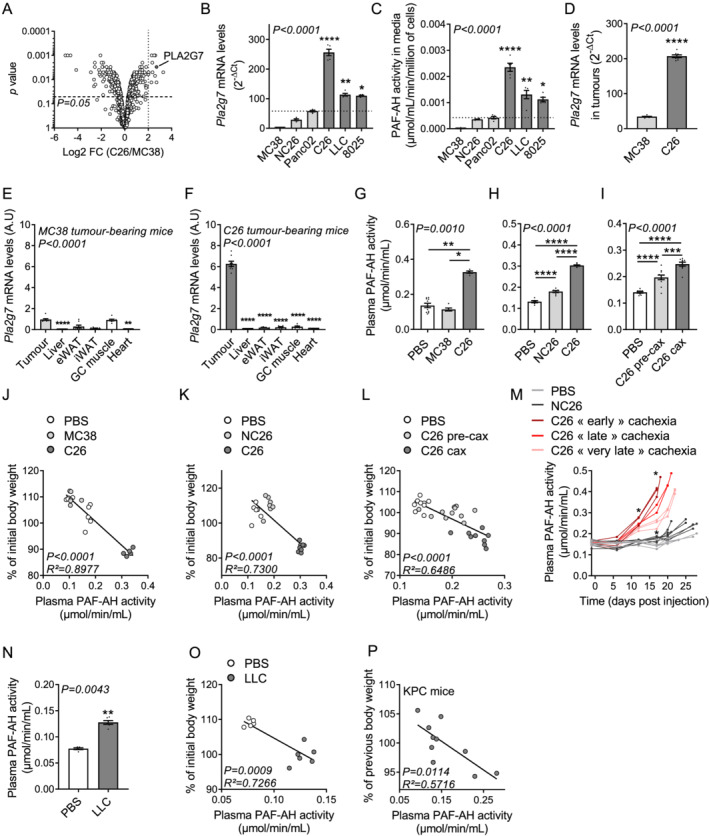
Methods: Quantitative secretome analysis was performed to identify specific factors characteristic of cachexia-inducing cancer cell lines. To establish the subsequently identified phospholipase PLA2G7 as a marker of CCx, plasma PLA2G7 activity and/or protein levels were measured in well-established mouse models of CCx and in different cohorts of weight-stable and weight-losing cancer patients with different tumour entities. Genetic PLA2G7 knock-down in tumours and pharmacological treatment using the well-studied PLA2G7 inhibitor darapladib were performed to assess its implication in the pathogenesis of CCx in C26 tumour-bearing mice.

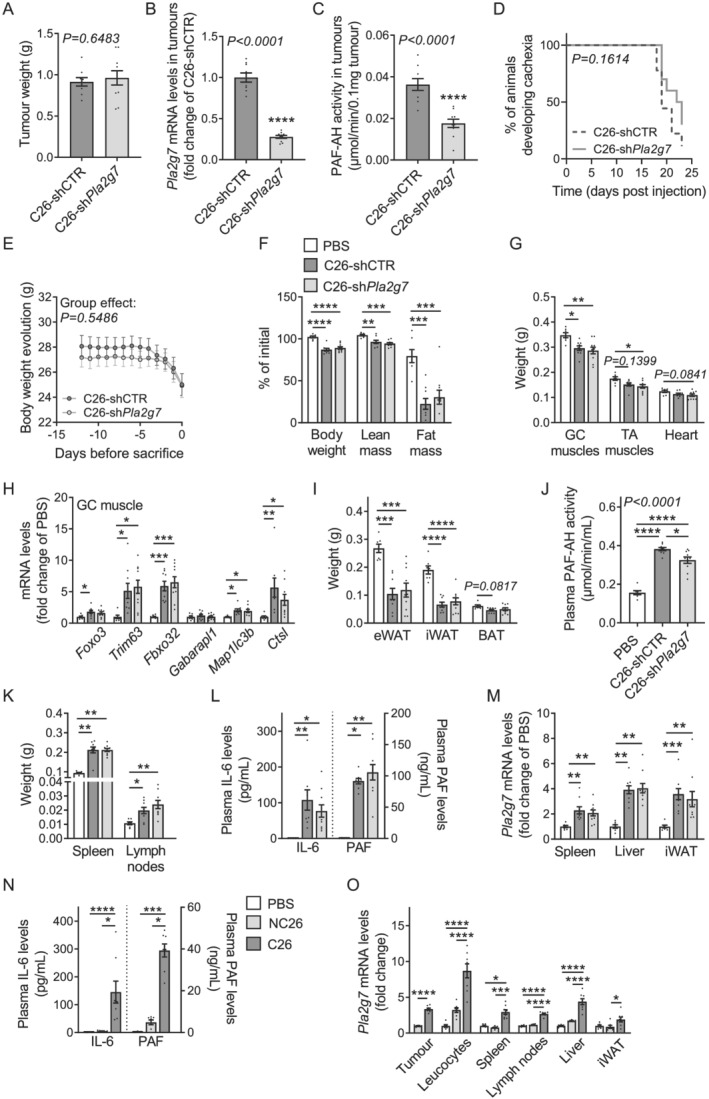
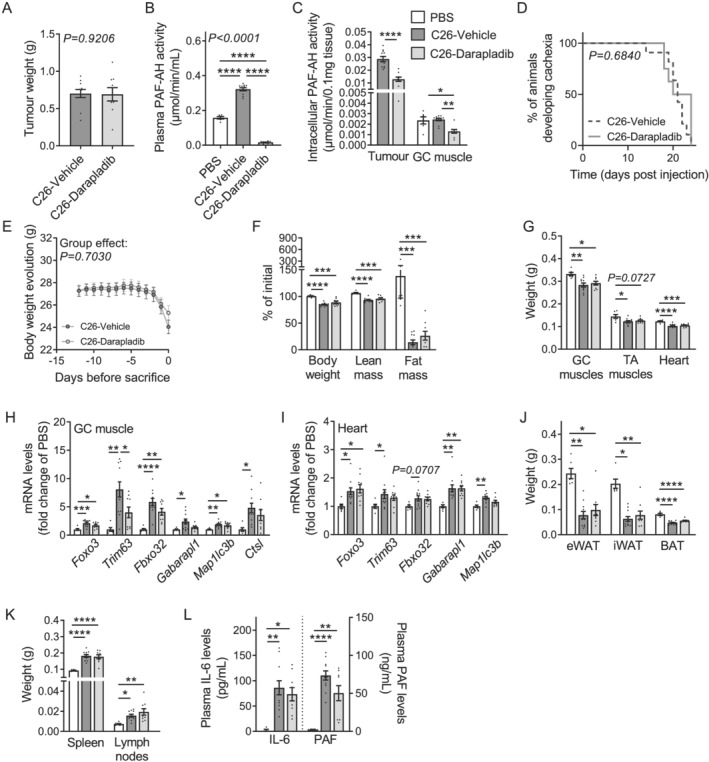
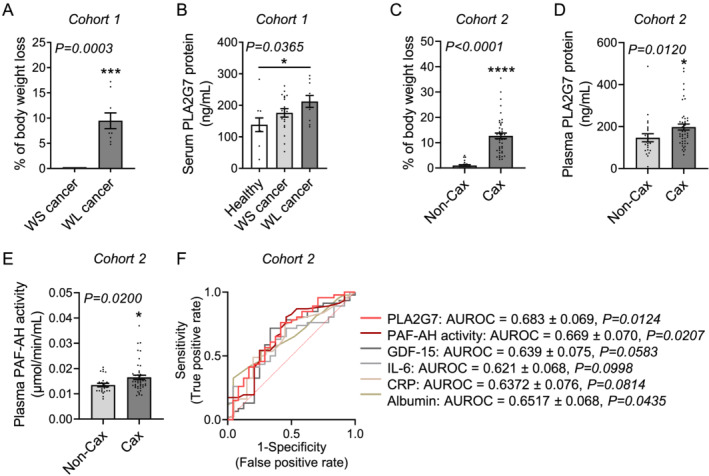
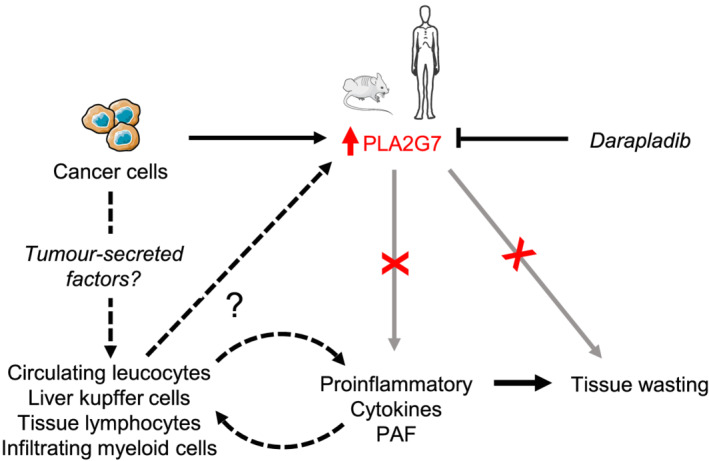
Results: High expression and secretion of PLA2G7 were hallmarks of cachexia-inducing cancer cell lines. Circulating PLA2G7 activity was increased in different mouse models of CCx with various tumour entities and was associated with the severity of body wasting. Circulating PLA2G7 levels gradually rose during cachexia development. Genetic PLA2G7 knock-down in C26 tumours only partially reduced plasma PLA2G7 levels, suggesting that the host is also an important contributor. Chronic treatment with darapladib was not sufficient to counteract inflammation and tissue wasting despite a strong inhibition of the circulating PLA2G7 activity. Importantly, PLA2G7 levels were also increased in colorectal and pancreatic cancer patients with CCx.

Conclusions: Overall, our data show that despite no immediate pathogenic role, at least when targeted as a single entity, PLA2G7 is a consistent marker of CCx in both mice and humans. The early increase in circulating PLA2G7 levels in pre-cachectic mice supports future prospective studies to assess its potential as biomarker for cancer patients.

Keywords: Biomarker; Cancer cachexia; Cancer patients; Darapladib; Mouse models; PLA2G7.


Conflict of interest statement

None declared.

Figures

Figure 1
Figure 1
High circulating levels of PLA2G7 are a hallmark of CCx in different mouse models with various tumour entities. (A) Proteomic analysis of C26 vs. MC38 conditioned media [n = 3 biological replicates per group; data are log2 values of fold change (FC) C26/MC38]. C26 is a cachexia‐inducing cancer cell line, while MC38 is a non‐cachexia‐inducing cancer cell line. (B) Pla2g7 mRNA levels (n = 5 biological replicates per group) and (C) PAF‐AH activity levels in conditioned media (n = 5 biological replicates per group) from various cancer cell lines with different cachexia‐inducing properties (light grey bars: no cachexia‐inducing properties; dark grey bars: cachexia‐inducing properties). (D) Pla2g7 mRNA levels in tumours of non‐cachectic MC38 (light grey bar) and cachectic C26 (dark grey bar) tumour‐bearing mice (n = 8 animals per group). (E) Relative Pla2g7 mRNA levels in tumours (grey bars) and metabolic tissues (white bars) of non‐cachectic MC38 and (F) cachectic C26 tumour‐bearing mice (n = 8 animals per group). (G–I) Plasma PAF‐AH activity levels in (G) PBS (white bar, n = 10 animals), non‐cachectic MC38 (light grey bar, n = 5 animals), and cachectic C26 (dark grey bar, n = 5 animals) tumour‐bearing mice; (H) PBS (white bar, n = 6 animals), non‐cachectic NC26 (light grey bar, n = 7 animals), and cachectic C26 (dark grey bar, n = 8 animals) tumour‐bearing mice; and (I) PBS (white bar, n = 9 animals), pre‐cachectic (C26‐precax, light grey bar, n = 11 animals), and cachectic (C26‐cax, dark grey bar, n = 9 animals) C26 tumour‐bearing mice. Of note, activity data from MC38 and C26 tumour‐bearing mice are from another cohort than the one presented in Figures S1A–S1E but which shared the same properties (in terms of loss of body weight, and fat and muscle mass for a similar tumour size). (J–L) Linear regression analyses comparing plasma PAF‐AH activity and loss of body weight (expressed as percentage of initial body weight) in the animal experiments presented in Figures 1G–1I. (M) Longitudinal prospective study showing plasma PAF‐AH activity in PBS (light grey lines, n = 6 animals), non‐cachectic NC26 (dark grey lines, n = 7 animals), and cachectic C26 (red lines, n = 8 animals) tumour‐bearing mice throughout cachexia development. Final activity was measured on the day of sacrifice. C26 mice were divided into three groups based on their time course of cachexia development including an early (Days 17 and 18, dark red lines), late (Days 20 and 21, bright red lines), and very late (Day 22, light red lines) cachexia development. The graph shows individual mice data. Statistical analysis was performed using a paired two‐way ANOVA with Bonferroni post hoc tests until Day 17 where all the mice were still included. (N, O) Plasma PAF‐AH activity (N) and linear regression analysis comparing plasma PAF‐AH activity and loss of body weight (O) in PBS (white bar/dots, n = 5 animals) and LLC tumour‐bearing mice (dark grey bar/dots, n = 6 animals). (P) Linear regression analysis comparing plasma PAF‐AH activity and loss of body weight (expressed as percentage of body weight of the previous week) in KPC mice with various degrees of body weight loss (n = 10 animals). Data are mean ± standard error of the mean. Statistical analyses were performed using Kruskal–Wallis or unpaired one‐way ANOVA with Dunn's or Bonferroni post hoc tests, respectively (B, C, E–I), unpaired t test (D, N), and linear regression analysis (J–L, O, P). Tests were two sided. *P < 0.05, **P < 0.01, ***P < 0.001, and ****P < 0.0001. vs. MC38 cells (B, C) or tumour (E, F).
Figure 2
Figure 2
Pla2g7 knock‐down in C26 tumours slightly reduced circulating levels of PLA2G7 and did not affect CCx development. (A–M) Mice were injected subcutaneously with PBS (control mice, white bars, n = 7 animals), control C26 cancer cells (C26‐shCTR, dark grey bars/lines, n = 9 animals), or C26 cancer cells stably knocked down for Pla2g7 (C26‐shPla2g7, light grey bars/lines, n = 10 animals). (A) Tumour weights. (B) Pla2g7 mRNA levels and (C) PAF‐AH activity in tumours. (D) Kaplan–Meier curve depicting the percentage of mice developing cachexia over time. (E) Kinetic of body weight loss during days prior sacrifice. (F) Loss of body weight, lean and fat mass (expressed as percentage of initial mass). (G) GC muscles, TA muscles, and heart weights. (H) mRNA levels of atrophy and autophagy markers in GC muscle. (I) Epididymal (eWAT), inguinal (iWAT), and brown (BAT) adipose tissues weights. (J) PAF‐AH activity in plasma. (K) Spleen and lymph nodes weights. (L) Plasma interleukin‐6 (IL‐6) and platelet‐activating factor (PAF) levels (n = 5 PBS animals, n = 8 C26‐shCTR animals, and n = 10 C26‐shPla2g7 animals). (M) Pla2g7 mRNA levels in spleen, liver, and iWAT. (N) Plasma IL‐6 and PAF levels and (O) Pla2g7 mRNA levels in tumours, circulating leucocytes, and various tissues of PBS (white bars, n = 6 animals), non‐cachectic NC26 (light grey bars, n = 7 animals), and cachectic C26 (dark grey bars, n = 8 animals) tumour‐bearing mice. Data are mean ± standard error of the mean. Statistical analyses were performed using unpaired t‐test (A–C), unpaired one‐way ANOVA or Kruskal–Wallis with Bonferroni or Dunn's post hoc tests, respectively (F–O), paired two‐way ANOVA (E), and log‐rank (Mantel–Cox) test (D). Tests were two sided. *P < 0.05, **P < 0.01, ***P < 0.001, and ****P < 0.0001.
Figure 3
Figure 3
Darapladib treatment was not sufficient to counteract CCx in C26 tumour‐bearing mice despite a strong inhibition of PLA2G7 activity. (A–L) Mice were injected subcutaneously either with PBS (control mice) or C26 cancer cells and treated once daily either with vehicle (PBS mice, white bars, n = 6 animals; C26‐vehicle tumour‐bearing mice, dark grey bars/lines, n = 11 animals) or 50 mg/kg darapladib (C26‐darapladib tumour‐bearing mice, light grey bars/lines, n = 9 animals). (A) Tumour weights. (B) PAF‐AH activity in plasma, (C) tumours and GC muscles. (D) Kaplan–Meier curve depicting the percentage of mice developing cachexia over time. (E) Kinetic of body weight loss during days prior sacrifice. (F) Loss of body weight, and lean and fat mass (expressed as percentage of initial mass). (G) GC muscles, TA muscles, and heart weights. (H) mRNA levels of atrophy and autophagy markers in GC muscle and (I) heart. (J) Epididymal (eWAT), inguinal (iWAT), and brown (BAT) adipose tissues weights. (K) Spleen and lymph nodes weights. (L) Plasma interleukin‐6 (IL‐6) and platelet‐activating factor (PAF) levels (n = 5 PBS animals, n = 11 C26‐shCTR animals, and n = 9 C26‐shPla2g7 animals). Data are mean ± standard error of the mean. Statistical analyses were performed using unpaired t‐test (A, C), unpaired one‐way ANOVA or Kruskal Wallis with Bonferroni or Dunn's post hoc tests, respectively (B, C, F–L), paired two‐way ANOVA (E), and log‐rank (Mantel–Cox) test (D). Tests were two sided. *P < 0.05, **P < 0.01, ***P < 0.001, and ****P < 0.0001.
Figure 4
Figure 4
Circulating PLA2G7 levels are higher in weight‐losing cancer patients. (A) Percentage of body weight loss in the past 3 months and (B) PLA2G7 protein levels in serum of healthy individuals (white bar, n = 10 individuals) and weight‐stable (WS, light grey bars, n = 19 individuals) and weight‐losing (WL, dark grey bars, n = 10 individuals) patients with pancreatic or colorectal cancer. (C) Percentage of body weight loss, (D) plasma PLA2G7 protein, and (E) plasma PAF‐AH activity levels in non‐cachectic (Non‐Cax, light grey bars, n = 24 individuals) and cachectic (Cax, dark grey bars, n = 46 individuals) patients with pancreatic cancer. (F) Receiver operating characteristic (ROC) curve analysis, which measures the potential of circulating PLA2G7 protein, PAF‐AH activity, growth differentiation factor 15 (GDF‐15), interleukin‐6 (IL‐6), C‐reactive protein (CRP), or albumin levels to discriminate between cachectic and non‐cachectic cancer patients from Cohort 2 based on their sensitivity (true positive rate) and specificity (false positive rate: 1 − specificity). The area under the ROC curve (AUROC) and its associated P value illustrate the strength of a factor to distinguish between the two groups of patients. Data are mean ± standard error of the mean. Statistical analyses were performed using unpaired t‐test (A), Mann–Whitney test (C–E), and unpaired one‐way ANOVA with Bonferroni post hoc tests (B). ROC curve analysis (F) was performed using GraphPad Prism 8.4. Tests were two sided. *P < 0.05, ***P < 0.001, and ****P < 0.0001.
Figure 5
Figure 5
Graphical summary of the study. Circulating PLA2G7 levels are increased in CCx in both mice and humans. Despite a significant contribution, tumour is probably not the only responsible for the increase in circulating PLA2G7 levels in CCx. Circulating leucocytes and tissues such as liver, spleen, lymph nodes, or adipose tissue also show increased Pla2g7 expression upon cachexia and may significantly contribute to its circulating levels. In tissues, liver Kupffer cells, lymphocytes, and infiltrating myeloid cells are considered to be the main cell types expressing Pla2g7 (according to publicly available single cell RNA sequencing data on the Tabula Muris website, https://tabula‐muris.ds.czbiohub.org/). Tumour‐secreted factors as well as increased circulating levels of pro‐inflammatory cytokines and/or platelet‐activating factor (PAF) may promote PLA2G7 expression and secretion by cells from the host. Chronic treatment with the specific PLA2G7 inhibitor darapladib was not sufficient to improve inflammation and to counteract tissue wasting. Future studies should focus on the potential of PLA2G7 as early biomarker for the diagnosis of CCx.

References

    1. Baracos VE, Martin L, Korc M, Guttridge DC, Fearon KC. Cancer‐associated cachexia. Nat Rev Dis Primers 2018;4:17105. - PubMed
    1. Fearon K, Strasser F, Anker SD, Bosaeus I, Bruera E, Fainsinger RL, et al. Definition and classification of cancer cachexia: an international consensus. Lancet Oncol 2011;12:489–495. - PubMed
    1. Argiles JM, Stemmler B, López‐Soriano FJ, Busquets S. Inter‐tissue communication in cancer cachexia. Nat Rev Endocrinol 2018;15:9–20. - PubMed
    1. Deans DA, Tan BH, Wigmore SJ, Ross JA, de Beaux AC, Paterson‐Brown S, et al. The influence of systemic inflammation, dietary intake and stage of disease on rate of weight loss in patients with gastro‐oesophageal cancer. Br J Cancer 2009;100:63–69. - PMC - PubMed
    1. Kalantar‐Zadeh K, Rhee C, Sim JJ, Stenvinkel P, Anker SD, Kovesdy CP. Why cachexia kills: examining the causality of poor outcomes in wasting conditions. J Cachexia Sarcopenia Muscle 2013;4:89–94. - PMC - PubMed

Publication types