. 2021 Aug 31;6(4):e0075021.
doi: 10.1128/mSystems.00750-21. Epub 2021 Aug 24.

Comprehensive Wet-Bench and Bioinformatics Workflow for Complex Microbiota Using Oxford Nanopore Technologies

Affiliations

Comprehensive Wet-Bench and Bioinformatics Workflow for Complex Microbiota Using Oxford Nanopore Technologies

Christoph Ammer-Herrmenau et al. mSystems. .

Abstract

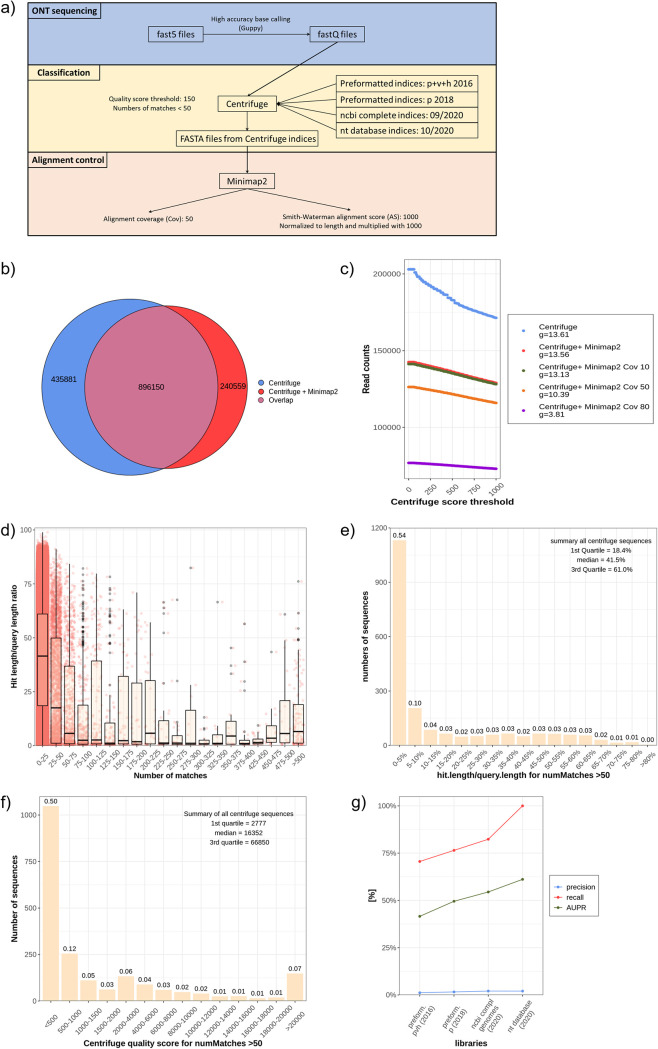
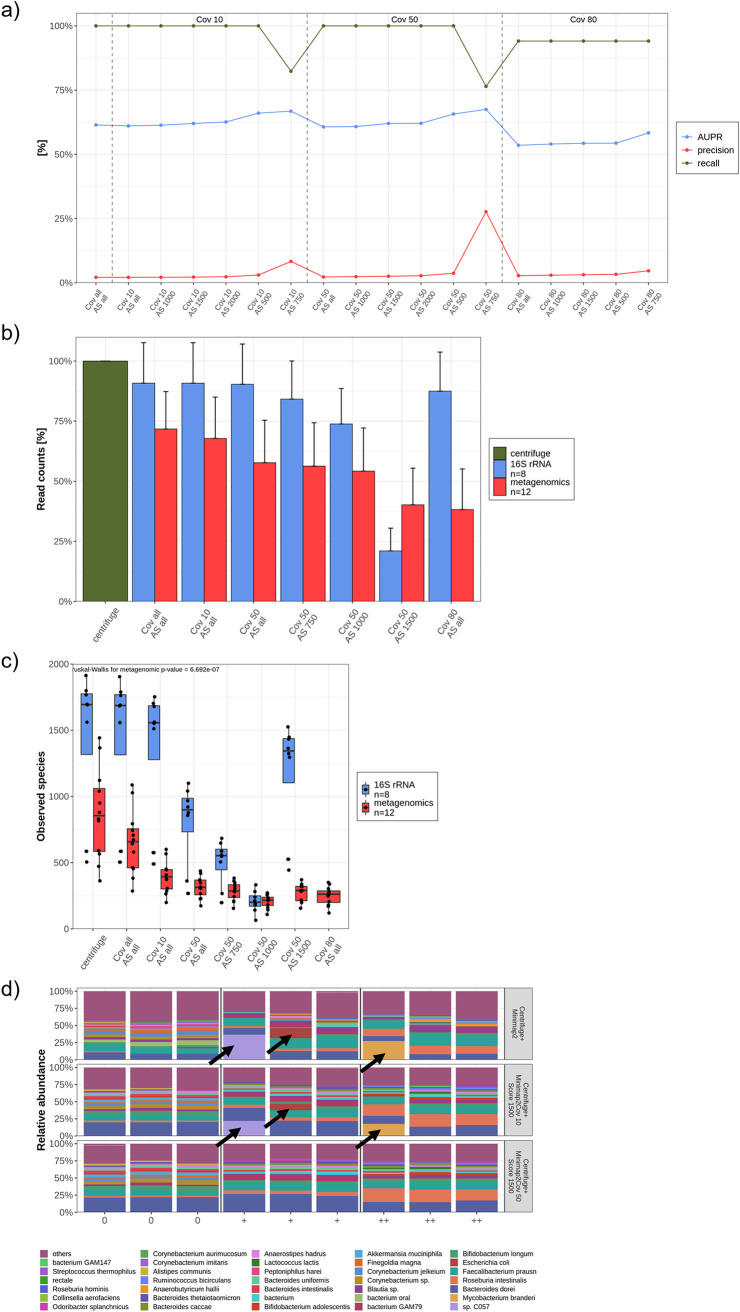
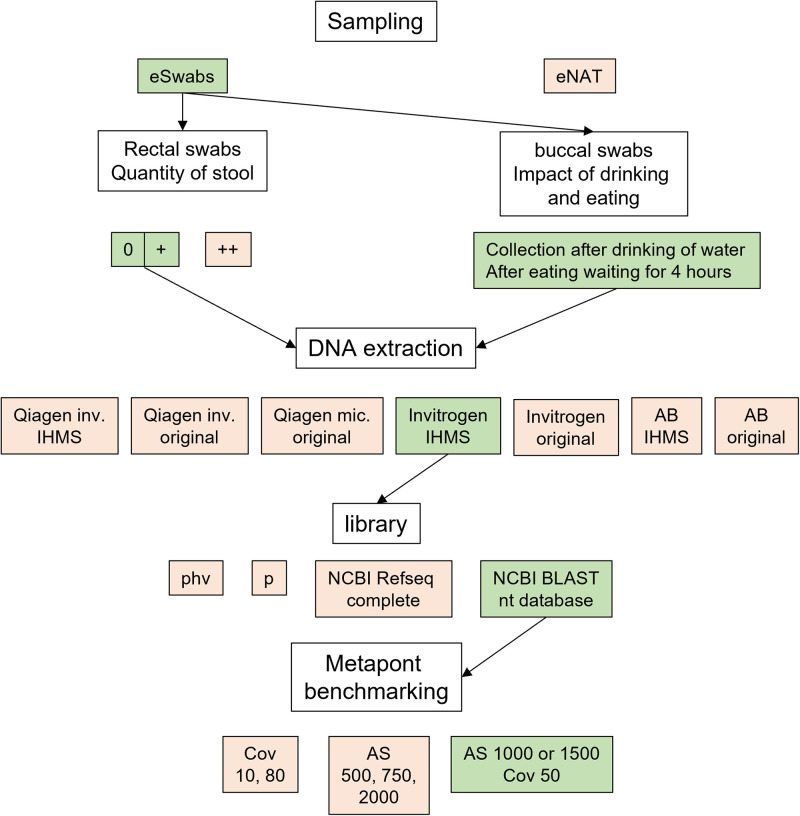
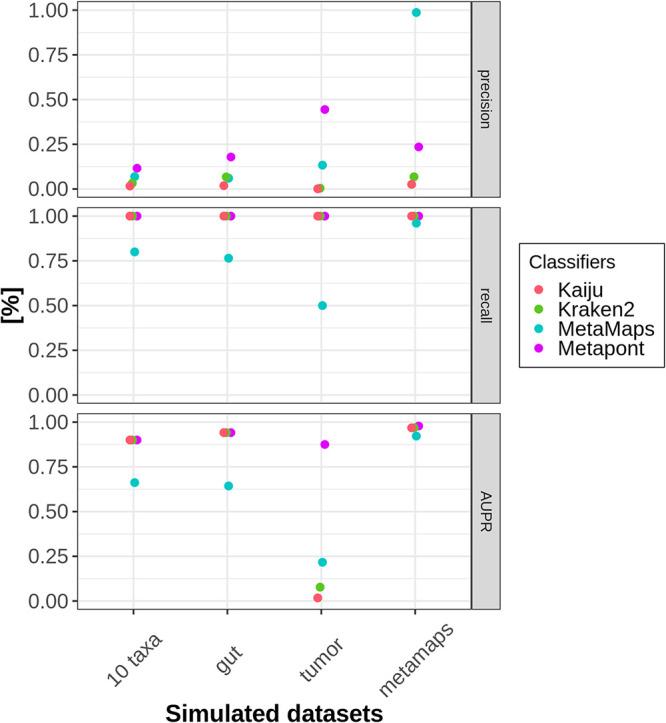
The advent of high-throughput sequencing techniques has recently provided an astonishing insight into the composition and function of the human microbiome. Next-generation sequencing (NGS) has become the gold standard for advanced microbiome analysis; however, 3rd generation real-time sequencing, such as Oxford Nanopore Technologies (ONT), enables rapid sequencing from several kilobases to >2 Mb with high resolution. Despite the wide availability and the enormous potential for clinical and translational applications, ONT is poorly standardized in terms of sampling and storage conditions, DNA extraction, library creation, and bioinformatic classification. Here, we present a comprehensive analysis pipeline with sampling, storage, DNA extraction, library preparation, and bioinformatic evaluation for complex microbiomes sequenced with ONT. Our findings from buccal and rectal swabs and DNA extraction experiments indicate that methods that were approved for NGS microbiome analysis cannot be simply adapted to ONT. We recommend using swabs and DNA extractions protocols with extended washing steps. Both 16S rRNA and metagenomic sequencing achieved reliable and reproducible results. Our benchmarking experiments reveal thresholds for analysis parameters that achieved excellent precision, recall, and area under the precision recall values and is superior to existing classifiers (Kraken2, Kaiju, and MetaMaps). Hence, our workflow provides an experimental and bioinformatic pipeline to perform a highly accurate analysis of complex microbial structures from buccal and rectal swabs. IMPORTANCE Advanced microbiome analysis relies on sequencing of short DNA fragments from microorganisms like bacteria, fungi, and viruses. More recently, long fragment DNA sequencing of 3rd generation sequencing has gained increasing importance and can be rapidly conducted within a few hours due to its potential real-time sequencing. However, the analysis and correct identification of the microbiome relies on a multitude of factors, such as the method of sampling, DNA extraction, sequencing, and bioinformatic analysis. Scientists have used different protocols in the past that do not allow us to compare results across different studies and research fields. Here, we provide a comprehensive workflow from DNA extraction, sequencing, and bioinformatic workflow that allows rapid and accurate analysis of human buccal and rectal swabs with reproducible protocols. This workflow can be readily applied by many scientists from various research fields that aim to use long-fragment microbiome sequencing.

Keywords: 16S rRNA; DNA extraction; Kaiju; Kraken2; MetaMaps; Metapont; ONT; Oxford Nanopore Technologies; bioinformatic workflow; buccal swab; eNAT; eSwab; metagenomics; microbiome; rectal swab; sampling; sequencing; storage.


Figures

FIG 1
FIG 1
Swab reliability and storage conditions. (a) Experimental design. (b) Beta diversity calculated with Bray-Curtis distance and ordinated with principal coordinate analysis. R2 score and P value explain the significant distance between d3_RT and d7_RT (both eSwab, outliers) and other samples. Distance calculation was performed at species level. (c) Microbial composition shows all species with >2% abundance, whereas the residual species were summarized as others (violet). All samples were normalized by prevalence filtering and rarefaction (10,000 reads/sample). (d) n = 6 buccal and rectal samples per swab were compared and purity was measured by NanoDrop.
FIG 2
FIG 2
Influence of quantity of stool on microbial DNA content and composition of rectal swabs. (a) Three different quantities of stool were compared. Twelve samples were collected and allocated by 2 people independently. (b) Average microbial DNA content of three defined grades of stool. Kruskal-Wallis and pairwise Wilcoxon rank test were performed with a P  value of <0.05 (*). (c) Microbial composition of different stool quantities (3 samples per group) is presented at the species level, whereas all taxa under 2% are displayed as others (green). Black arrows indicate Corynebacterium species, Corynebacterium jekeium, and Akkermansia muciniphila, respectively. All samples were filtered for bacterial reads and rarefied to 7,200 reads/samples.
FIG 3
FIG 3
Impact of eating and drinking on the buccal microbiome. (a) Experimental design. Four healthy nonvegetarian volunteers followed the protocol for 2 days. (b) Unweighted UniFrac distance ordinated with principal coordinate analysis showing the beta diversity at species level. Squares display the buccal swabs in the morning before eating (baseline), circles are the samples after eating (5 min, 30 min, and 240 min), whereas stars represent samples after drinking (5 min, 30 min, and 240 min). Samples were rarefied to 9,000 reads/sample.
FIG 4
FIG 4
Evaluation of DNA extraction protocols for 16S rRNA and metagenomic ONT sequencing. (a) Isolated DNA concentration from buccal und rectal swabs. Dashed lines at ∼10 ng/μl represent the recommended DNA concentration for metagenomic experiments. N = 7 to 9 swabs were extracted per protocol and swab origin. (b) The rarefaction curve from 16S rRNA sequencing experiments displays continuous lines for buccal samples and dashed lines for rectal swabs. A sequencing depth cutoff at 250,000 was determined (black dashed line). (c) Alpha diversity of 16S rRNA sequenced samples was defined by observed species for buccal (blue boxplots) and rectal (red boxplots) swabs. At least n = 4 samples per biospecimen and DNA isolation protocol were sequenced. (d) The rarefaction curve was derived from buccal (continuous lines) and rectal (dashed lines) swabs, which were analyzed using a metagenomic approach. A sequencing depth cutoff at 250,000 was determined as a minimum read count (black dashed line). (e) Alpha diversity of samples, sequenced with a metagenomic approach, was defined by observed species for buccal (blue boxplots) and rectal (red boxplots) swabs. (f) Read counts in percentages were compared between different protocols after combining n = 5 different metagenomic sequencing experiments. Kruskal-Wallis and pairwise Wilcoxon rank test were applied to determine significance. *, P  < 0.05; **, P  < 0.01; ***, P  < 0.001.
FIG 5
FIG 5
Bioinformatic workflow and establishment of Centrifuge filter and library. (a) Overview of the bioinformatic pipeline with base calling (blue background), classification (beige background), and alignment control (red background). (b) Venn diagram with overlap between Centrifuge classification and Centrifuge + Minimap2 without any additional filter. (c) Influence of Centrifuge quality score on the number of sequences. N = 4 samples were combined after metagenomic sequencing and classified with Centrifuge and controlled with different Minimap2 filters (Cov). Differences of quotients (g) were calculated for each line. (d) N = 12 rectal samples were classified with a Centrifuge. The sequences were arranged to their number of matches to different taxIDs, and the classified length was divided through the total sequence length (hit length/query length ratio). Red dots represent a single read ID. All sequences with more than 50 different taxIDs were filtered, and their hit length/query length ratio (e) and qscore are presented (f). (g) A gut mock community was used to evaluate four different libraries of Centrifuge. They were compared with the following parameters: precision (blue line), area under the precision and recall curve (AUPR, green line), and recall (red line).
FIG 6
FIG 6
Evaluation of different Minimap2 parameters. (a) A set of coverage (Cov) and alignment score (AS) thresholds were evaluated using the gut mock community. The thresholds were compared with the following parameters: precision (red line), area under the precision and recall curve (AUPR, blue line), and recall (green line). (b and c) The sequence count, in percentage (b), and the alpha diversity (observed species) (c) decreases with increasing coverage and scores for both metagenomic (n = 12) and 16S (n = 8) sequenced samples. Kruskal-Wallis test were calculated. (d) Microbial composition at the species level of n = 9 rectal swabs were displayed by applying three different filters (Minimap2 without any threshold, Minimap2 with a Cov of 10 and AS of 1,500, and Minimap2 with a Cov of 50 and AS of 1,500). Black arrows mark taxa that were filtered out by increased thresholds.
FIG 7
FIG 7
Experimental overview. A schematic overview of the experiments. Parameters highlighted in green were set as the default and were used for the experiments if not mentioned otherwise. Parameters highlighted in red showed measurable disadvantages compared to the green ones.
FIG 8
FIG 8
Comparison of classifiers with simulated data. Four sets of simulated data were created and classified with four different programs: Kaiju (red line), Kraken2 (green line), MetaMaps (cyan line), and Metapont (purple line). Percentages of precision, recall, and AUPR gained by each classifier are displayed for each simulated data set.

References

    1. Fan X, Alekseyenko AV, Wu J, Peters BA, Jacobs EJ, Gapstur SM, Purdue MP, Abnet CC, Stolzenberg-Solomon R, Miller G, Ravel J, Hayes RB, Ahn J. 2018. Human oral microbiome and prospective risk for pancreatic cancer: a population-based nested case-control study. Gut 67:120–127. doi:10.1136/gutjnl-2016-312580. - DOI - PMC - PubMed
    1. Duvallet C, Gibbons SM, Gurry T, Irizarry RA, Alm EJ. 2017. Meta-analysis of gut microbiome studies identifies disease-specific and shared responses. Nat Commun 8:1784. doi:10.1038/s41467-017-01973-8. - DOI - PMC - PubMed
    1. Turnbaugh PJ, Ley RE, Mahowald MA, Magrini V, Mardis ER, Gordon JI. 2006. An obesity-associated gut microbiome with increased capacity for energy harvest. Nature 444:1027–1031. doi:10.1038/nature05414. - DOI - PubMed
    1. Wu H, Esteve E, Tremaroli V, Khan MT, Caesar R, Mannerås-Holm L, Ståhlman M, Olsson LM, Serino M, Planas-Fèlix M, Xifra G, Mercader JM, Torrents D, Burcelin R, Ricart W, Perkins R, Fernàndez-Real JM, Bäckhed F. 2017. Metformin alters the gut microbiome of individuals with treatment-naive type 2 diabetes, contributing to the therapeutic effects of the drug. Nat Med 23:850–858. doi:10.1038/nm.4345. - DOI - PubMed
    1. Khan I, Ullah N, Zha L, Bai Y, Khan A, Zhao T, Che T, Zhang C. 2019. Alteration of gut microbiota in inflammatory bowel disease (IBD): cause or consequence? IBD treatment targeting the gut microbiome. Pathogens 8:126. [PMC]. doi:10.3390/pathogens8030126. - DOI - PMC - PubMed