. 2021 Aug 31;6(4):e0053021.
doi: 10.1128/mSystems.00530-21. Epub 2021 Aug 24.

Exploring Microbiome Functional Dynamics through Space and Time with Trait-Based Theory

Affiliations

Exploring Microbiome Functional Dynamics through Space and Time with Trait-Based Theory

Leonora S Bittleston et al. mSystems. .

Abstract

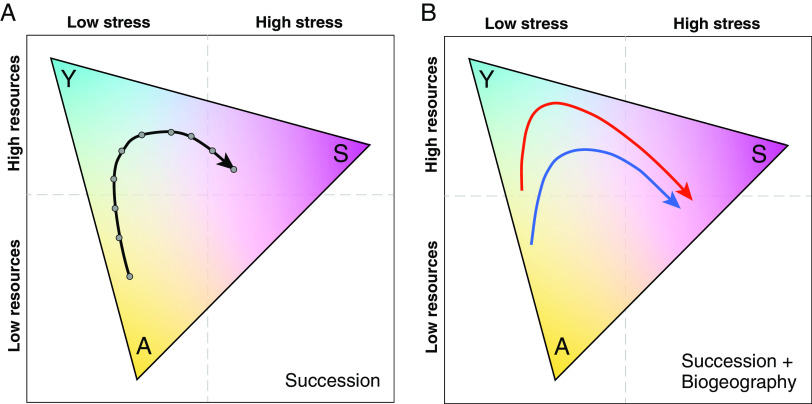
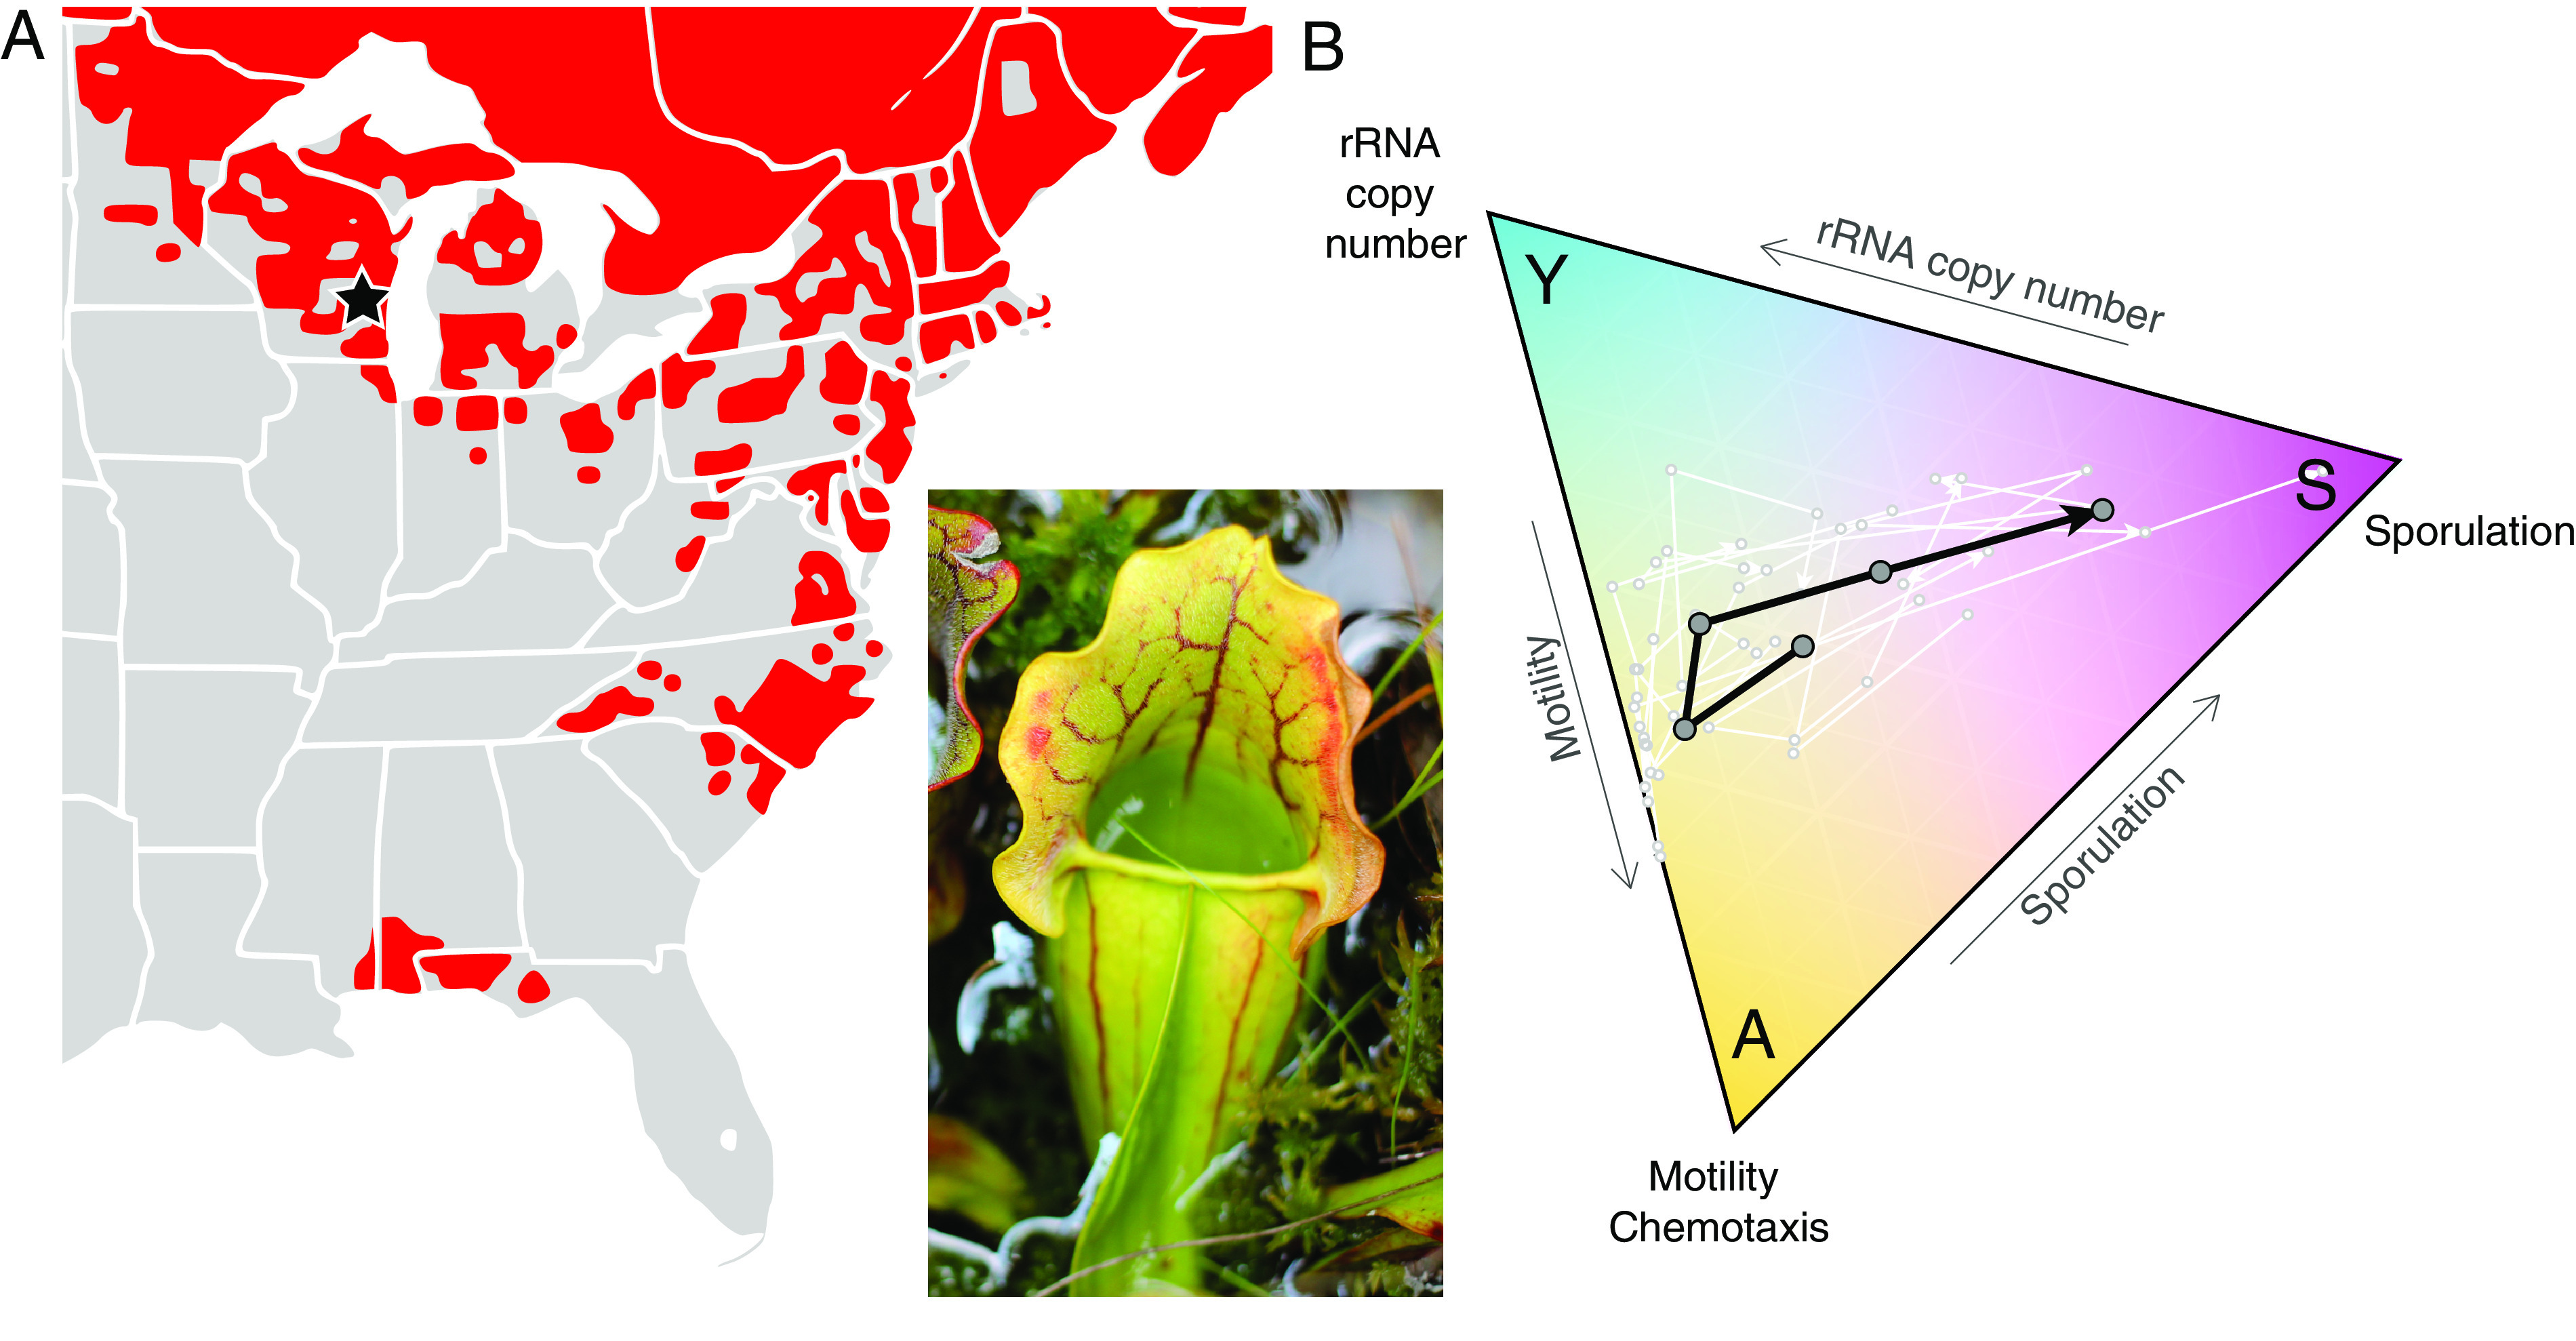
Microbiomes play essential roles in the health and function of animal and plant hosts and drive nutrient cycling across ecosystems. Integrating novel trait-based approaches with ecological theory can facilitate the prediction of microbial functional traits important for ecosystem functioning and health. In particular, the yield-acquisition-stress (Y-A-S) framework considers dominant microbial life history strategies across gradients of resource availability and stress. However, microbiomes are dynamic, and spatial and temporal shifts in taxonomic and trait composition can affect ecosystem functions. We posit that extending the Y-A-S framework to microbiomes during succession and across biogeographic gradients can lead to generalizable rules for how microbiomes and their functions respond to resources and stress across space, time, and diverse ecosystems. We demonstrate the potential of this framework by applying it to the microbiomes hosted by the carnivorous pitcher plant Sarracenia purpurea, which have clear successional trajectories and are distributed across a broad climatic gradient.

Keywords: Y-A-S; biogeography; ecosystem function; microbiome; pitcher plant; succession; trait.


Figures

FIG 1
FIG 1
Hypothetical successional trajectories of microbiomes within the Y-A-S framework. (A) A successional trajectory where each gray dot represents a temporal sample. Low initial resource conditions result in a microbiome composed predominantly of nutrient acquisition (A) traits. Resources accumulate over time, and the microbiome shifts in functional composition toward high-yield (Y) traits before biotic and/or abiotic stressors start to favor stress tolerance (S) traits at the end of the successional trajectory. (B) Successional trajectories for tropical (red line) and temperate (blue line) microbiomes, which under the latitudinal diversity gradient hypothesis would have greater resources in the tropics. The tropical trajectory (red line) starts at a higher resource level and thus with the predominance of (Y) traits, while the temperate system begins in low-resource conditions with a greater representation of (A) traits. The tropical trajectory maintains a greater prevalence of (Y) traits than the temperate trajectory as resources accumulate through time until both trajectories increase in stress tolerator (S) traits toward the end of succession.
FIG 2
FIG 2
(A) Distribution of S. purpurea in red (Noah Elhardt, public domain) with a pitcher (inset; photograph by L. Bittleston). (B) An example of how S. purpurea pitcher microbiomes move through the Y-A-S functional space during succession. This ternary plot uses PICRUSt2 functional output of 16S rRNA data averaged over 10 pitchers in a single wetland population in Wisconsin (black star in panel A). Dots are samples from 3, 7, 14, 28, and 62 days after pitcher-opening, and arrows indicate the direction of time. The white lines connect the data from each pitcher, while the black line shows the mean across all 10 pitchers. For this preliminary test, we chose single traits to represent each strategy. For motility, we summed the normalized abundances of all genes at the KO level that contained “chemotaxis protein” in their descriptions. Similarly, for sporulation, we summed all that contained “sporulation protein.” For a community measure of rRNA copy number, we weighted the estimated rRNA copy number for each amplicon sequence variant (ASV) by its relative abundance. We recognize that rRNA copy number is not an ideal trait to represent the Y strategy, as it is correlated with maximum growth rate, which does not always translate to higher yield (4, 16); furthermore, it is often not accurately predicted by 16S data (48). A measure of microbial growth efficiency would be a better Y trait; however, it was not available for these data. Data and code are available at https://doi.org/10.7910/DVN/Z0FQK7.

References

    1. Allison SD. 2012. A trait-based approach for modelling microbial litter decomposition. Ecol Lett 15:1058–1070. doi:10.1111/j.1461-0248.2012.01807.x. - DOI - PubMed
    1. Litchman E, Edwards KF, Klausmeier CA. 2015. Microbial resource utilization traits and trade-offs: implications for community structure, functioning, and biogeochemical impacts at present and in the future. Front Microbiol 6:254. doi:10.3389/fmicb.2015.00254. - DOI - PMC - PubMed
    1. Martiny JBH, Jones SE, Lennon JT, Martiny AC. 2015. Microbiomes in light of traits: a phylogenetic perspective. Science 350:aac9323. doi:10.1126/science.aac9323. - DOI - PubMed
    1. Westoby M, Nielsen DA, Gillings MR, Litchman E, Madin JS, Paulsen IT, Tetu SG. 2021. Cell size, genome size, and maximum growth rate are near‐independent dimensions of ecological variation across bacteria and archaea. Ecology and Evolution 11:3956–3976. doi:10.1002/ece3.7290. - DOI - PMC - PubMed
    1. Koch AL. 2001. Oligotrophs versus copiotrophs. Bioessays 23:657–661. doi:10.1002/bies.1091. - DOI - PubMed

LinkOut - more resources