

Foxm1 regulates neural progenitor fate during spinal cord regeneration
- PMID: 34427977
- PMCID: PMC8419688
- DOI: 10.15252/embr.202050932
Foxm1 regulates neural progenitor fate during spinal cord regeneration
Abstract
Xenopus tadpoles have the ability to regenerate their tails upon amputation. Although some of the molecular and cellular mechanisms that globally regulate tail regeneration have been characterised, tissue-specific response to injury remains poorly understood. Using a combination of bulk and single-cell RNA sequencing on isolated spinal cords before and after amputation, we identify a number of genes specifically expressed in the spinal cord during regeneration. We show that Foxm1, a transcription factor known to promote proliferation, is essential for spinal cord regeneration. Surprisingly, Foxm1 does not control the cell cycle length of neural progenitors but regulates their fate after division. In foxm1-/- tadpoles, we observe a reduction in the number of neurons in the regenerating spinal cord, suggesting that neuronal differentiation is necessary for the regenerative process. Altogether, our data uncover a spinal cord-specific response to injury and reveal a new role for neuronal differentiation during regeneration.
Keywords: Xenopus; Foxm1; differentiation; regeneration; spinal cord.
© 2021 The Authors. Published under the terms of the CC BY 4.0 license.
Conflict of interest statement
The authors declare that they have no conflict of interest.
Figures

- A
Twenty spinal cords of NF50 tadpoles were isolated at 0, 1 and 3 days post‐amputation (dpa) and pooled for RNA sequencing.
- B
Genes with a |log2(FC)|> 1 and P‐adj< 0.01 were used for hierarchical clustering. For each cluster, the gene list was uploaded on Fidea (
http://circe.med.uniroma1.it/fidea/ ) (D’Andrea et al, 2013). The five most significant enrichment of GO (biological processes) terms are shown, and the −log10(P_value) with Bonferroni correction is shown. - C
The dataset was uploaded on the Ingenuity Pathway Analysis software (Qiagen). Genes with a |log2(FC)|> 1 and P_adj < 0.01 were considered. The software identified upstream regulators based on the changes in expression levels of known downstream targets. Each upstream regulator is attributed a z‐score, corresponding to the negative log of the P‐value derived from the Fisher’s exact test.
- D
Changes in the expression of foxm1 and known downstream targets in the whole tail comparing day 0 and day 3 (WT_d0d3) and in the spinal cord comparing day 0 and day 1 (SC_d0d1) and day 0 and day 3 (SC_d0d3). The whole tail dataset was obtained from (Chang et al, 2017).
- E
Tadpoles at NF50 were amputated, fixed at the indicated time and then processed for whole‐mount in situ hybridisation using a probe specific for foxm1. The two last panels show transverse section in the non‐regenerating spinal cord (nr) and the regenerate (r) at 3dpa. The red circle highlights the spinal cord and the asterisk the notochord.
- F
Total RNA was isolated from regenerating tails at indicated timepoints post‐amputation, reverse‐transcribed into cDNA and analysed for foxm1 expression by qPCR, using ef1α as a reference gene. The graph represents the mean ± SD of three independent experiments. One‐way ANOVA with Dunnett’s multiple comparison test was used. *P = 0.0149.

- A
Principal component analysis to assess overall similarities between all samples. The biological replicates of day 0 (0 dpa, green square), day 1 (1 dpa, red circle) and day 3 post‐amputation (3 dpa, blue triangle) cluster together whilst showing wide variation in the two dimensions shown on the graph.
- B
Hierarchical clustering of the nine datasets.
- C, D
MA plots depicting the log2 fold change against the mean of normalised counts. DE genes (P_adj< 0.05) are coloured in red when comparing day 0 versus day 1 (C) and day 0 versus day 3 (D).
- E
Total number of differentially up‐ and downregulated (|Log2(FC)|> 1, P_adj< 0.01) transcripts in 0 dpa versus 1 dpa and 0 dpa versus 3 dpa samples.
- F
Schematic of the experiment designed to identify the signals upstream of foxm1 expression. After amputation, the tails were left to heal for 36h before inhibitor treatments were started. The tails were collected at 72hpa, and foxm1 expression was determined by RT–qPCR.
- G–I
Effects of treating tadpoles with 4 µM DPI (a NOX inhibitor, G), 20 µM SU5402 (an FGFR inhibitor, H) and 2.5 µM cyclopamine (a Hedgehog signalling inhibitor, I) on foxm1 expression. DMSO was used as a control for G and H and ethanol for I.

- A
The CRISPR/Cas9 system was used to generate foxm1 knockdown and knockout animals, and gRNA was designed to target the foxm1 gene. The target region contains the restriction site for NcoI and was used to test efficiency by RFLP.
- B
Embryos were either uninjected (UI) or coinjected with gRNA and Cas9mRNA, 0.6 ng Cas9 protein or 1.5 ng Cas9 protein. Genomic DNA was extracted and a region amplified around the gRNA target site by PCR. Half of the PCR product was digested with NcoI. By comparing the ratio of the digested product with an intact restriction site (lower band) to the non‐digested product containing a mutated restriction site (upper band) after the addition of NcoI (+) gives an indication of the efficiency of the induction of mutations.
- C
Frogs injected with the CRISPR/Cas9 system and raised to adulthood. The F1 embryos were sequenced for mutations in foxm1. Four frameshift mutations were identified.
- D
Genotypes used in this study.
- E
Tadpoles from a foxm1 +/− cross were raised to NF50, amputated and the tails collected at 3dpa for RNA expression and the heads for genotyping. Foxm1 expression was analysed by qPCR, using ef1α as a reference (n = 3 with at least 3 embryos per sample). The data are expressed as the mean ± SD.
- F
A third of the tails of foxm1 knockdown (Crispr mosaic F0) and wt tadpoles at NF50 were amputated and the tadpoles left to regenerate for 9 days. The images show representative tails at 9dpa.
- G, H
To quantify the rate of regeneration, the ratio of the length of the regenerate to the length that has originally be amputated was compared for the spinal cord (G) and the whole tail (H). The graph represents the mean ± SD of three independent experiments with at least five tadpoles in each experiment.

- A
Metadata of the scRNA‐seq experiment.
- B
t‐SNE representation of the dataset from 0 dpa with the different cell types identified using a dynamic tree cut algorithm.
- C
Bubble plot representing the proportion of cells (size of the dot) and level of expression (colour of the dot) for the genes used to identify the cell types in (B).

- A
UMAP representation of the scRNA‐seq dataset before (left panel) and after (right panel) batch correction using Seurat.
- B
Unbiased acceptance rate at the indicated subsampling percentile in the raw data (Counts) and after batch correction using Harmony or Seurat algorithm.
- C
Unsupervised pseudo‐time of the whole scRNA‐seq dataset. The distribution of the different clusters along the pseudo‐time is indicated with the colours and numbers as described in Fig 3F.
- D
Pseudo‐time of the whole scRNA‐seq dataset with cells from 0 dpa in orange and from 3 dpa in green.
- E
Pseudo‐time representation showing the cells expressing foxm1 (red dots).
- A
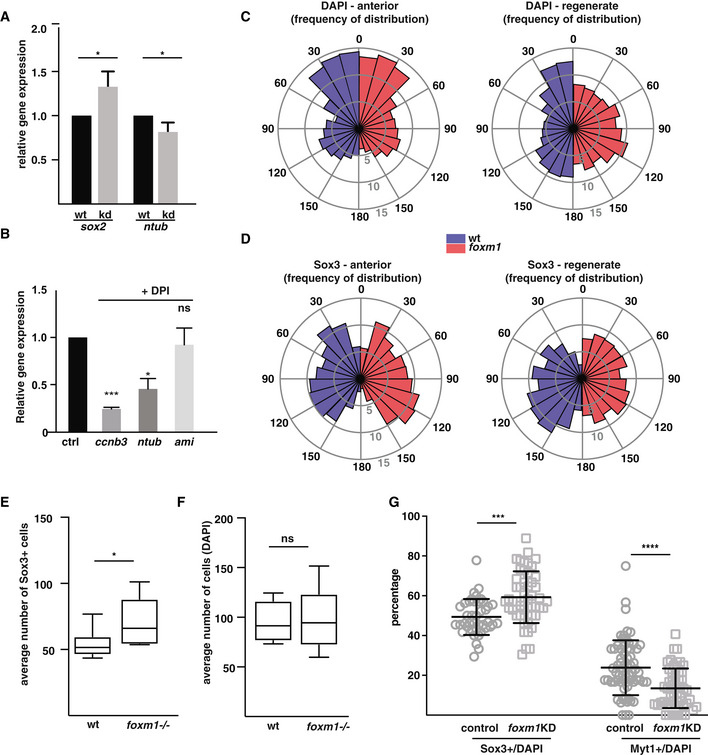
Tails from tadpoles foxm1 knockdown (mosaic Crispr F0, kd) and control (wt) NF50 tadpoles were amputated and left to regrow for 3 days. RNA was isolated from the regenerates and expression levels of sox2 and ntubulin analysed by qPCR using ef1α as a reference. sox2: n = 4, ntubulin: n = 6, with at least 20 tails per sample,
- B
Effect of DPI treatment on the expression of known transcriptional targets of Foxm. Embryos were treated with DPI as described in Fig EV1F, and the expression of ccnb3 (a Foxm1 target gene), ntub (a marker of differentiated neurons) and ami (a gene expressed in endothelial cells) was analysed by RT–qPCR using ef1α as control.
- C, D
Rose plot histograms showing the percentage frequency distribution of the angles of DAPI+ nuclei (C) or Sox3+ nuclei (D) in wt (blue) or foxm1 −/− spinal cords (red). Angles are distributed into 12 bins from 0 to 180 degrees using a MATLAB script. Dorsal = 0 degrees, lateral = 90 degrees and ventral = 180 degrees. The inner, middle and outer circle corresponds to 5, 10 and 15%, respectively. Ten sections from n = 4 animals were analysed per genotype. Total cell counts were as follows: wt anterior (DAPI+ 2166; Sox3+, 701), foxm1 −/− anterior (DAPI+, 2246; Sox3+, 707), wt regenerate (DAPI+, 1927 nuclei; Sox3+, 826) and foxm1 −/− regenerate (DAPI+, 2393; Sox3+, 1125). P < 0.0001 for regenerate spinal cords and P > 0.05 for anterior spinal cords as analysed by Kolmogorov–Smirnov tests.
- E, F
Quantification of the absolute number of cells per section expressing Sox3 (E) and nuclei (DAPI, F) in the regenerate of wild type (wt) and foxm1 −/− knockout tadpoles at 5 dpa. The number is derived from the same sections analysed in Fig 5C, and the quantification is derived from the analysis of 8 tadpoles with an average of 15 sections per tail.
- G
The tails of control and foxm1KD animals, fixed at 5 days post‐amputation, were sectioned and labelled with the Sox3 or Myt1 antibody followed by DAPI staining. The ratio of Sox3 and Myt1 per number of DAPI stained nuclei in the spinal cord was quantified and compared between control and foxm1KD tadpoles. Sox3 wt n = 6 with 41 sections, CRISPR/Cas9 n = 5 with 50 sections, Myt1 wt = 8 with 67 sections and foxm1KD n = 7 with 53 sections.

- A
NF40 tadpoles with the following genotypes foxm1 −/− (mut), foxm1 +/− (het) and foxm1 +/+ (wt) were amputated and left to regenerate for 7 days. The images show representative tails at 3 and 7 dpa. The white arrowheads indicate the amputation site.
- B
Quantification of the rate of regeneration. The ratio of the length of the tail regenerate at 3 and 7 dpa was compared to the length of the tail originally amputated at 0 dpa. The graph represents the mean ± SD of five independent experiments from three different clutches with at least five tadpoles in each experiment.
- C
Experimental setup for EdU labelling, foxm1 knockout and wt tadpoles were amputated and left to regenerate for 3 days. Tadpoles were then injected with EdU and 2 days later the tails were fixed, sectioned and stained for EdU and DAPI.
- D
Representative images of EdU (red) and DAPI (blue) staining at 5 dpa.
- E
The graph represents the mean ± SD of EdU+ cells over the total number of cells in the spinal cord of 5–12 tadpoles. Each data point represents a tadpole, with an average of 9 sections analysed per animal.
- F
Experimental setup for Dual‐Pulse S‐phase Labelling: NF50 tadpoles at 3 dpa were injected with EdU, and 3 h later, the same tadpoles were injected with BrdU. Six hours after the first injection, the tails were fixed, sectioned and labelled for Sox3, Edu, BrdU and DAPI.
- G
Representative images of EdU (green), BrdU (magenta), Sox3 (white) and DAPI (blue) staining at 3 dpa.
- H
Quantification of images in (G). The graph represents the mean ± SD of 6 tadpoles with an average of 13 sections per tadpole analysed.

- A
UMAP representation of the whole scRNA‐seq dataset (0 dpa and 3 dpa) showing the cell density distribution of the 3 dpa sample.
- B–E
Expression of snap25 (neuronal marker), leptin, sox2 (progenitor marker) and foxm1 on the same UMAP representation as in (A).
- F
UMAP representation of the 16 clusters identified in the scRNA‐seq dataset.
- G
Identity of the clusters with the most significant differentially expressed gene(s).
- H
Schematic representation of the cells used to identify DE genes and over‐representation of GO terms for cluster 5 (blue cells) corresponding to the foxm1 + cluster against the rest of the progenitor cells (red cells).
- I
Twenty most significantly DE genes comparing blue versus red cells ranked by FDR.
- J
GO‐Slim Biological Process terms over‐represented were identified by uploading the DE genes into PANTHER. The GO terms significantly upregulated were then inputted into Revigo (
http://revigo.irb.hr/ ) to generate a plot representation.

- A
UMAP projection with inferred cell cycle phase for each cell.
- B
Bar plot showing the proportion of cells in G1, G2/M and S phases of clusters of progenitor cells (prog., expressing sox2 and sox3) and differentiating progenitors (diff. prog., expressing neurod1, neurog1) and neurons (neur., expressing snap25). The total does not always amount to 100% as some clusters have cells from both 0 and 3 dpa. The bar boxes in red represent the foxm1 positive cluster, and the cluster numbering refers to the cluster identity defined in Fig 3G.
- C
Representative sections labelled with an anti‐PCNA antibody (red) and DAPI (blue) at the indicated day after amputation (dpa). The white arrowheads point to cells in S phase in the spinal cord and the yellow arrowhead at cells in G1, G2 and M phases. The right panels correspond to the inset indicated as a white box in the middle panels.
- D
The ratio of PCNA+ per total number of cells (DAPI) in the spinal cord was determined at the indicated times after amputation (n = 3, with a mean of 14 sections per data point).
- E
The PCNA+ cells were then distributed in G1/G2 (diffuse signal), S (punctated signal) or M phase (condensed chromatin) at the indicated stage of regeneration.

- A
Representative sections of spinal cords from tadpoles injected with EdU at 3 dpa and fixed at 5 dpa. After sectioning, the samples were labelled with antibodies against Sox3 (green), EdU (magenta) and DAPI (blue). White arrowheads show Sox3 positive extensions.
- B
Sections of spinal cords at 5 dpa in the stump (non‐regen.) or in the regenerate (regen) labelled with anti‐Sox3 (green), anti‐Acetylated Tubulin (AcTub, magenta) and DAPI (blue). White arrowheads show Sox3 positive extensions.
- C
Quantification of the images shown in (A). The ratio of Sox3+ per total number of cells (DAPI) in the spinal cord was determined in the stump (non‐regen.) and the regenerating spinal cord (regen.) in wt and foxm1 −/− tadpoles (n = 3–8, with an average of 15 sections per data point).
- D
Quantification of the proportion of cycling progenitors (Sox3+EdU+/DAPI, S3+E+/DAPI), the proportion of progenitors having divided (Sox3+EdU+/Sox3+, S3+E+/S3+) and the proportion of progenitors self‐renewal (Sox3+EdU+/EdU+, S3+E+/E+) in the regenerate. The graph represents the mean ± SD from 9 tadpoles (wt) and 8 tadpoles (foxm1 −/−) with an average of 18 sections per data point.
- E
Representative sections of spinal cords from tadpoles injected with EdU at 3 dpa and fixed at 5 dpa. After sectioning, the samples were labelled with antibodies against Myt1 (green), EdU (magenta) and DAPI (blue).
- F
Quantification of images shown in (E). The graph represents the mean ± SD from 3 tadpoles with an average of 12 sections each.

References
-
- Beck CW, Christen B, Slack JM (2003) Molecular pathways needed for regeneration of spinal cord and muscle in a vertebrate. Dev Cell 5: 429–439 - PubMed
Publication types
MeSH terms
Grants and funding
LinkOut - more resources
Full Text Sources
Medical
Miscellaneous
