

Group IIA secreted phospholipase A2 is associated with the pathobiology leading to COVID-19 mortality
- PMID: 34428181
- PMCID: PMC8483752
- DOI: 10.1172/JCI149236
Group IIA secreted phospholipase A2 is associated with the pathobiology leading to COVID-19 mortality
Abstract
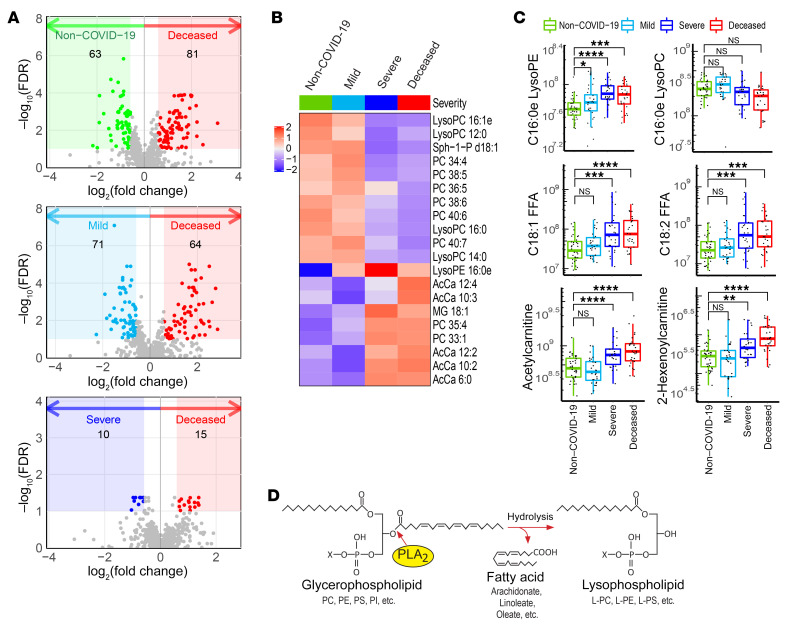
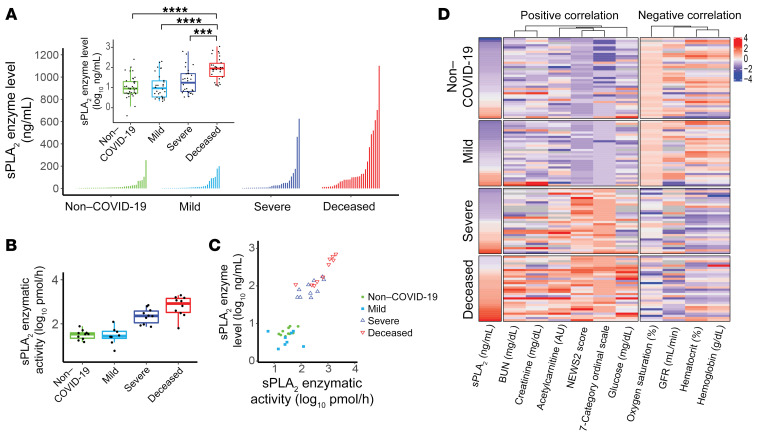
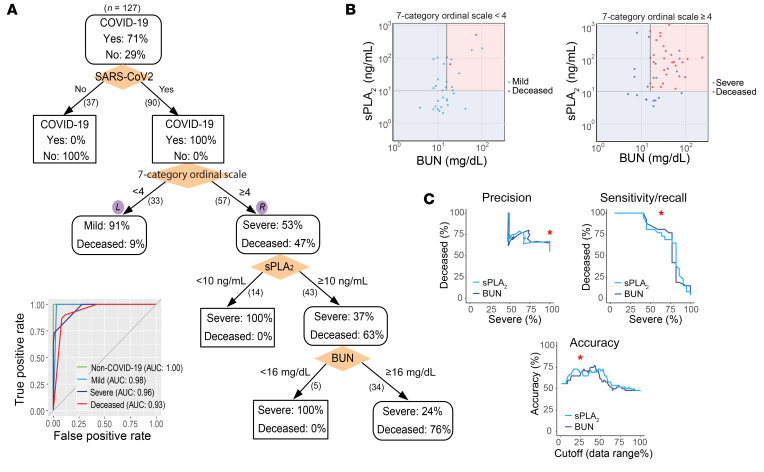
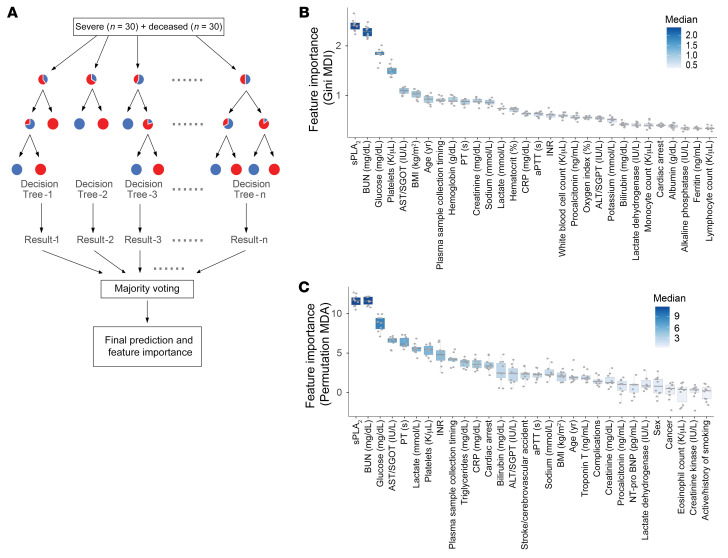
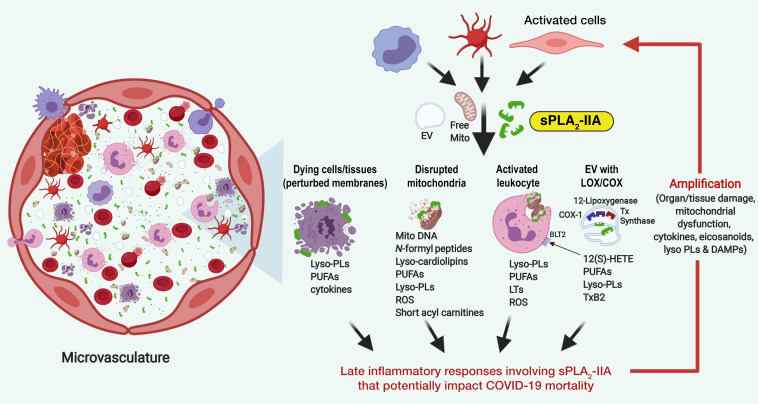
There is an urgent need to identify the cellular and molecular mechanisms responsible for severe COVID-19 that results in death. We initially performed both untargeted and targeted lipidomics as well as focused biochemical analyses of 127 plasma samples and found elevated metabolites associated with secreted phospholipase A2 (sPLA2) activity and mitochondrial dysfunction in patients with severe COVID-19. Deceased COVID-19 patients had higher levels of circulating, catalytically active sPLA2 group IIA (sPLA2-IIA), with a median value that was 9.6-fold higher than that for patients with mild disease and 5.0-fold higher than the median value for survivors of severe COVID-19. Elevated sPLA2-IIA levels paralleled several indices of COVID-19 disease severity (e.g., kidney dysfunction, hypoxia, multiple organ dysfunction). A decision tree generated by machine learning identified sPLA2-IIA levels as a central node in the stratification of patients who died from COVID-19. Random forest analysis and least absolute shrinkage and selection operator-based (LASSO-based) regression analysis additionally identified sPLA2-IIA and blood urea nitrogen (BUN) as the key variables among 80 clinical indices in predicting COVID-19 mortality. The combined PLA-BUN index performed significantly better than did either one alone. An independent cohort (n = 154) confirmed higher plasma sPLA2-IIA levels in deceased patients compared with levels in plasma from patients with severe or mild COVID-19, with the PLA-BUN index-based decision tree satisfactorily stratifying patients with mild, severe, or fatal COVID-19. With clinically tested inhibitors available, this study identifies sPLA2-IIA as a therapeutic target to reduce COVID-19 mortality.
Keywords: COVID-19; Cellular immune response; Inflammation; Molecular pathology.
Conflict of interest statement
Figures
Similar articles
-
Temporal associations of plasma levels of the secreted phospholipase A2 family and mortality in severe COVID-19.Eur J Immunol. 2024 Jun;54(6):e2350721. doi: 10.1002/eji.202350721. Epub 2024 Apr 23. Eur J Immunol. 2024. PMID: 38651231
-
Group IIA Secreted Phospholipase A 2 Plays a Central Role in the Pathobiology of COVID-19.medRxiv [Preprint]. 2021 Feb 23:2021.02.22.21252237. doi: 10.1101/2021.02.22.21252237. medRxiv. 2021. PMID: 33655264 Free PMC article. Preprint.
-
Serum secretory phospholipase A2-IIa (sPLA2-IIA) levels in patients surviving acute myocardial infarction.Eur Rev Med Pharmacol Sci. 2013 Apr;17(8):999-1004. Eur Rev Med Pharmacol Sci. 2013. PMID: 23661511
-
Secreted Phospholipase A2 Type IIA (sPLA2-IIA) Activates Integrins in an Allosteric Manner.Adv Exp Med Biol. 2017;925:103-115. doi: 10.1007/5584_2016_95. Adv Exp Med Biol. 2017. PMID: 27864802 Review.
-
Secretory phospholipase A2 of group IIA: is it an offensive or a defensive player during atherosclerosis and other inflammatory diseases?Prostaglandins Other Lipid Mediat. 2006 Mar;79(1-2):1-33. doi: 10.1016/j.prostaglandins.2005.10.005. Epub 2005 Dec 27. Prostaglandins Other Lipid Mediat. 2006. PMID: 16516807 Review.
Cited by
-
Possible Application of Melatonin in Long COVID.Biomolecules. 2022 Nov 7;12(11):1646. doi: 10.3390/biom12111646. Biomolecules. 2022. PMID: 36358996 Free PMC article. Review.
-
Plasma essential fatty acid on hospital admission is a marker of COVID-19 disease severity.Sci Rep. 2023 Nov 3;13(1):18973. doi: 10.1038/s41598-023-46247-0. Sci Rep. 2023. PMID: 37923927 Free PMC article.
-
Secretory Phospholipase A2 and Interleukin-6 Levels as Predictive Markers of the Severity and Outcome of Patients with COVID-19 Infections.Int J Mol Sci. 2023 Mar 14;24(6):5540. doi: 10.3390/ijms24065540. Int J Mol Sci. 2023. PMID: 36982611 Free PMC article.
-
Lipids in Equine Airway Inflammation: An Overview of Current Knowledge.Animals (Basel). 2024 Jun 18;14(12):1812. doi: 10.3390/ani14121812. Animals (Basel). 2024. PMID: 38929431 Free PMC article. Review.
-
Human Group IIA Phospholipase A2-Three Decades on from Its Discovery.Molecules. 2021 Nov 30;26(23):7267. doi: 10.3390/molecules26237267. Molecules. 2021. PMID: 34885848 Free PMC article. Review.
References
Publication types
MeSH terms
Substances
Grants and funding
- I01 BX002624/BX/BLRD VA/United States
- P30 ES006694/ES/NIEHS NIH HHS/United States
- P01 CA097132/CA/NCI NIH HHS/United States
- UL1 TR001420/TR/NCATS NIH HHS/United States
- R01 AI136934/AI/NIAID NIH HHS/United States
- K08 HL141623/HL/NHLBI NIH HHS/United States
- R01 AI135108/AI/NIAID NIH HHS/United States
- R35 GM118128/GM/NIGMS NIH HHS/United States
- R01 AT008621/AT/NCCIH NIH HHS/United States
- P30 CA023074/CA/NCI NIH HHS/United States
- R01 AI116420/AI/NIAID NIH HHS/United States
- R01 AI125770/AI/NIAID NIH HHS/United States
- R35 GM126922/GM/NIGMS NIH HHS/United States
LinkOut - more resources
Full Text Sources
Other Literature Sources
Medical
