. 2021 Aug 24;17(8):e1009335.
doi: 10.1371/journal.pcbi.1009335. eCollection 2021 Aug.

Ankyrin repeats in context with human population variation

Affiliations

Ankyrin repeats in context with human population variation

Javier S Utgés et al. PLoS Comput Biol. .

Abstract

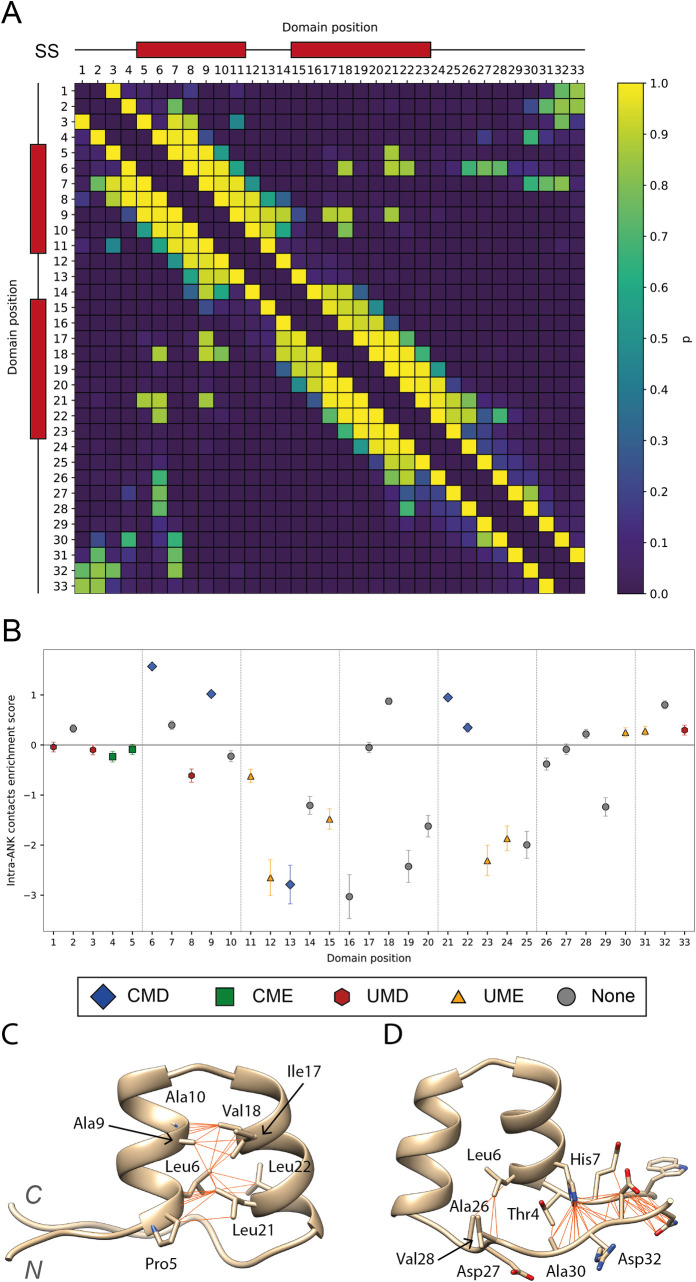
Ankyrin protein repeats bind to a wide range of substrates and are one of the most common protein motifs in nature. Here, we collate a high-quality alignment of 7,407 ankyrin repeats and examine for the first time, the distribution of human population variants from large-scale sequencing of healthy individuals across this family. Population variants are not randomly distributed across the genome but are constrained by gene essentiality and function. Accordingly, we interpret the population variants in context with evolutionary constraint and structural features including secondary structure, accessibility and protein-protein interactions across 383 three-dimensional structures of ankyrin repeats. We find five positions that are highly conserved across homologues and also depleted in missense variants within the human population. These positions are significantly enriched in intra-domain contacts and so likely to be key for repeat packing. In contrast, a group of evolutionarily divergent positions are found to be depleted in missense variants in human and significantly enriched in protein-protein interactions. Our analysis also suggests the domain has three, not two surfaces, each with different patterns of enrichment in protein-substrate interactions and missense variants. Our findings will be of interest to those studying or engineering ankyrin-repeat containing proteins as well as those interpreting the significance of disease variants.


Conflict of interest statement

The authors have declared that no competing interests exist.

Figures

Fig 1
Fig 1
(A) Sequence logo of the ANK obtained with WebLogo [5] derived from the MSA generated in this work. The Y axis indicates the probability of observing an amino acid at any position within the motif; (B) Tertiary structure of an ankyrin repeat, coloured by secondary structure class: helices in red and coil in blue; (C) Representation of the complementary surfaces of individual ARs that form the human gankyrin ARD surface. N- and C-capping AR surfaces are coloured in purple and green respectively, whereas internal ones are coloured in blue and orange. (PDB ID: 1UOH) [6]. Structure visualization with UCSF Chimera [7].
Fig 2
Fig 2
(A) Trio of ARs from a designed ankyrin repeat protein [14] (PDB: 5MA3). These three ARs display the main interactions responsible for the correct packing of the ARD. Hydrogen bond interactions are depicted by blue lines whereas hydrophobic ones are depicted in orange; (B) Hydrophobic network formed by Leu6 in the hydrophobic core of the domain; (C) Hydrogen bonding network at the β-turn between positions Asp32-Gly2; (D) Inter-repeat hydrogen bonds between conserved Asn29 and Asp27; (E) Thr4 forms three hydrogen bonds with His7. Structure visualization with UCSF Chimera [7].
Fig 3
Fig 3
(A) Upset plot [27] showing the distribution of ANK annotations and the overlap between different database signatures. The vertical bar plot shows the total number of repeat annotations per database signature, whereas the horizontal one represents the number of annotations that are shared by the different signatures, i.e., the intersection between different sets of repeat annotations. For example, 3,124 out of the 7,303 repeats annotated by UniProt are shared with PS50088 and SM00248. Most of the annotations are shared between UniProt, SM00248 and PS50088. UniProt presents ≈ 1000 unique annotations which are not present in any other database; (B) This bar plot indicates the number of ANK annotations per database signature: 7,230, 6,396, 4,119, 796, 233 and 55 from left to right; (C) This bar plot shows the composition of the dataset resulting from the database merging, with ProSite accounting for ≈ 55% of the annotations, SMART for ≈ 30% and UniProt for the last ≈ 15%.
Fig 4
Fig 4. Overview of the resulting MSA, including the 7,404 ankyrin repeat sequences.
Only columns with occupancy > 0.5% are shown. Sequences are sorted by a tree generated in Jalview using the average distance method and the BLOSUM62 matrix. Columns between 16–17 and after 33 represent insertions in some ankyrin repeats. Red boxes below the overview indicate the location of the secondary structure elements (SS), α-helices in this case, within the alignment. Grey dashed lines represent gaps and are mostly found at low-occupancy columns. Columns are coloured according to the ClustalX colour scheme [34]. Hydrophobic residues are coloured in blue, glycines in orange, prolines in yellow, polar residues in green and unconserved columns are coloured in white. Obtained with Jalview [35].
Fig 5
Fig 5. Diagram showing the main components of the pipeline.
VarAlign retrieves variants found in human sequences in the MSA from gnomAD. ProIntVar retrieves structures from the PDBe and runs DSSP and Arpeggio to get secondary structure, accessible surface area and inter-atomic contacts information. Everything is mapped back to the residues and MSA columns [40].
Fig 6
Fig 6
(A) Normalised Shenkin divergence score per domain position (Eq 3) calculated from the MSA containing 7,404 sequences. Positions are coloured according to their normalised Shenkin score as the legend indicates; (B) Secondary structure assignment per position. Within each position, each coloured bar represents the frequency of the eight states defined by DSSP: α-helix, 310-helix, π-helix, β-bridge, β-strand, turn, bend and coil, observed for the residues with structural coverage at that column in the MSA. Most helices range from 5–11 and 15–23 and finish in 5-turns, usually at positions 12–13 and 23–24. Two β-turns are observed at positions 28–29 and 33–1; (C) Median residue relative surface accessibility per position, calculated from DSSP’s accessible surface area [42] as described in Tien et al [48]. Error bars indicate 95% CI of the median. Positions were classified according to the specified thresholds: surface (RSA ≥ 25%), partially exposed (5% < RSA < 25%) or buried (RSA ≤ 5%) [49].
Fig 7
Fig 7. Hydrogen bonding patterns of the two Asx motifs found in the ANK and their location within the ARD.
Only repeats with either Asn or Asp at these positions will present this hydrogen bonding pattern. (A) Asx-β-turn at positions 27–30. Conserved Asx, i.e., Asp/Asn, side chain at position i = 27 forms an extra hydrogen bond with backbone N at position i + 2; (B) Type 1 β-bulge loop with Asx motif at positions 32–3. Conserved Asx side chain at domain position i = 32 forms two hydrogen bonds with backbone N of residues i + 2 and i + 4. The rest of the hydrogen bonds originate from the backbone of the residues and are not specific of Asx motifs. PDB: 5MA3 [14]; (C) DARPin-8.4 (Barandun J, Schroeder T, Mittl PRE, Grutter MG) PDB: 2Y1L. Light blue lines represent the hydrogen bonds that determine these secondary structure motifs. The conservation of the Asx residues at positions 27 and 32, and the hydrogen bonding network they facilitate, suggest that these Asx motifs are one of the most structurally important components of the ankyrin repeat domain structure. Figure obtained with UCSF Chimera [7].
Fig 8
Fig 8
Comparison of the original definition of the ARD surfaces (A, B) with the new definitions derived from the results of this study (C, D). All panels refer to the D34 region of ANK1 ARD, PDB accession: 1N11 [53]. This structure shows 12 out of the 23 ARs found on this ARD; (A) Surface of an ARD. Residues conforming the concave surface are coloured in orange, residues on the convex surface in green and buried residues in blue; (B) Structure of an individual repeat. The first α-helix and the β-turn region form the concave surface, whereas the second helix and the loop form the convex one; (C) Residues forming the concave surface are coloured in dark red, residues on the convex surface in orange, the basal surface is coloured on dark green and buried residues in blue; (D) Structure of an individual repeat with new surface classification. Figure obtained with UCSF Chimera [7].
Fig 9
Fig 9
(A) Relative Missense Enrichment Score (MES) against normalised Shenkin divergence score for the 33 positions of the domain. Blue diamonds: CMD positions (6, 9, 13, 21, 22); Green squares: CME positions (4, 5), UMDs are coloured in red hexagons (1, 3, 8, 33) and UMEs in orange triangles (11, 12, 15, 23, 24, 30, 31). Error bars represent 95% CI of the MES, i.e., ln (OR). Positions coloured in grey circles are classed as “None”, for they do not meet our divergence score thresholds; (B) D34 region of ANK1 ARD, PDB accession: 1N11 [53] This structure shows 12 out of the 23 ARs found on this ARD. Residues are coloured according to the missense enrichment score of the alignment column they align to in the MSA. The colour scale goes from blue (missense-depleted) to red (missense-enriched) going through white (neutral). From left to right, the full domain, then concave, convex and basal surface are coloured. On each of the last three representations, only one surface is coloured. Residues that are not constitutive of the displayed surface are coloured in grey. Overall, the concave surface is coloured in a light blue colour (except positions 11 and 12), indicating its depletion in missense variants, relative to the other positions within the ANK. Figure obtained with UCSF Chimera [7].
Fig 10
Fig 10
(A) Contact map for intra-repeat residue-residue interactions. Cells are coloured according to the probability of observing contact between two positions with the viridis colour palette. Red boxes above axis indicate the location of the secondary structure (SS) elements, α-helices, in the motif; (B) Intra-repeat contacts enrichment plot. Error bars indicate 95% CI of the enrichment score, i.e., ln (OR). Data points are coloured according to their missense enrichment and residue conservation classification (Fig 9); (C) Cluster of intra-repeat contacts between the first and second helices. Residues 5, 6, 9 and 10 in the first helix interact with residues 17, 18, 21 and 22 by forming hydrophobic interactions. These positions are all buried and conserved; (D) Cluster of intra-repeat contacts between the start and end residues of an AR. These interactions are not as specific as the ones in the first cluster and they include diverse positions such as 1, 3, 31 or 33. These are the most frequently observed contacts across all structure displayed in an example repeat. PDB: 5MA3 [14]. Figure obtained with UCSF Chimera [7].
Fig 11
Fig 11
(A) Protein-substrate interactions enrichment plot. Error bars indicate 95% CI of the protein-protein interactions enrichment score (PPIES), i.e., ln (OR). Data points are coloured according to their surface classification (Table 1); (B) D34 region of ANK1 ARD, PDB accession: 1N11 [53]. This structure shows 12 out of the 23 ARs found on this ARD. Residues are coloured according to the PPIES of the alignment column they align to in the MSA. The colour scale goes from blue (depleted in PPIs) to orange (enriched in PPIs) going through white (neutral). From left to right, the whole domain, then the concave, convex and basal surface are coloured. On each of the last three representations, only one surface is coloured. Residues not belonging in that surface are coloured in grey. Overall, the concave surface is coloured in a strong orange colour, indicating its importance in protein binding, whereas the basal one presents a dark blue colour, indicative of its overall depletion in PPIs. Figure obtained with UCSF Chimera [7].
Fig 12
Fig 12. ARDs in complex with substrates.
(A) RFXANK and RFX5 (PDB ID: 3V30) [56]; (B) ANRA2 and HDAC4 (3V31); (C) TNKS2 and ARPIN (4Z68) [59]; (D) TNKS1 and USP25 (5GP7) [60]. UMD positions (red) and UMEs 11, 12 (orange) are conserved across proteins that bind similar substrates (dark cyan). For example, these positions are conserved across TNKS2 and TNKS1, which are known to bind substrates with the motif RXXPDG (purple). Similarly, RFXANK and ANRA2, bind substrates with the motif PXLPX[I/L] (purple). Figure obtained with UCSF Chimera [7].

References

    1. Bork P. Hundreds of ankyrin-like repeats in functionally diverse proteins: mobile modules that cross phyla horizontally? Proteins. 1993;17(4):363–74. Epub 1993/12/01. doi: 10.1002/prot.340170405 . - DOI - PubMed
    1. Andrade MA, Perez-Iratxeta C, Ponting CP. Protein repeats: structures, functions, and evolution. J Struct Biol. 2001;134(2–3):117–31. Epub 2001/09/12. doi: 10.1006/jsbi.2001.4392 . - DOI - PubMed
    1. Sedgwick SG, Smerdon SJ. The ankyrin repeat: a diversity of interactions on a common structural framework. Trends Biochem Sci. 1999;24(8):311–6. Epub 1999/08/04. doi: 10.1016/s0968-0004(99)01426-7 . - DOI - PubMed
    1. Forrer P, Stumpp MT, Binz HK, Pluckthun A. A novel strategy to design binding molecules harnessing the modular nature of repeat proteins. FEBS Lett. 2003;539(1–3):2–6. Epub 2003/03/26. doi: 10.1016/s0014-5793(03)00177-7 . - DOI - PubMed
    1. Crooks GE, Hon G, Chandonia JM, Brenner SE. WebLogo: a sequence logo generator. Genome Res. 2004;14(6):1188–90. Epub 2004/06/03. doi: 10.1101/gr.849004 ; PubMed Central PMCID: PMC419797. - DOI - PMC - PubMed

Publication types