. 2021 Aug 24;16(8):e0256029.
doi: 10.1371/journal.pone.0256029. eCollection 2021.

Development of a standardized MRI protocol for pancreas assessment in humans

Affiliations

Development of a standardized MRI protocol for pancreas assessment in humans

John Virostko et al. PLoS One. .

Abstract

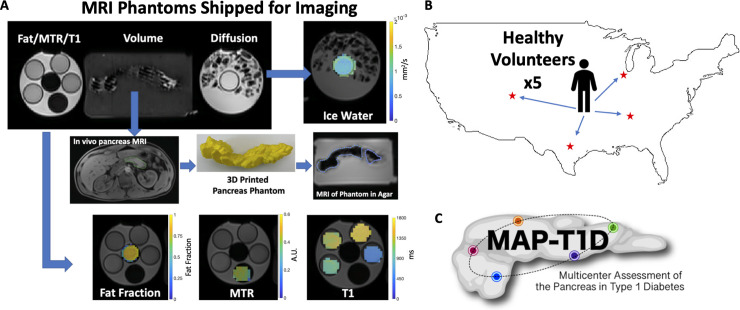
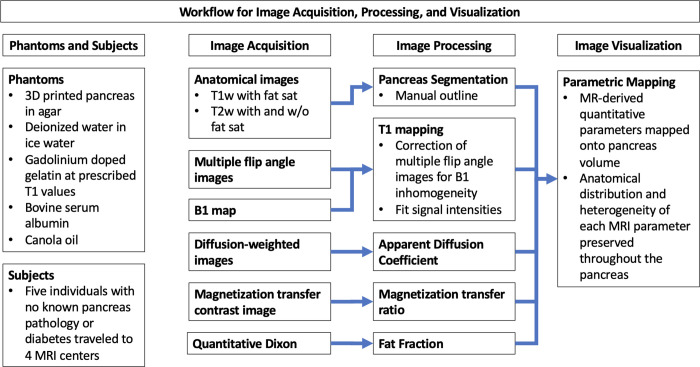
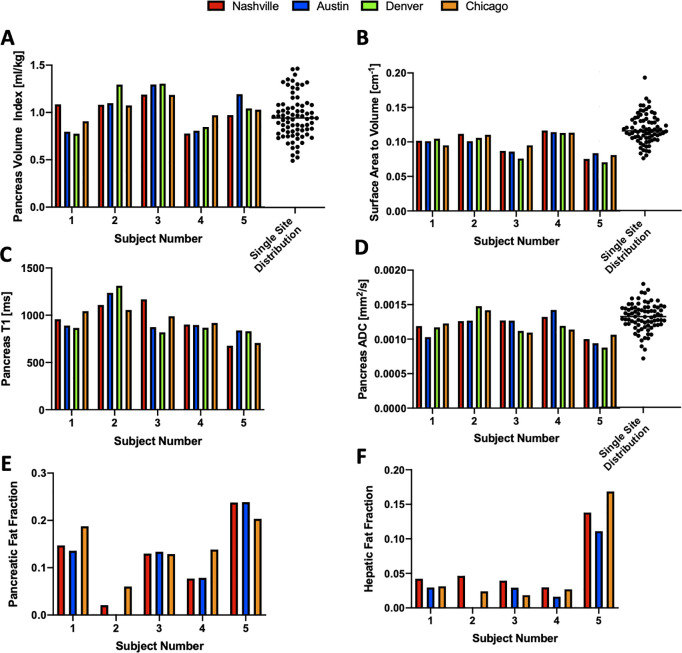
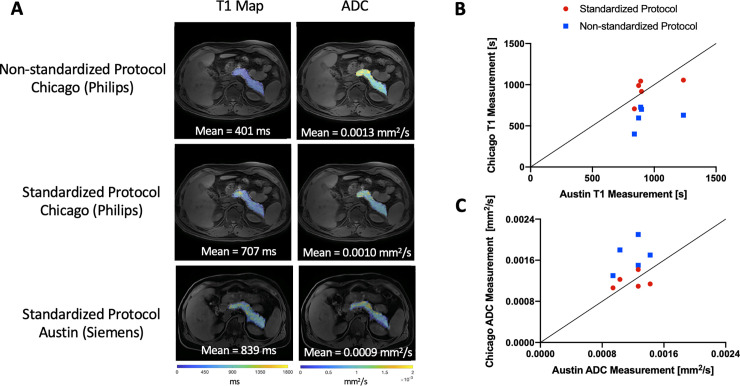
Magnetic resonance imaging (MRI) has detected changes in pancreas volume and other characteristics in type 1 and type 2 diabetes. However, differences in MRI technology and approaches across locations currently limit the incorporation of pancreas imaging into multisite trials. The purpose of this study was to develop a standardized MRI protocol for pancreas imaging and to define the reproducibility of these measurements. Calibrated phantoms with known MRI properties were imaged at five sites with differing MRI hardware and software to develop a harmonized MRI imaging protocol. Subsequently, five healthy volunteers underwent MRI at four sites using the harmonized protocol to assess pancreas size, shape, apparent diffusion coefficient (ADC), longitudinal relaxation time (T1), magnetization transfer ratio (MTR), and pancreas and hepatic fat fraction. Following harmonization, pancreas size, surface area to volume ratio, diffusion, and longitudinal relaxation time were reproducible, with coefficients of variation less than 10%. In contrast, non-standardized image processing led to greater variation in MRI measurements. By using a standardized MRI image acquisition and processing protocol, quantitative MRI of the pancreas performed at multiple locations can be incorporated into clinical trials comparing pancreas imaging measures and metabolic state in individuals with type 1 or type 2 diabetes.


Conflict of interest statement

The authors have declared that no competing interests exist.

Figures

Fig 1
Fig 1. Schematic of MRI data acquisition.
A) Example MRI of synthetic phantoms with calibrated properties that were shipped to five different sites for imaging. The phantom (upper left) consisted of three components. The leftmost bottle contained phantoms with canola oil, bovine serum albumin, and gadolinium-doped gelatin to validate fat fraction, MTR, and T1 measurements, respectively. Example fat fraction, MTR, and T1 maps are shown on the bottom row. The middle bottle contained a 3D printed pancreas created from an MRI of a normal volunteer pancreas and subsequently embedded in agar for imaging (middle row). The rightmost bottle contained deionized water chilled to 0°C to validate diffusion-weighted MRI measurements. B) Five healthy volunteers traveled to four sites in the US (Austin, Chicago, Denver, and Nashville) for an MRI of the pancreas using the harmonized acquisition protocol. C) MAP-T1D study logo.
Fig 2
Fig 2. Flow chart of MRI data acquisition and processing.
Fig 3
Fig 3. Quantitative MRI measures for 5 individuals scanned on four different MRI centers.
Values for each MRI measurement of the pancreas are displayed for: A) pancreas volume index (PVI), B) surface area to volume ratio, C) longitudinal relaxation time (T1), D) apparent diffusion coefficient (ADC), E) pancreatic fat fraction, and F) hepatic fat fraction. Note that fat fraction was not measured in Denver due to a lack of the requisite software. For the graphs of PVI, surface area to volume ratio, and ADC, the distribution of values calculated in healthy volunteers at a single site study (updated from a previously published study [5]) is indicated by dot plot in panels A, B, D.
Fig 4
Fig 4. Representative difference in quantitative MRI measurements induced by use of different image processing between sites.
A) Representative maps of T1 relaxation time (left column) and ADC (right column) displayed in pseudo color over a T1-weighted image. The top row displays images acquired in Chicago and processed using a non-standardized image processing protocol, demonstrating differences in T1 and ADC values from the standardized protocol (middle row). Images acquired and processed using the standardized MAP-T1D protocol in Chicago on a Philips MRI scanner (middle row) and Austin on a Siemens MRI scanner (bottom row) display concordance for T1 and ADC. All sets of parametric maps are scaled identically for visualization. B) Mean pancreatic T1 values are more reproducible between two sites (Chicago and Austin) using the standardized image analysis protocol (red circles), than when using non-standardized image processing (blue squares). The line of identity indicates perfect agreement. C) Mean pancreatic ADC values are more reproducible between two sites (Chicago and Austin) when using the standardized image analysis protocol (red circles), than when using non-standardized image processing (blue squares).

References

    1. Tirkes T. Chronic Pancreatitis: What the Clinician Wants to Know from MR Imaging. Magn Reson Imaging Clin N Am. 2018;26(3):451–61. doi: 10.1016/j.mric.2018.03.012 - DOI - PMC - PubMed
    1. Amano Y, Oishi T, Takahashi M, Kumazaki T. Nonenhanced magnetic resonance imaging of mild acute pancreatitis. Abdom Imaging. 2001;26(1):59–63. doi: 10.1007/s002610000104 - DOI - PubMed
    1. Kuhn JP, Berthold F, Mayerle J, Volzke H, Reeder SB, Rathmann W, et al.. Pancreatic Steatosis Demonstrated at MR Imaging in the General Population: Clinical Relevance. Radiology. 2015;276(1):129–36. doi: 10.1148/radiol.15140446 - DOI - PMC - PubMed
    1. Raman SP, Horton KM, Fishman EK. Multimodality imaging of pancreatic cancer-computed tomography, magnetic resonance imaging, and positron emission tomography. Cancer J. 2012;18(6):511–22. doi: 10.1097/PPO.0b013e318274a461 - DOI - PubMed
    1. Virostko J, Williams J, Hilmes M, Bowman C, Wright JJ, Du L, et al.. Pancreas Volume Declines During the First Year After Diagnosis of Type 1 Diabetes and Exhibits Altered Diffusion at Disease Onset. Diabetes care. 2019;42(2):248–57. doi: 10.2337/dc18-1507 - DOI - PMC - PubMed

Publication types