. 2021 Nov 18;49(20):e115.
doi: 10.1093/nar/gkab713.

TERA-Seq: true end-to-end sequencing of native RNA molecules for transcriptome characterization

Affiliations

TERA-Seq: true end-to-end sequencing of native RNA molecules for transcriptome characterization

Fadia Ibrahim et al. Nucleic Acids Res. .

Abstract

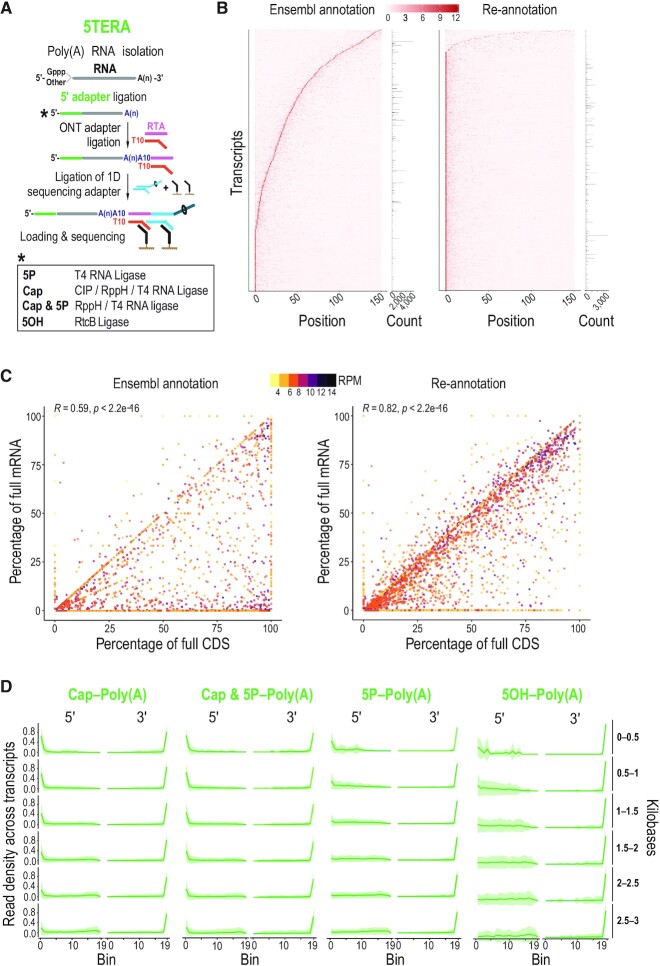
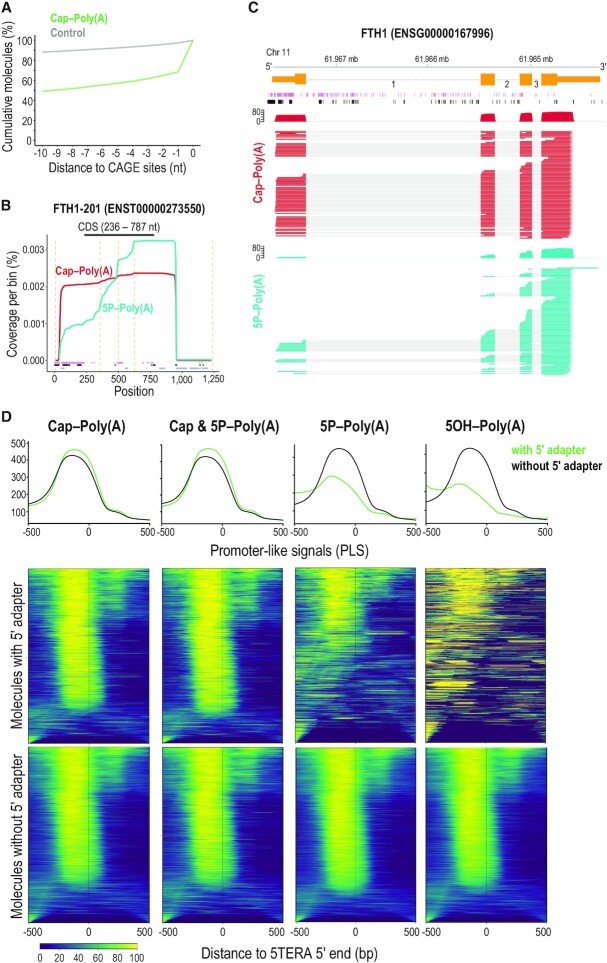
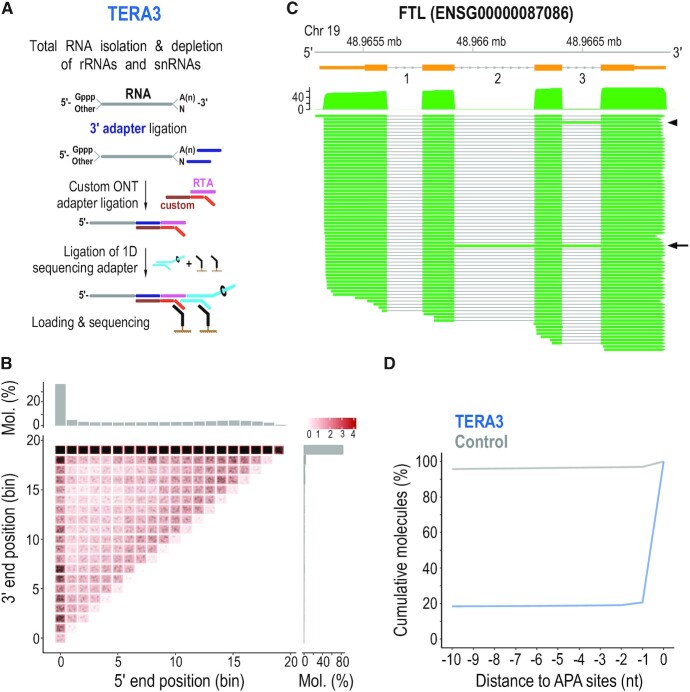
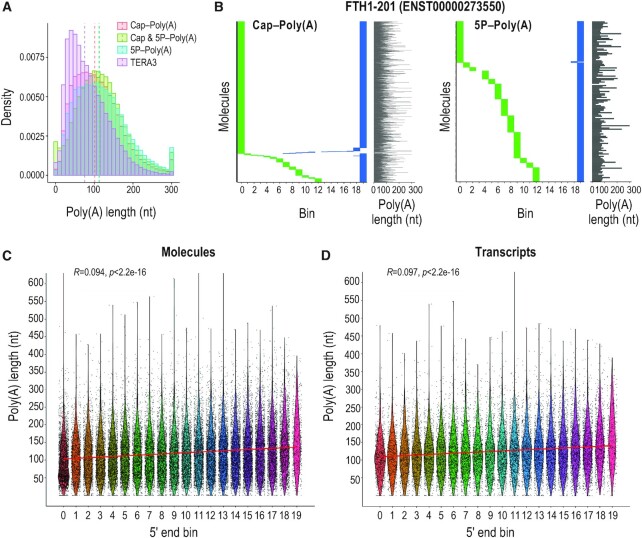
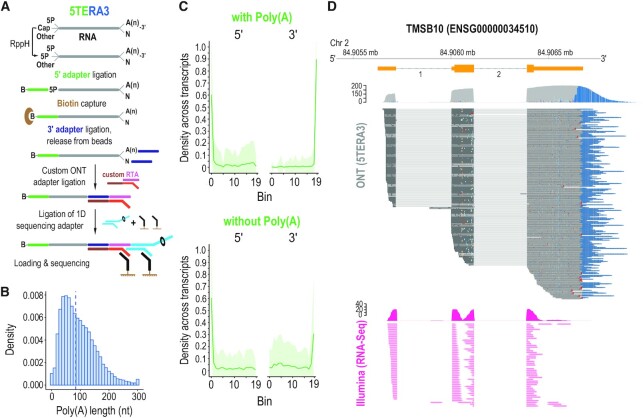
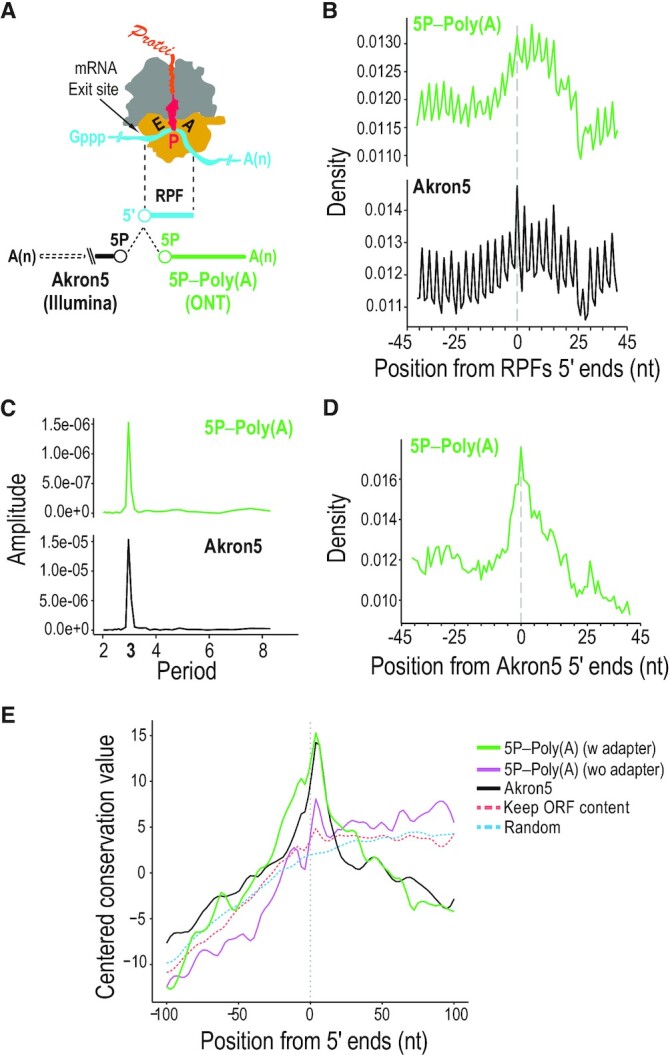
Direct sequencing of single, native RNA molecules through nanopores has a strong potential to transform research in all aspects of RNA biology and clinical diagnostics. The existing platform from Oxford Nanopore Technologies is unable to sequence the very 5' ends of RNAs and is limited to polyadenylated molecules. Here, we develop True End-to-end RNA Sequencing (TERA-Seq), a platform that addresses these limitations, permitting more thorough transcriptome characterization. TERA-Seq describes both poly- and non-polyadenylated RNA molecules and accurately identifies their native 5' and 3' ends by ligating uniquely designed adapters that are sequenced along with the transcript. We find that capped, full-length mRNAs in human cells show marked variation of poly(A) tail lengths at the single molecule level. We report prevalent capping downstream of canonical transcriptional start sites in otherwise fully spliced and polyadenylated molecules. We reveal RNA processing and decay at single molecule level and find that mRNAs decay cotranslationally, often from their 5' ends, while frequently retaining poly(A) tails. TERA-Seq will prove useful in many applications where true end-to-end direct sequencing of single, native RNA molecules and their isoforms is desirable.


Figures

Figure 1.
Figure 1.
True end-to-end sequencing of single native polyadenylated RNA molecules with 5′ adapter ligation (5TERA). (A) Method schematic. Enzymatic treatments to identify indicated 5′ ends by adapter ligation are shown in box. ONT, Oxford Nanopore Technologies; RTA, reverse transcriptase adapter; CIP, Calf Intestinal Phosphatase; RppH, RNA 5′ Pyrophosphohydrolase; 5P, 5′ monophosphate; 5OH, 5′ hydroxyl, Gppp, 5′ cap; A(n), poly(A) tail; T, thymidine. (B) Heatmap of read density of the 5′ ends close to the annotated transcription start site based on Ensembl annotation (left) and on re-annotated transcripts (right) from Cap-Poly(A) library. Only molecules with 5′ adapter are used for the analysis. Y-axis corresponds to individual transcripts. Positions up to 150 nucleotides from transcription start site are shown on the x-axis. Z-scores are calculated per row and scale is depicted on top. Number of reads corresponding to each transcript is shown on the right. Only top 30% most expressed transcripts are shown. (C) Correlation of the completeness of CDS and mRNA with expression levels based on Ensembl annotation (left) and on re-annotated transcripts (right) from Cap-Poly(A) library. Only molecules with 5′ adapter are used for the analysis. Each point represents an individual transcript. Color represents transcript expression level, calculated as the log2 of reads per million (RPM). Pearson's correlation (R) and associated P-value are shown on top. CDS, Coding Sequence; mRNA, messenger RNA. (D) Distribution of molecule ends per transcript length from indicated 5TERA libraries on HeLa re-annotated transcripts. Distribution of reads is calculated for individual transcripts and then averaged for visualizing (green line). Shaded area (green) represents the standard deviation. Only molecules with 5′ adapter are used for the analysis. Meta-coordinates are defined by splitting each transcript into 20 equal bins. Transcript lengths, grouped by 500 nucleotides are shown on the right.
Figure 2.
Figure 2.
Relation of 5′ ends of native RNA molecules to transcription start sites and to active promoters. (A) Distance of capped 5′ adapter-ligated ends of polyadenylated RNAs identified with 5TERA (green line), and control (grey), to CAGE sites. Control was created by generating 100 000 random positions within transcripts detected in at least one library. Only positions with a direct overlap or downstream to CAGE sites were considered. Y-axis represents the cumulative percentage of overlaps within the visualized range section. CAGE, Cap Analysis of Gene Expression. (B) Coverage of Ferritin Heavy Chain transcript 1 (FTH1-201) from indicated libraries and positions of Native Elongating Transcript–Cap Analysis of Gene Expression (NET-CAGE) signals (purple), CAGE signals (black), and Alternative Polyadenylation (APA) sites (blue). Only molecules with 5′ adapter are analyzed. Dashed orange lines indicate exon-exon boundaries. All visualized positions are binned by 5 nucleotides. CDS, Coding Sequence. (C) Visualization of coverage and alignment of sequenced molecules to FTH1 gene from FTH1-201 transcript, from indicated 5TERA libraries. Genomic coordinates, Ensembl transcript (orange) with numbered introns, NET-CAGE signals (purple), and CAGE signals (black) are shown on top. Only molecules with 5′ adapter are analyzed. Mb, megabase. (D) Summary plots and heatmaps of ENCODE-annotated, promoter-like signals (PLS) around 5′ ends of mRNAs identified by 5TERA. The summary profile plot (top panel) indicates enrichment around the 5′ ends (position 0) for reads with adapter (green) and without adapter (black). Heatmaps show distribution of PLS for each 5′ end separately. Each line in the heatmap represents a single 5′ end/read. Reads with adapter (middle panels) and reads without adapter (bottom panels) are visualized separately. Scale is shown at the bottom; low signal, dark blue; strong signal, yellow). All 5′ ends were collapsed prior to analysis. 500 base pair (bp) region upstream and downstream from 5TERA 5′ ends is visualized.
Figure 3.
Figure 3.
Identification of native 3′ ends of single RNA molecules by direct sequencing with 3′ adapter ligation (TERA3). (A) Method schematic. rRNAs, ribosomal RNAs; snRNAs, small nuclear RNAs; Gppp, 5′ cap; A(n), poly(A) tail; custom RTA, reverse transcriptase adapter with custom bottom sequence. (B) Heatmap of molecule ends from a TERA3 library on transcript meta-coordinates. Each dot (black) corresponds to a single molecule and its meta-coordinates are defined according to the 5′ and 3′ end position along 20 bins on the corresponding transcript. The shade of a square represents the total sum (log10(count)) of ends mapped to the indicated meta-coordinate. The scale is shown on the top right. The total distribution for each meta-coordinate is summarized independently (5′, top; 3′, right). Mol., molecules. (C) Visualization of coverage and alignment of sequenced molecules to Ferritin Light Chain gene from FTL-201 (ENST00000331825) transcript. Genomic coordinates and gene model (orange) with numbered introns are shown on top. Arrowhead and arrow show molecules with retained intron 3, and introns 2 and 3, respectively. Only molecules with 3′ adapter are visualized. Mb, megabase. (D) Distance of 3′ ends of RNAs identified by TERA3 (representative library, blue line), and control (grey), to APA sites. Control was created by generating 100 000 random positions within transcripts detected in at least one library. Only positions with a direct overlap or downstream to Alternative Polyadenylation (APA) sites were considered. Y-axis represents the cumulative percentage of overlaps within the visualized range section. nt, nucleotides.
Figure 4.
Figure 4.
Poly(A) tail characterization with TERA-Seq and its relation to 5′ end decay. (A) Histogram of poly(A) tail lengths from indicated 5TERA libraries and a representative TERA3 library; dashed lines, median values of adapter-ligated molecules. Lengths are binned by 10 nucleotides. Tails longer than 300 nucleotides are merged to the 300 nt bin. (B) Distribution of 5′ (green) and 3′ (blue) ends of Ferritin Heavy Chain 1 transcript (FTH1-201) RNA molecules from indicated 5TERA libraries. Meta-coordinates are defined by splitting each transcript into 20 equal bins. Each horizontal line represents single RNA molecule aligned to FTH1-201. Poly(A) tail length of each molecule (grey line) is shown on the right. Tails longer than 300 nucleotides (nt) are capped to 300 nt. (CD) Relation between 5′ end meta-coordinates and poly(A) tail length of all molecules (C) and transcripts (D) from 5P-Poly(A) library. Meta-coordinates are defined by splitting each transcript into 20 equal bins. Each point represents a single RNA molecule (C) or transcript (D). Only molecules with 5′ adapter are visualized. Kendall's Tau correlation value, associated p-value, and linear regression (red) are also shown. Poly(A) tail length was capped at 600 nucleotides (nt).
Figure 5.
Figure 5.
True, end-to-end sequencing of single, native RNA processing and decay intermediates with concurrent 5′ and 3′ adapter ligation (5TERA3). (A) Method schematic. 5P, 5′ monophosphate; A(n), poly(A) tail; B, biotin. Ligated molecules are enriched on streptavidin beads. (B) Histogram of poly(A) tail lengths; dashed line, median value of adapter-ligated molecules from 5TERA3. Lengths are binned by 10 nucleotides (nt). Tails longer than 300 nucleotides are merged to the 300 nt bin. (C) Average read density distribution of molecule ends across re-annotated HeLa transcripts in 5TERA3. Meta-coordinates are defined by splitting each transcript into 20 equal bins. Only top 30% expressed transcripts are shown. Shaded area (green) represents the standard deviation. (D) Visualization of coverage and alignment of sequenced molecules to Thymosin Beta 10 gene from TMSB10-201 (ENST00000233143) transcript with 5TERA3 (top; dark grey); poly(A) tails shown in blue. Non-polyadenylated molecules are shown with red arrowheads. Illumina (short-read; data obtained from (41,42)) coverage and read alignment (fuchsia) are shown on bottom. Genomic coordinates and Ensemble exons (orange) with numbered introns are shown on top. Mb, megabase.
Figure 6.
Figure 6.
Cotranslational mRNA decay identified with TERA-Seq. (A) Schematic of elongating ribosome with ribosome-protected fragment (RPF) and relative position analyses of 5′ ends from TERA-Seq (5P–Poly(A); ONT) and Akron-Seq (Akron5; Illumina) to the 5′ ends of RPFs. E, tRNA-exit site; P, peptidyl-tRNA site; A, aminoacyl-tRNA-binding site; yellow, 40S subunit with mRNA channel; grey, 60S subunit with polypeptide channel; red, peptidyl-tRNA attached to nascent protein; Gppp, 5′ cap; A(n), poly(A) tail; 5P, 5′ monophosphate. (B) Density plots of 5′ ends distances from indicated libraries relative to RPF 5′ ends (centered at position 0) in coding regions. RPF, ribosome-protected fragment. nt, nucleotide. (C) Discrete Fourier transformation of read density around RPFs for indicated libraries. (D) Density plot of 5′ ends distances from TERA-Seq (5P–Poly(A)) relative to Akron-Seq (Akron5). (E) Evolutionary conservation for 100 vertebrates (PhastCons) upstream and downstream of 5′ ends of mRNAs identified from the 5P-Poly(A) TERA-Seq library; adapted (green) and non-adapted (purple) reads and reads from Akron5 Illumina library (black) are shown. A random control maintaining the nucleotide and open reading frame (ORF) context of 5P-Poly(A) 5′ ends (dashed orange) and a completely random control (dashed blue) are shown.

References

    1. Krebs J.E., Goldstein E.S., Kilpatrick S.T.. Lewin's Genes. 2018; 12th edn.Jones & Bartlett Learning.
    1. Schoenberg D.R., Maquat L.E.. Regulation of cytoplasmic mRNA decay. Nat. Rev. Genet. 2012; 13:246–259. - PMC - PubMed
    1. Isken O., Maquat L.E.. Quality control of eukaryotic mRNA: safeguarding cells from abnormal mRNA function. Genes Dev. 2007; 21:1833–1856. - PubMed
    1. Shoemaker C.J., Green R.. Translation drives mRNA quality control. Nat. Struct. Mol. Biol. 2012; 19:594–601. - PMC - PubMed
    1. Inada T. Quality controls induced by aberrant translation. Nucleic. Acids. Res. 2020; 48:1084–1096. - PMC - PubMed

Publication types