. 2021 Aug 25;288(1957):20211195.
doi: 10.1098/rspb.2021.1195. Epub 2021 Aug 25.

Disease-driven mass mortality event leads to widespread extirpation and variable recovery potential of a marine predator across the eastern Pacific

Affiliations

Disease-driven mass mortality event leads to widespread extirpation and variable recovery potential of a marine predator across the eastern Pacific

S L Hamilton et al. Proc Biol Sci. .

Abstract

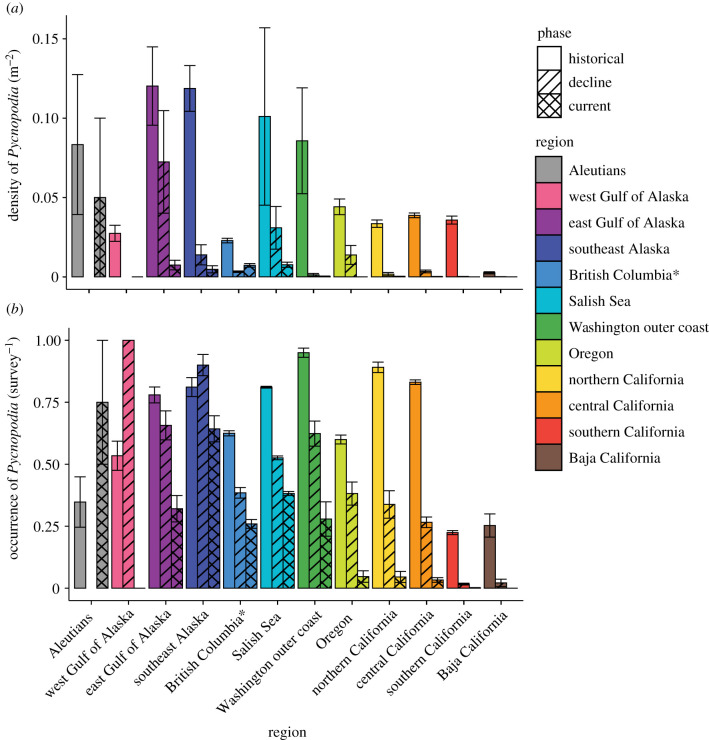
The prevalence of disease-driven mass mortality events is increasing, but our understanding of spatial variation in their magnitude, timing and triggers are often poorly resolved. Here, we use a novel range-wide dataset comprised 48 810 surveys to quantify how sea star wasting disease affected Pycnopodia helianthoides, the sunflower sea star, across its range from Baja California, Mexico to the Aleutian Islands, USA. We found that the outbreak occurred more rapidly, killed a greater percentage of the population and left fewer survivors in the southern half of the species's range. Pycnopodia now appears to be functionally extinct (greater than 99.2% declines) from Baja California, Mexico to Cape Flattery, Washington, USA and exhibited severe declines (greater than 87.8%) from the Salish Sea to the Gulf of Alaska. The importance of temperature in predicting Pycnopodia distribution rose more than fourfold after the outbreak, suggesting latitudinal variation in outbreak severity may stem from an interaction between disease severity and warmer waters. We found no evidence of population recovery in the years since the outbreak. Natural recovery in the southern half of the range is unlikely over the short term. Thus, assisted recovery will probably be required to restore the functional role of this predator on ecologically relevant time scales.

Keywords: Pycnopodia helianthoides; echinoderm; mass mortality event; sea star wasting disease; species distribution models; temperature.


Figures

Figure 1.
Figure 1.
(a) Timeline of epidemic phases between January 2012 and December 2019 by region. Pre-epidemic phase (yellow) includes dates before the ‘date SSWD first observed’, when the first recorded symptomatic sea star was reported in each region (unknown in western Alaska). The emerging epidemic phase (orange) spans from the ‘date SSWD first observed’ to the ‘outbreak date’ when 10% of the sites within a region had reported SSWD observations. Epidemic phase (violet) spans the ‘outbreak date’ to the ‘crash date’ (defined above) and indicates how quickly the disease caused population declines. The post-epidemic phase (purple) includes dates after the crash date, though SSWD may still be present and driving further declines in the future. Caret: some dates inferred based on the dates in neighbouring regions. Asterisk: British Columbia and Washington outer coast exclude the Salish Sea. (b) Logistic model predictions for the occurrence of Pycnopodia helianthoides over the course of the epidemic by region. These models were used to estimate the ‘crash date’ (filled circles) of the populations in each region, defined as a 75% decline in occurrence from January 2012 to December 2019. (Online version in colour.)
Figure 2.
Figure 2.
Mean (±s.e.) Pycnopodia helianthoides (a) density (m2) and (b) occurrence in shallow depths (less than 25 m) among the 12 regions and population decline phases (historical, decline and current, see electronic supplementary material, table S2) over the SSWD outbreak. Asterisk: Washington outer coast and British Columbia exclude the Salish Sea. (Online version in colour.)
Figure 3.
Figure 3.
Density (m2) of Pycnopodia helianthoides in shallow water (less than 25 m) from (a) historical (1976 to the outbreak date of SSWS) and (b) current (2017–2020) surveys. Grey cells represent areas where no surveys were conducted during the relevant timeframe, but were conducted within the dataset timeframe. MaxEnt species distribution model logistic predictions for Pycnopodia helianthoides (c) immediately pre-SSWD outbreak (2009–2012) and (d) currently (2017–2020). (Online version in colour.)
Figure 4.
Figure 4.
(a) Permutation importance of variables in MaxEnt model predictions of Pycnopodia helianthoides occurrence pre-outbreak (2009–2012) and current (2017–2020). (b) MaxEnt logistic output response curves showing the probability of Pycnopodia occurrence across the represented range of each variable pre-outbreak (2009–2012) and currently (2017–2020). (Online version in colour.)
Figure 5.
Figure 5.
The frequency with which Pycnopodia helianthoides remnant populations were observed from 2017 to 2020 in each region. Surveys were aggregated into 16 km2 grid cells and grid cells were only included if they contained shallow (less than 25 m) surveys from at least three different years from 2017 to 2020. n = the number of grid cells that fit this criterion (n = 0 for Aleutians and west GOA; not shown). Each grid cell was classified by the per cent of total surveys that observed Pycnopodia: absent = 0%, rare = less than 25%, common = less than 90% and very common ≥90%. Asterisk: British Columbia and Washington outer coast exclude the Salish Sea. (Online version in colour.)

References

    1. Fey SB, Siepielski AM, Nusslé S, Cervantes-Yoshida K, Hwan JL, Huber ER, Fey MJ, Catenazzi A, Carlson SM. et al.2015Recent shifts in the occurrence, cause, and magnitude of animal mass mortality events. Proc. Natl Acad. Sci. USA 112, 1083-1088. (10.1073/pnas.1414894112) - DOI - PMC - PubMed
    1. Tracy AM, Pielmeier ML, Yoshioka RM, Heron SF, Harvell CD. 2019Increases and decreases in marine disease reports in an era of global change. Proc. R. Soc. B 286, 20191718. (10.1098/rspb.2019.1718) - DOI - PMC - PubMed
    1. Feehan CJ, Scheibling RE. 2014Effects of sea urchin disease on coastal marine ecosystems. Mar. Biol. 161, 1467-1485. (10.1007/s00227-014-2452-4) - DOI
    1. Stokstad E. 2014Death of the stars. Science 344, 464-467. (10.1126/science.344.6183.464) - DOI - PubMed
    1. Lester SE, Tobin ED, Behrens MD. 2007Disease dynamics and the potential role of thermal stress in the sea urchin, Strongylocentrotus purpuratus. Can. J. Fish. Aquat. Sci. 64, 314-323. (10.1139/f07-010) - DOI

Publication types

LinkOut - more resources