Comparative Study
. 2021 Aug 24;16(1):58.
doi: 10.1186/s13024-021-00481-0.

Sex dependent glial-specific changes in the chromatin accessibility landscape in late-onset Alzheimer's disease brains

Affiliations
Comparative Study

Sex dependent glial-specific changes in the chromatin accessibility landscape in late-onset Alzheimer's disease brains

Julio Barrera et al. Mol Neurodegener. .

Abstract

Background: In the post-GWAS era, there is an unmet need to decode the underpinning genetic etiologies of late-onset Alzheimer's disease (LOAD) and translate the associations to causation.

Methods: We conducted ATAC-seq profiling using NeuN sorted-nuclei from 40 frozen brain tissues to determine LOAD-specific changes in chromatin accessibility landscape in a cell-type specific manner.

Results: We identified 211 LOAD-specific differential chromatin accessibility sites in neuronal-nuclei, four of which overlapped with LOAD-GWAS regions (±100 kb of SNP). While the non-neuronal nuclei did not show LOAD-specific differences, stratification by sex identified 842 LOAD-specific chromatin accessibility sites in females. Seven of these sex-dependent sites in the non-neuronal samples overlapped LOAD-GWAS regions including APOE. LOAD loci were functionally validated using single-nuclei RNA-seq datasets.

Conclusions: Using brain sorted-nuclei enabled the identification of sex-dependent cell type-specific LOAD alterations in chromatin structure. These findings enhance the interpretation of LOAD-GWAS discoveries, provide potential pathomechanisms, and suggest novel LOAD-loci.

Keywords: ATAC-seq; Chromatin accessibility; Gene dysregulation; Late-onset Alzheimer’s disease; Nuclei sorting; snRNA-seq.


Conflict of interest statement

The authors declare no competing interests.

Figures
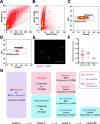
Fig. 1
Fig. 1
Isolation of nuclei from frozen brain samples and analysis of ATAC-seq data. Human postmortem frontal cortex was dissociated, nuclei were isolated and stained with the nuclear stain DAPI and a monoclonal NeuN antibody conjugated to PE. a Nuclei were first sorted based on their forward and side scatter from all possible events (R1 gate). b Single nuclei were further sorted based on their size from the doublets or larger clumps of nuclei (R2 gate). c DAPI positive single cells were gated as either NeuN-PE positive (neurons, R3 gate) or NeuN-PE negative (glia, R4 gate). d Post-sort data showing the purity of the separation between neuronal and non-neuronal nuclei. e Fluorescence image showing unsorted nuclei stained for NeuN (red) and DAPI (blue). The scale bar represents 100um. f Proportion of neuronal nuclei from each sample. Error bars show standard error of the mean. g Overview schematic of Levels 1, 2, 3, and 3b of differential analysis. Level 1 compares neuronal vs. non-neuronal for 21 normal and 19 LOAD samples. Level 2 compares normal vs. LOAD for each neuronal and non-neuronal subpopulation. Level 3 compares LOAD samples separated by female and male. Level 3b is the same comparison done after adding 9 female non-neuronal samples (3 normal and 6 LOAD)
Fig. 2
Fig. 2
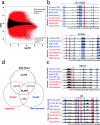
Level 1 comparison of ATAC-seq data from neuronal vs non-neuronal nuclei. a MA plot showing differential ATAC-seq sites between neuronal (blue) vs. non-neuronal regions (red). Red dots represent ATAC-seq peaks that are significantly different between groups (FDR q < 0.05). b ATAC-seq data around non-neuronal-specific genes SLC25A18 (upper panel) and ACSBG1 (lower panel). Boxes highlight peaks that are more accessible in neuronal (red) or non-neuronal (blue) nuclei. c ATAC-seq data around neuron-specific genes MEF2C (upper panel) and SLA (lower panel). All regions indicate hg19 coordinates. d Venn diagram of ATAC-seq peaks detected in whole tissue, sorted neuron and sorted non-neuron nuclei from 6 donor-matching samples
Fig. 3
Fig. 3
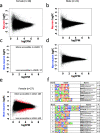
Level 2 comparison of ATAC-seq data between LOAD cases and controls. MA plots of differential chromatin sites for a neuronal and b non-neuronal nuclei. Red dots represent differential ATAC-seq sites with FDR q < 0.05. c Motifs that are enriched in neuronal ATAC-seq sites that are less accessible in LOAD samples. Size of red dots were increased for visibility
Fig. 4
Fig. 4
Level 3 comparison of ATAC-seq data between LOAD cases and controls separated by sex. MA plot of differential sites for a female neuron (n = 18; FDR q < 0.05), b male neuron (n = 22; FDR q < 0.05), c female non-neuron (n = 18, FDR q < 0.05), d male non-neuron (n = 22; FDR q < 0.05), and e female non-neuron with additional samples (n = 27; FDR q < 0.05). f Motifs enriched for 203 sites that are more accessible in female non-neuronal LOAD and for 639 sites that are less accessible in female non-neuronal LOAD (FDR q < 0.05). Size of red dots were increased for visibility
Fig. 5
Fig. 5
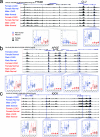
Differential LOAD specific ATAC-seq peaks around LOAD-GWAS regions. Screenshots of ATAC-seq data around a PTK2B, CLU, b APOE, and c IQCK loci. Box plots show ATAC-seq read counts for individual ATAC-seq peaks (blue frames highlight significant differential peaks for cases vs. controls, gray frames show control peaks that are not differential between cases and controls). Box plots are color coded for non-neuronal (blue) neuronal (red), female (no fill), and male (gray fill). All tracks show hg19 coordinates and all y-axes on tracks range from 0 to 250. For box plots, the line within each box represents the median, and the top and bottom borders of the box represent the 25th and 75th percentiles, respectively. The top and bottom whiskers of the box plots represent the 75th percentile plus 1.5 times the interquartile range and the 25th percentile minus 1.5 times the interquartile range, respectively

References

    1. Lambert J-C, Ibrahim-Verbaas CA, Harold D, Naj AC, Sims R, Bellenguez C, et al. Meta-analysis of 74,046 individuals identifies 11 new susceptibility loci for Alzheimer's disease. Nat Genet. 2013;45(12):1452–1458. doi: 10.1038/ng.2802. - DOI - PMC - PubMed
    1. Naj AC, Jun G, Beecham GW, Wang LS, Vardarajan BN, Buros J, et al. Common variants at MS4A4/MS4A6E, CD2AP, CD33 and EPHA1 are associated with late-onset Alzheimer's disease. Nat Genet. 2011;43(5):436–441. doi: 10.1038/ng.801. - DOI - PMC - PubMed
    1. Harold D, Abraham R, Hollingworth P, Sims R, Gerrish A, Hamshere ML, Pahwa JS, Moskvina V, Dowzell K, Williams A, Jones N, Thomas C, Stretton A, Morgan AR, Lovestone S, Powell J, Proitsi P, Lupton MK, Brayne C, Rubinsztein DC, Gill M, Lawlor B, Lynch A, Morgan K, Brown KS, Passmore PA, Craig D, McGuinness B, Todd S, Holmes C, Mann D, Smith AD, Love S, Kehoe PG, Hardy J, Mead S, Fox N, Rossor M, Collinge J, Maier W, Jessen F, Schürmann B, Heun R, van den Bussche H, Heuser I, Kornhuber J, Wiltfang J, Dichgans M, Frölich L, Hampel H, Hüll M, Rujescu D, Goate AM, Kauwe JSK, Cruchaga C, Nowotny P, Morris JC, Mayo K, Sleegers K, Bettens K, Engelborghs S, de Deyn PP, van Broeckhoven C, Livingston G, Bass NJ, Gurling H, McQuillin A, Gwilliam R, Deloukas P, al-Chalabi A, Shaw CE, Tsolaki M, Singleton AB, Guerreiro R, Mühleisen TW, Nöthen MM, Moebus S, Jöckel KH, Klopp N, Wichmann HE, Carrasquillo MM, Pankratz VS, Younkin SG, Holmans PA, O'Donovan M, Owen MJ, Williams J. Genome-wide association study identifies variants at CLU and PICALM associated with Alzheimer's disease. Nat Genet. 2009;41(10):1088–1093. doi: 10.1038/ng.440. - DOI - PMC - PubMed
    1. Hollingworth P, Harold D, Sims R, Gerrish A, Lambert JC, Carrasquillo MM, et al. Common variants at ABCA7, MS4A6A/MS4A4E, EPHA1, CD33 and CD2AP are associated with Alzheimer's disease. Nat Genet. 2011;43(5):429–435. doi: 10.1038/ng.803. - DOI - PMC - PubMed
    1. Jansen I, Savage J, Watanabe K, Bryois J, Williams D, Steinberg S, et al. Genetic meta-analysis identifies 9 novel loci and functional pathways for Alzheimers disease risk. bioRxiv. 2018:258533. 10.1101/258533.

Publication types

MeSH terms