. 2022 Jan;12(1):220-235.
doi: 10.1158/2159-8290.CD-21-0560. Epub 2021 Aug 24.

Systematic Profiling of DNMT3A Variants Reveals Protein Instability Mediated by the DCAF8 E3 Ubiquitin Ligase Adaptor

Affiliations

Systematic Profiling of DNMT3A Variants Reveals Protein Instability Mediated by the DCAF8 E3 Ubiquitin Ligase Adaptor

Yung-Hsin Huang et al. Cancer Discov. 2022 Jan.

Abstract

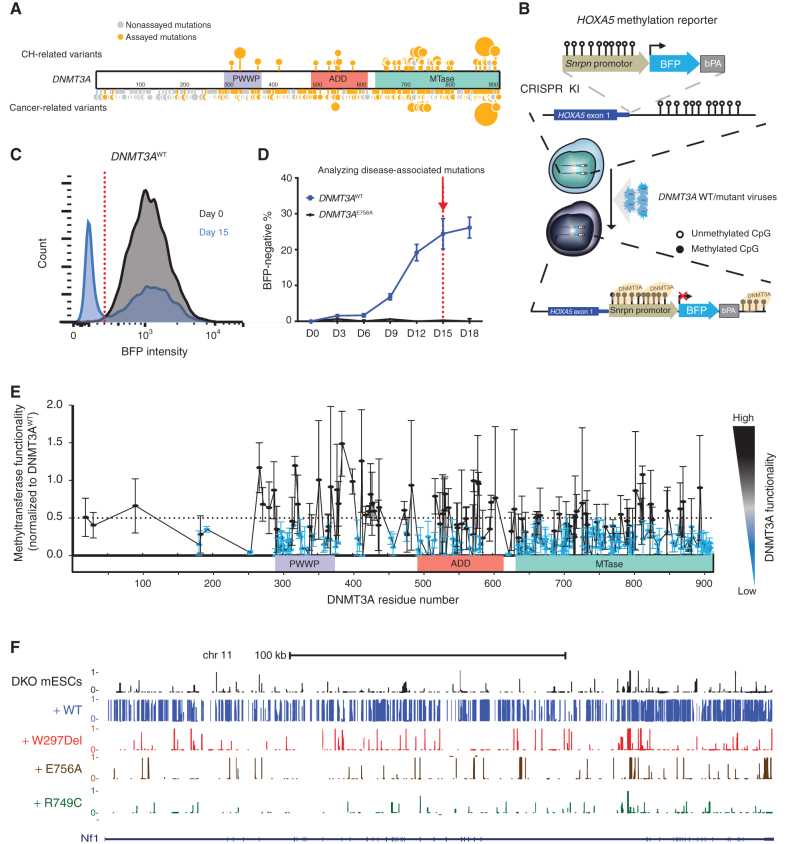
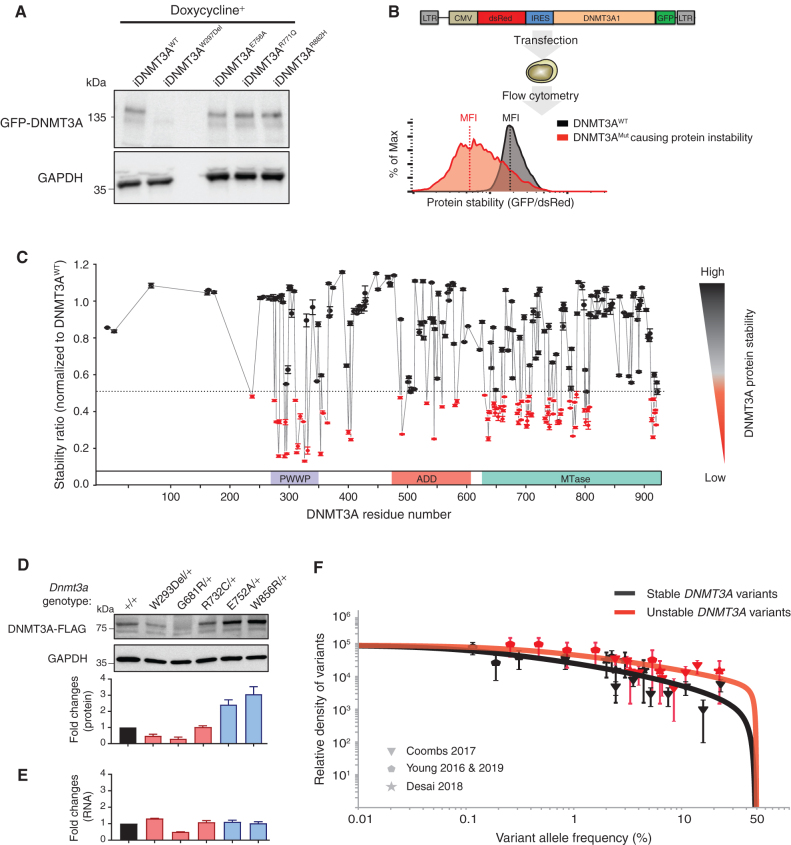
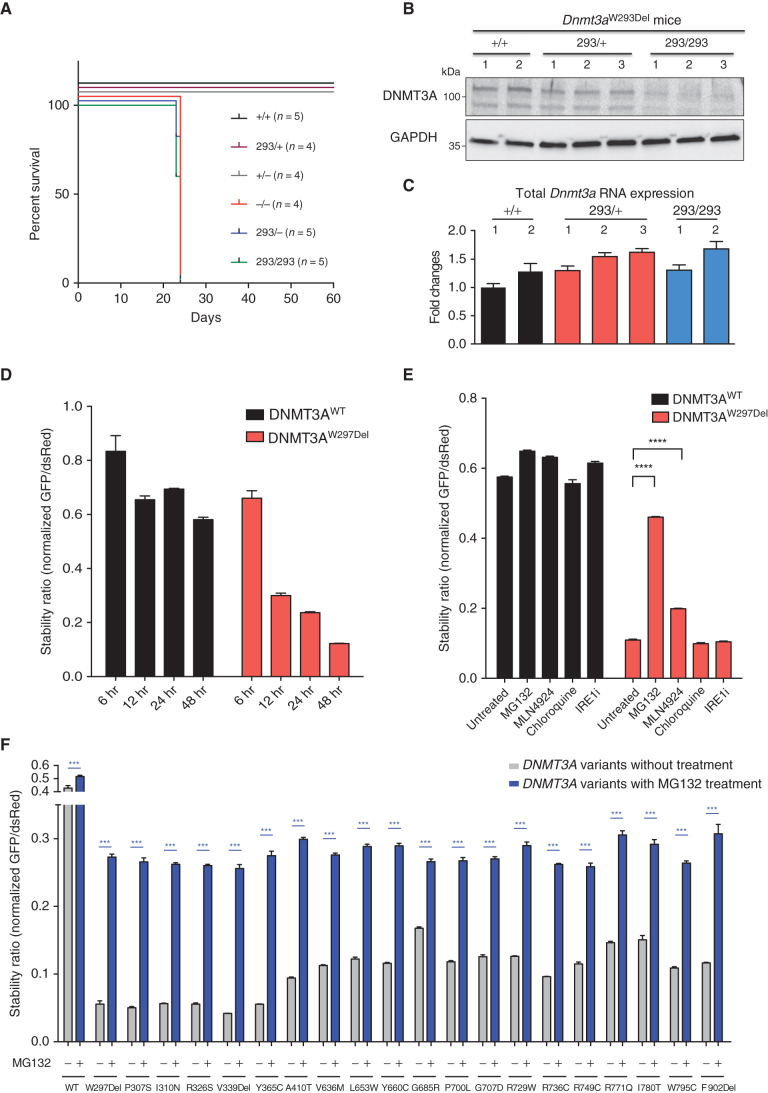
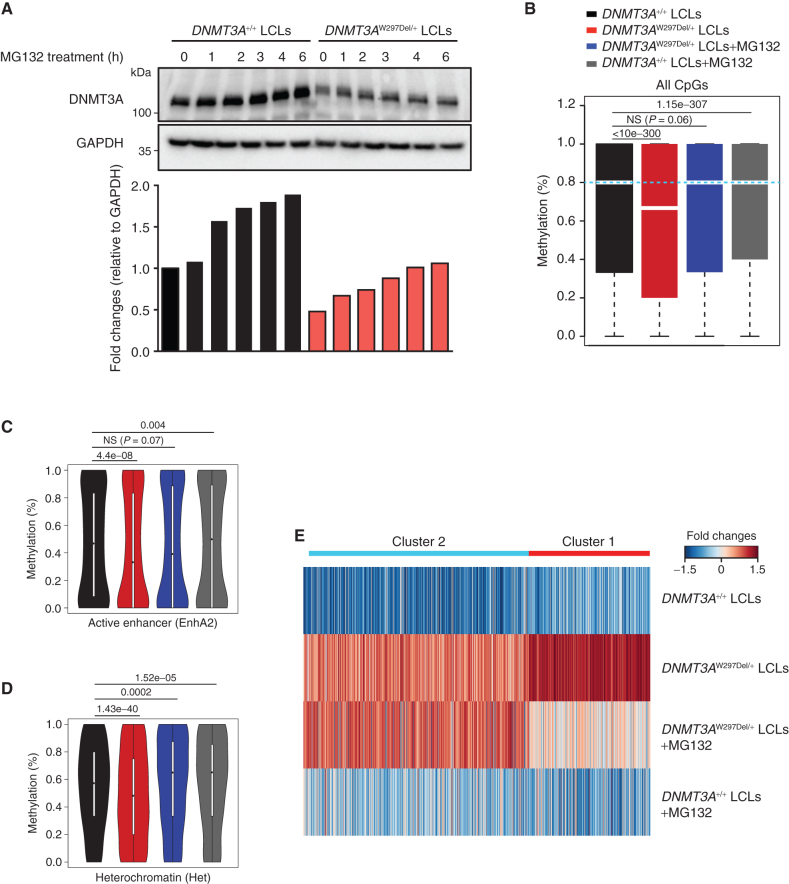
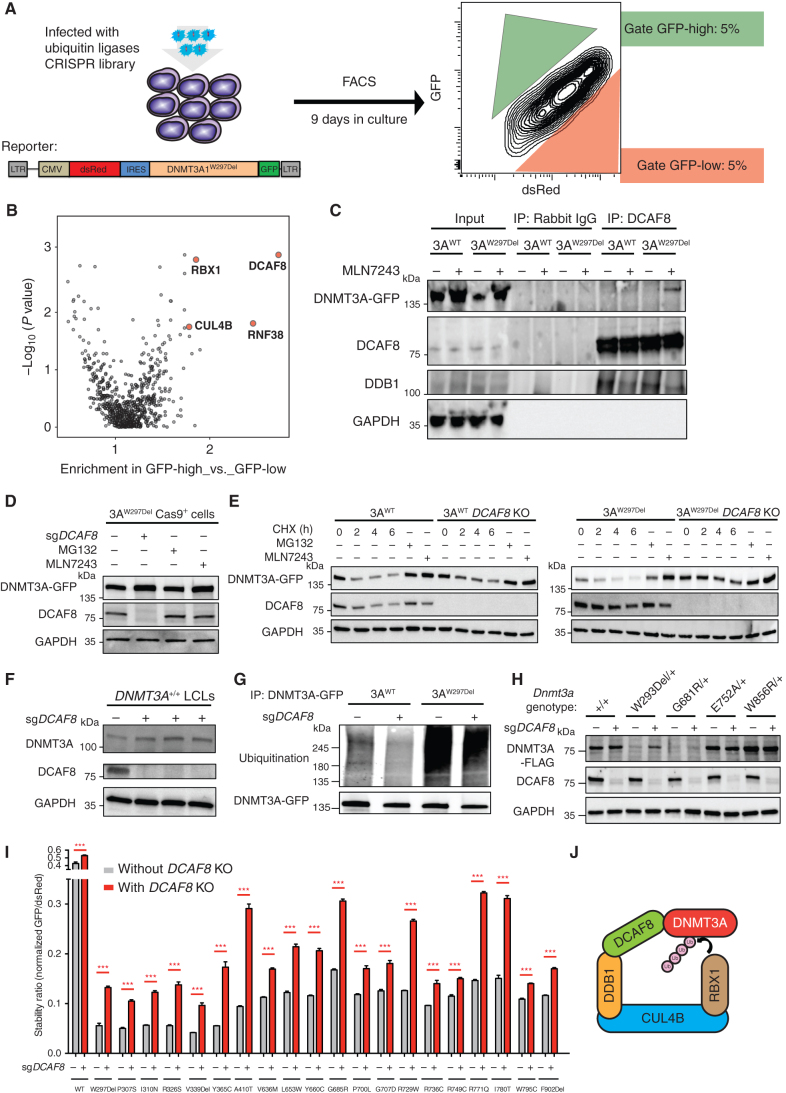
Clonal hematopoiesis is a prevalent age-related condition associated with a greatly increased risk of hematologic disease; mutations in DNA methyltransferase 3A (DNMT3A) are the most common driver of this state. DNMT3A variants occur across the gene with some particularly associated with malignancy, but the functional relevance and mechanisms of pathogenesis of the majority of mutations are unknown. Here, we systematically investigated the methyltransferase activity and protein stability of 253 disease-associated DNMT3A mutations, and found that 74% were loss-of-function mutations. Half of these variants exhibited reduced protein stability and, as a class, correlated with greater clonal expansion and acute myeloid leukemia development. We investigated the mechanisms underlying the instability using a CRISPR screen and uncovered regulated destruction of DNMT3A mediated by the DCAF8 E3 ubiquitin ligase adaptor. We establish a new paradigm to classify novel variants that has prognostic and potential therapeutic significance for patients with hematologic disease. SIGNIFICANCE: DNMT3A has emerged as the most important epigenetic regulator and tumor suppressor in the hematopoietic system. Our study represents a systematic and high-throughput method to characterize the molecular impact of DNMT3A missense mutations and the discovery of a regulated destruction mechanism of DNMT3A offering new prognostic and future therapeutic avenues.See related commentary by Ma and Will, p. 23.This article is highlighted in the In This Issue feature, p. 1.


Figures

Figure 1. Methyltransferase activity analysis in 253 disease-associated DNMT3A missense mutations using the HOXA5-Snrpn-BFP methylation reporter. A, Schematic of missense mutations across DNMT3A in CH and cancer. Sites marked in orange represent tested mutations (Supplementary Table S1); the larger circles indicate recurrent mutations. Sites in gray represent mutations seen in the databases but not assayed here. B, Schematic of the methyltransferase activity assay using HOXA5-Snrpn-BFP methylation reporter. The Snrpn promoter region was linked to BFP and a bovine polyA signal and knocked in (KI) to the HOXA5 locus in reverse orientation in HEK293T cells. These cells have high BFP fluorescence, as shown in C in gray. When wild-type (WT) DNMT3A is introduced using lentiviral transduction, the methylation-sensitive HOXA5 regions promote DNA methylation, which leads to suppression of BFP expression (blue plot in C). C, Methyltransferase activity assay. The graph depicts blue fluorescence intensity in the DNMT3AWT-transduced cells as measured by flow cytometry on day 0 (gray) and day 15 (blue). D, The percentage of BFP-negative cells after transduction with DNMT3AWT or DNMT3AE756A constructs measured by flow cytometry over 18 days. E, Methyltransferase activity assay of 253 disease-associated DNMT3A missense mutations measured by flow cytometry. Lentiviral particles of each DNMT3A variant were infected in three biological replicates in HOXA5-Snrpn-BFP reporter cells. Activity was normalized to the percent BFP-negative percent cells in DNMT3AWT-transduced cells 15 days later. To visualize results, we defined and colored mutations based on their levels of methyltransferase activity. Methyltransferase activity of those mutations labeled were classified as having impaired methyltransferase activity (activity <0.5), whereas those in black were considered in the range of WT DNMT3A (activity >0.5). Data are presented as mean ± SEM. F, DNA methylation profile (WGBS) of cells transduced with the indicated DNMT3A mutants displayed on the UCSC genome browser. See also Supplementary Figs. S1–S3.
Figure 1.
Methyltransferase activity analysis in 253 disease-associated DNMT3A missense mutations using the HOXA5-Snrpn-BFP methylation reporter. A, Schematic of missense mutations across DNMT3A in CH and cancer. Sites marked in orange represent tested mutations (Supplementary Table S1); the larger circles indicate recurrent mutations. Sites in gray represent mutations seen in the databases but not assayed here. B, Schematic of the methyltransferase activity assay using HOXA5-Snrpn-BFP methylation reporter. The Snrpn promoter region was linked to BFP and a bovine polyA signal and knocked in (KI) to the HOXA5 locus in reverse orientation in HEK293T cells. These cells have high BFP fluorescence, as shown in C in gray. When wild-type (WT) DNMT3A is introduced using lentiviral transduction, the methylation-sensitive HOXA5 regions promote DNA methylation, which leads to suppression of BFP expression (blue plot in C). C, Methyltransferase activity assay. The graph depicts blue fluorescence intensity in the DNMT3AWT-transduced cells as measured by flow cytometry on day 0 (gray) and day 15 (blue). D, The percentage of BFP-negative cells after transduction with DNMT3AWT or DNMT3AE756A constructs measured by flow cytometry over 18 days. E, Methyltransferase activity assay of 253 disease-associated DNMT3A missense mutations measured by flow cytometry. Lentiviral particles of each DNMT3A variant were infected in three biological replicates in HOXA5-Snrpn-BFP reporter cells. Activity was normalized to the percent BFP-negative percent cells in DNMT3AWT-transduced cells 15 days later. To visualize results, we defined and colored mutations based on their levels of methyltransferase activity. Methyltransferase activity of those mutations labeled were classified as having impaired methyltransferase activity (activity <0.5), whereas those in black were considered in the range of WT DNMT3A (activity >0.5). Data are presented as mean ± SEM. F, DNA methylation profile (WGBS) of cells transduced with the indicated DNMT3A mutants displayed on the UCSC genome browser. See also Supplementary Figs. S1–S3.
Figure 2. More than a third of missense mutations across DNMT3A decrease protein stability. A, Western blot analysis of GFP-DNMT3A fusion protein and GAPDH control expression measured in DKO embryonic stem cell after doxycycline induction. B, Schematic of protein stability assay using the DsRed-IRES-DNMT3A-GFP bicistronic vector. The vector produces a DNMT3A-GFP fusion protein, such that the level of GFP fluorescence allows inference of the amount of DNMT3A protein present. The fusion protein transcript is downstream of DsRed, following an internal ribosome entry site (IRES) so that DsRed serves as an internal control for differences in transcription efficiencies of the constructs. The construct is transfected into the HEK293T cells, and 48 hours later, green and red fluorescence is measured by flow cytometry (right panel). The ratio of the MFI of the green and red fluorescence is used to indicate the level of GFP-tagged DNMTA protein in the cells. The fluorescence ratios in cells transfected with DNMT3A-mutant constructs are normalized to that of the DNMT3A-WT–expressing constructs. C, The graph depicts protein stability of 253 DNMT3A missense mutations measured as described in B. To visualize results, we defined and colored mutations based on their levels of severity of impaired protein stability. Mutations marked in red indicate those with severely impaired protein stability (stability ratio <0.5), whereas those in black were considered comparable to DNMT3AWT (stability ratio >0.5). The mutation labeled in red is one identified above as unstable. Data are presented as mean ± SEM. D, Western blotting analysis and quantification of heterozygous mESC unstable mutants (DNMT3AW293Del, DNMT3AG681R, DNMT3AR732C) and stable mutants (DNMT3AE752A DNMT3AW856R) normalized to GAPDH. E, Quantification of RNA expression levels in mESC mutants described in D normalized to GAPDH. F, The distribution of variant allele frequencies of stable (gray data points) and unstable (red data points) variants plotted after controlling for study size, panel size, and mutation rate compared with maximum likelihood VAF distributions (red and gray lines) that assume a parameterized form for the distribution of fitness effects (29).
Figure 2.
More than a third of missense mutations across DNMT3A decrease protein stability. A, Western blot analysis of GFP-DNMT3A fusion protein and GAPDH control expression measured in DKO embryonic stem cell after doxycycline induction. B, Schematic of protein stability assay using the DsRed-IRES-DNMT3A-GFP bicistronic vector. The vector produces a DNMT3A-GFP fusion protein, such that the level of GFP fluorescence allows inference of the amount of DNMT3A protein present. The fusion protein transcript is downstream of DsRed, following an internal ribosome entry site (IRES) so that DsRed serves as an internal control for differences in transcription efficiencies of the constructs. The construct is transfected into the HEK293T cells, and 48 hours later, green and red fluorescence is measured by flow cytometry (right panel). The ratio of the MFI of the green and red fluorescence is used to indicate the level of GFP-tagged DNMTA protein in the cells. The fluorescence ratios in cells transfected with DNMT3A-mutant constructs are normalized to that of the DNMT3A-WT–expressing constructs. C, The graph depicts protein stability of 253 DNMT3A missense mutations measured as described in B. To visualize results, we defined and colored mutations based on their levels of severity of impaired protein stability. Mutations marked in red indicate those with severely impaired protein stability (stability ratio <0.5), whereas those in black were considered comparable to DNMT3AWT (stability ratio >0.5). The mutation labeled in red is one identified above as unstable. Data are presented as mean ± SEM. D, Western blotting analysis and quantification of heterozygous mESC unstable mutants (DNMT3AW293Del, DNMT3AG681R, DNMT3AR732C) and stable mutants (DNMT3AE752A DNMT3AW856R) normalized to GAPDH. E, Quantification of RNA expression levels in mESC mutants described in D normalized to GAPDH. F, The distribution of variant allele frequencies of stable (gray data points) and unstable (red data points) variants plotted after controlling for study size, panel size, and mutation rate compared with maximum likelihood VAF distributions (red and gray lines) that assume a parameterized form for the distribution of fitness effects (29).
Figure 3. DNMT3A is degraded through the ubiquitin-proteasome system. A, Survival after the birth of mice with the indicated genotypes. No Dnmt3a−/−, Dnmt3aW293Del/−, or Dnmt3aW293Del/W293Del mice survived beyond postnatal day 24. B, Western blot of DNMT3A and GAPDH protein expression in whole bone marrow cells of mice. C, Gene expression analysis of Dnmt3a in whole bone marrow measured by quantitative PCR and normalized for Gapdh mRNA expression. D, The stability ratio of the WT and W297Del mutant over the indicated times, calculated as described in Fig. 2C. E, Alterations in DNMT3A protein stability after administration of proteasome inhibitor (MG132), a CRL inhibitor (MLN4924), an autophagy inhibitor (chloroquine), and an unfolded protein response inhibitor (IREi). F, Stability ratio of MFI of DNMT3A-GFP versus MFI of DsRed before and after treatment with the proteasome inhibitor (MG132) as measured by flow cytometry 48 hours after transfection. Data are presented as mean ± SEM. *, P < 0.05; **, P < 0.01; ***, P < 0.001 using the unpaired t test. See also Supplementary Fig. S7.
Figure 3.
DNMT3A is degraded through the ubiquitin-proteasome system. A, Survival after the birth of mice with the indicated genotypes. No Dnmt3a−/−, Dnmt3aW293Del/−, or Dnmt3aW293Del/W293Del mice survived beyond postnatal day 24. B, Western blot of DNMT3A and GAPDH protein expression in whole bone marrow cells of mice. C, Gene expression analysis of Dnmt3a in whole bone marrow measured by quantitative PCR and normalized for Gapdh mRNA expression. D, The stability ratio of the WT and W297Del mutant over the indicated times, calculated as described in Fig. 2C. E, Alterations in DNMT3A protein stability after administration of proteasome inhibitor (MG132), a CRL inhibitor (MLN4924), an autophagy inhibitor (chloroquine), and an unfolded protein response inhibitor (IREi). F, Stability ratio of MFI of DNMT3A-GFP versus MFI of DsRed before and after treatment with the proteasome inhibitor (MG132) as measured by flow cytometry 48 hours after transfection. Data are presented as mean ± SEM. *, P < 0.05; **, P < 0.01; ***, P < 0.001 using the unpaired t test. See also Supplementary Fig. S7.
Figure 4. Proteasome inhibitors partially restore the methylome and transcriptome in patient-derived cells. A, Western blotting and fold-change quantification of DNMT3A and GAPDH protein expression in LCL cells from WT or a patient with TBRS (W297del). DNMT3A was normalized to GAPDH. B, Box plots showing DNA methylation distribution analyzed by whole-genome bisulfite sequencing in the indicated LCL cells with and without proteasome inhibition through MG132 treatment. The bars represent methylation ratios between the first and third quartiles, with the median distribution, shown by a gap in the bars, of 66.7% (DNMT3AW297Del/+) and 80% (all other samples). The whiskers represent methylation in the first and fourth quartiles. The statistical values represent the Wilcox rank-sum test. C, Violin plots of DNA methylation distribution in 12,896 active enhancer regions as defined in the Roadmap Epigenomic Project. D, Violin plot of DNA methylation ratios in 10,973 heterochromatic regions as defined in the Roadmap Epigenomic Project. E, Gene expression heat map of the indicated cells and treatments. Cluster 1 genes were hypomethylated in DNMT3AW297Del/+ compared with WT LCLs and responsive to proteasome inhibitors. Cluster 2 genes were hypomethylated in DNMT3AW297Del/+ compared with WT LCLs but inert to proteasome inhibitors. See also Supplementary Fig. S8.
Figure 4.
Proteasome inhibitors partially restore the methylome and transcriptome in patient-derived cells. A, Western blotting and fold-change quantification of DNMT3A and GAPDH protein expression in LCL cells from WT or a patient with TBRS (W297del). DNMT3A was normalized to GAPDH. B, Box plots showing DNA methylation distribution analyzed by whole-genome bisulfite sequencing in the indicated LCL cells with and without proteasome inhibition through MG132 treatment. The bars represent methylation ratios between the first and third quartiles, with the median distribution, shown by a gap in the bars, of 66.7% (DNMT3AW297Del/+) and 80% (all other samples). The whiskers represent methylation in the first and fourth quartiles. The statistical values represent the Wilcox rank-sum test. C, Violin plots of DNA methylation distribution in 12,896 active enhancer regions as defined in the Roadmap Epigenomic Project. D, Violin plot of DNA methylation ratios in 10,973 heterochromatic regions as defined in the Roadmap Epigenomic Project. E, Gene expression heat map of the indicated cells and treatments. Cluster 1 genes were hypomethylated in DNMT3AW297Del/+ compared with WT LCLs and responsive to proteasome inhibitors. Cluster 2 genes were hypomethylated in DNMT3AW297Del/+ compared with WT LCLs but inert to proteasome inhibitors. See also Supplementary Fig. S8.
Figure 5. Targeted CRISPR screening identifies CUL4BDCAF8 ubiquitin ligase complexes essential for DNMT3A protein degradation. A, Schematic of targeted CRISPR screening to identify ubiquitin ligases essential for DNMT3A protein degradation. HEK293T cells were engineered to constitutively overexpress Cas9 and the indicated bicistronic DNMT3AW297Del reporter and then infected with sgRNA libraries targeting ubiquitin ligases. Nine days after infection, we sorted both the top and bottom 5% of cells for DNMT3A-GFP expression. B, The graph depicts the gene enrichment score and P value in targeted CRISPR screening for ubiquitin ligases. DCAF8, RBX1, and CUL4B genes (red) were enriched and statistically significant. C, The image depicts DCAF8 immunoprecipitation in DNMT3A-WT or W297del-expressing cells after incubation for 6 hours with an inhibitor of E1 ubiquitin-activating enzymes (MLN7243), followed by blotting using GFP, DCAF8, DDB1, and GAPDH antibodies. D, DNMT3AW297del-expressing HEK293T cells treated with sgRNA targeting DCAF8, proteasome inhibitor, and E1 ubiquitin–activating enzyme, followed by Western blot analysis for DNMT3A-GFP, DCAF8, and GAPDH. E, Cycloheximide (CHX) treatment with 0, 2, 4, and 6 hours of DNMT3AWT and DNMT3AW297Del HEK293T cells with or without DCAF8-KO followed by Western blot for DNMT3A-GFP, DCAF8, and GAPDH. Inhibitor treatments of proteasome and E1 ubiquitin–activating enzyme in DNMT3AWT and DNMT3AW297Del HEK293 cells serve as rescue control of experiment. F, Western blot analysis of DNMT3A, DCAF8, and GAPDH in DCAF8-KO DNMT3AWT LCLs. G, The image depicts the levels of ubiquitination in DNMT3AWT and DNMT3AW297del HEK293T cells with or without DCAF8-KO. DNMT3A-GFP was pulled down by a GFP antibody, followed by Western blot analysis using ubiquitin and GFP antibody. H, Western blotting analysis of heterozygous mESC unstable mutants (DNMT3AW293Del and DNMT3AG681R) and stable mutants (DNMT3AE752A DNMT3AW856R) with or without Dcaf8-KO. I, Stability of variants before and after DCAF8-KO measured as described in Fig. 2C. J, Schematic of the RBX1–CUL4B–DCAF8 complex serving as the ubiquitin ligase for DNMT3A protein. ***, P < 0.001 using the unpaired t test.
Figure 5.
Targeted CRISPR screening identifies CUL4BDCAF8 ubiquitin ligase complexes essential for DNMT3A protein degradation. A, Schematic of targeted CRISPR screening to identify ubiquitin ligases essential for DNMT3A protein degradation. HEK293T cells were engineered to constitutively overexpress Cas9 and the indicated bicistronic DNMT3AW297Del reporter and then infected with sgRNA libraries targeting ubiquitin ligases. Nine days after infection, we sorted both the top and bottom 5% of cells for DNMT3A-GFP expression. B, The graph depicts the gene enrichment score and P value in targeted CRISPR screening for ubiquitin ligases. DCAF8, RBX1, and CUL4B genes (red) were enriched and statistically significant. C, The image depicts DCAF8 immunoprecipitation in DNMT3A-WT or W297del-expressing cells after incubation for 6 hours with an inhibitor of E1 ubiquitin-activating enzymes (MLN7243), followed by blotting using GFP, DCAF8, DDB1, and GAPDH antibodies. D, DNMT3AW297del-expressing HEK293T cells treated with sgRNA targeting DCAF8, proteasome inhibitor, and E1 ubiquitin–activating enzyme, followed by Western blot analysis for DNMT3A-GFP, DCAF8, and GAPDH. E, Cycloheximide (CHX) treatment with 0, 2, 4, and 6 hours of DNMT3AWT and DNMT3AW297Del HEK293T cells with or without DCAF8-KO followed by Western blot for DNMT3A-GFP, DCAF8, and GAPDH. Inhibitor treatments of proteasome and E1 ubiquitin–activating enzyme in DNMT3AWT and DNMT3AW297Del HEK293 cells serve as rescue control of experiment. F, Western blot analysis of DNMT3A, DCAF8, and GAPDH in DCAF8-KO DNMT3AWT LCLs. G, The image depicts the levels of ubiquitination in DNMT3AWT and DNMT3AW297del HEK293T cells with or without DCAF8-KO. DNMT3A-GFP was pulled down by a GFP antibody, followed by Western blot analysis using ubiquitin and GFP antibody. H, Western blotting analysis of heterozygous mESC unstable mutants (DNMT3AW293Del and DNMT3AG681R) and stable mutants (DNMT3AE752A DNMT3AW856R) with or without Dcaf8-KO. I, Stability of variants before and after DCAF8-KO measured as described in Fig. 2C. J, Schematic of the RBX1–CUL4B–DCAF8 complex serving as the ubiquitin ligase for DNMT3A protein. ***, P < 0.001 using the unpaired t test.

Comment in

References

    1. Jaiswal S, Fontanillas P, Flannick J, Manning A, Grauman PV, Mar BGet al. . Age-related clonal hematopoiesis associated with adverse outcomes. N Engl J Med 2014;371:2488–98. - PMC - PubMed
    1. Genovese G, Kahler AK, Handsaker RE, Lindberg J, Rose SA, Bakhoum SFet al. . Clonal hematopoiesis and blood-cancer risk inferred from blood DNA sequence. N Engl J Med 2014;371:2477–87. - PMC - PubMed
    1. Crowgey EL, Mahajan N, Wong WH, Gopalakrishnapillai A, Barwe SP, Kolb EAet al. . Error-corrected sequencing strategies enable comprehensive detection of leukemic mutations relevant for diagnosis and minimal residual disease monitoring. BMC Med Genomics 2020;13:32. - PMC - PubMed
    1. Jaiswal S, Libby P. Clonal haematopoiesis: connecting ageing and inflammation in cardiovascular disease. Nat Rev Cardiol 2020;17:137–44. - PMC - PubMed
    1. Challen GA, Goodell MA. Clonal hematopoiesis: mechanisms driving dominance of stem cell clones. Blood 2020;136:1590–8. - PMC - PubMed

Publication types

Substances