. 2021 Sep 22;13(612):eabh2624.
doi: 10.1126/scitranslmed.abh2624. Epub 2021 Aug 24.

Type I interferon autoantibodies are associated with systemic immune alterations in patients with COVID-19

Affiliations

Type I interferon autoantibodies are associated with systemic immune alterations in patients with COVID-19

Monique G P van der Wijst et al. Sci Transl Med. .

Abstract

Neutralizing autoantibodies against type I interferons (IFNs) have been found in some patients with critical coronavirus disease 2019 (COVID-19), the disease caused by severe acute respiratory syndrome coronavirus 2 (SARS-CoV-2). However, the prevalence of these antibodies, their longitudinal dynamics across the disease severity scale, and their functional effects on circulating leukocytes remain unknown. Here, in 284 patients with COVID-19, we found type I IFN–specific autoantibodies in peripheral blood samples from 19% of patients with critical disease and 6% of patients with severe disease. We found no type I IFN autoantibodies in individuals with moderate disease. Longitudinal profiling of over 600,000 peripheral blood mononuclear cells using multiplexed single-cell epitope and transcriptome sequencing from 54 patients with COVID-19 and 26 non–COVID-19 controls revealed a lack of type I IFN–stimulated gene (ISG-I) responses in myeloid cells from patients with critical disease. This was especially evident in dendritic cell populations isolated from patients with critical disease producing type I IFN–specific autoantibodies. Moreover, we found elevated expression of the inhibitory receptor leukocyte-associated immunoglobulin-like receptor 1 (LAIR1) on the surface of monocytes isolated from patients with critical disease early in the disease course. LAIR1 expression is inversely correlated with ISG-I expression response in patients with COVID-19 but is not expressed in healthy controls. The deficient ISG-I response observed in patients with critical COVID-19 with and without type I IFN–specific autoantibodies supports a unifying model for disease pathogenesis involving ISG-I suppression through convergent mechanisms.


Figures

Fig. 1.
Fig. 1.. Detection of anti–IFN-α2 antibodies is positively associated with COVID-19 disease severity.
(A) Anti–IFN-α2 antibody (Ab) index values (y axis) for 4 APS-1 patients, 26 critical COVID-19+ (C19+) cases, 102 severe COVID-19+ cases, 156 moderate COVID-19+ cases, and 14 moderate-severe COVID-19 (C19) cases, separated by disease severity and colored by hospitalization status. Positive samples were tested for neutralization against IFN-α2 and IFN-ω (see fig. S1), with arrows indicating those samples with partial or full neutralization ability. The dotted line indicates 6 SDs above healthy control mean. (B) Distribution of the anti–IFN-α2 index values across 4041 individuals in a community cohort from the San Francisco Mission District. (C) Anti–IFN-α2 index values (y axis) for five additional APS-1 patients and 175 CCP donors from the Vitalant Blood Center. (D) Timeline of blood draws for participants in the COVID-19 Multi-Phenotyping for Effective Therapies (COMET) cohort. Disease status, severity, and gender breakdowns are also shown. (E) Anti–IFN-α2 Ab index values over days since first hospitalization for 53 hospitalized COVID-19+ and 14 COVID-19 COMET samples. For 2 of 69 COMET samples, anti–IFN-α2 titers were not assessed.
Fig. 2.
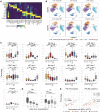
Fig. 2.. Shifts in circulating leukocyte composition are observed in samples isolated from individuals with critical COVID-19.
(A) Marker genes are shown for each of the 11 cell types identified including CD4+ T cells (CD4T), CD8+ T cells (CD8T), γδ T cells (γδT), natural killer cells (NK), B cells (B), plasmablasts (PBs), classical monocytes (cM), nonclassical monocytes (ncM), conventional DCs (cDC), plasmacytoid DCs (pDC), and CD34+ hematopoietic progenitors (Progen). (B) UMAP projections of PBMCs are shown for donors separated by COVID-19 status and severity. Cells are colored by type. (C) Box plots of cell type percentages (y axis) by COVID-19 status and severity on day of hospital admission (D0). Each dot represents the percentage of a specific cell type per donor. Statistical comparisons between cells from all COVID-19+ critical donors (including the anti–IFN-α2 autoantibody donors) and healthy controls, COVID-19 donors, or combined COVID-19+ moderate-severe donors are shown. (D) Box plots show the percentages of PB and B (y axis) in patients with COVID-19 over days 0, 4, 7, and 14 since hospitalization (D0, D4, D7, and D14). Data in (C) and (D) are presented as median and 25th and 75th percentiles. Statistically significant differences are presented using Holm’s multiple-testing corrected, permutation-based P values: *P < 0.05, **P < 0.01, and ***P < 0.001; ns, not significant. (E) Scatter plot of normalized SARS-CoV-2 viral RNA abundances (x axis) versus percentage of PB (y axis) was quantified in donor-matched single-cell PBMC data. RNA was measured by RT-qPCR in tracheal aspirates (left) or nasal swabs (right) as inverse ΔCT (inverse Ct difference between viral E gene and human RNase P gene). R, Pearson correlation in critical (RCr) or moderate-severe (RMS) cases.
Fig. 3.
Fig. 3.. The degree of activation of the ISG-I response differs among the COVID-19 severity scale.
(A) The heatmap shows 161 differentially expressed genes at day 0 [FDR < 0.01, |log(fold change)| > 1] in at least 1 of 11 cell types. CD4+ T cells (CD4T), CD8+ T cells (CD8T), NK cells, B cells (B), PB, cM, ncM, and cDC are shown. Each row represents a gene, and each column is the average expression of the genes in a particular sample across all cells of a specific type. Samples are grouped by both case control status and COVID-19+ severity. Expression is row standardized. Genes are grouped by cluster, with the enriched clusters annotated. (B) Matrix plots showing the expression of shared, type I–specific, and type II–specific ISGs in cM. The shared and specific ISGs were defined using an orthogonal scRNA-seq dataset containing PBMCs stimulated with IFN-β and IFN-γ or left unstimulated (Ctrl) (left). The expression of these same gene set was then plotted in the COMET cohort separated by case control status and disease severity (right). (C) ISG-I and ISG-II scores (y axis) at day 0 across four myeloid cell types and pseudobulk of all other cell types, separated by case control status and disease severity (x axis). Box plots show median and 25th and 75th percentile. (D) ISG-I scores (y axis) over the course of disease for healthy controls and COVID-19 and COVID-19+ cases in cMs. COVID-19+ cases are separated by severity and the presence of anti–IFN-α2 antibodies. Inset shows significant results of linear mixed model (LMM) testing for changes over time. *P < 0.05, **P < 0.01, and ***P < 0.001.
Fig. 4.
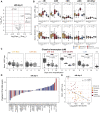
Fig. 4.. Surface protein abundance changes are observed in leukocyte subsets of patients with critical COVID-19.
(A) Volcano plot of log fold change between COVID-19+ and healthy controls (x axis) versus −log10(P value) (y axis) in cM cells. Proteins that are significantly (FDR < 0.05) differentially abundant and have a log2(fold change) > 0.5 are highlighted. (B) Normalized (Norm.) LAIR1 and SIGLEC1 surface expression (exp.; y axis) at day 0 across eight cell types separated by case control status, severity, and presence of anti–IFN-α2 antibodies (x axis). Box plots show median and 25th and 75th percentile. (C) Normalized LAIR1 surface expression (y axis) in cMs over the course of disease for healthy controls, COVID-19 controls, and COVID-19+ cases. COVID-19 controls and COVID-19+ cases are separate by severity and the presence of anti–IFN-α2 antibodies. Insets show significant results of LMM testing for changes over time. (D) The bar plot shows correlation between the surface expression of 52 statistically significantly proteins to ISG-I score in cMs at day 0. Proteins are colored by their log2(fold change) expression between COVID-19+ cases and healthy controls. Red indicates higher expression in COVID-19+ cases. Blue indicates lower expression in COVID-19+ cases. (E) Scatter plot of normalized LAIR1 expression (y axis) versus the ISG-I score (x axis) for COVID-19+ cases colored by severity and anti–IFN-α2 status. *P < 0.05, **P < 0.01, and ***P < 0.001.

References

    1. Wu Z., McGoogan J. M., Characteristics of and important lessons from the coronavirus disease 2019 (COVID-19) outbreak in China. JAMA 323, 1239–1242 (2020). - PubMed
    1. Berlin D. A., Gulick R. M., Martinez F. J., Severe Covid-19. N. Engl. J. Med. 383, 2451–2460 (2020). - PubMed
    1. Zhang J. J. Y., Lee K. S., Ang L. W., Leo Y. S., Young B. E., Risk factors for severe disease and efficacy of treatment in patients infected with COVID-19: A systematic review, meta-analysis, and meta-regression analysis. Clin. Infect. Dis. 71, 2199–2206 (2020). - PMC - PubMed
    1. Stokes E. K., Zambrano L. D., Anderson K. N., Marder E. P., Raz K. M., el Burai Felix S., Tie Y., Fullerton K. E., Coronavirus Disease 2019 Case Surveillance—United States, January 22-May 30, 2020. MMWR Morb. Mortal. Wkly Rep. 69, 759–765 (2020). - PMC - PubMed
    1. Beigel J. H., Tomashek K. M., Dodd L. E., Mehta A. K., Zingman B. S., Kalil A. C., Hohmann E., Chu H. Y., Luetkemeyer A., Kline S., Lopez de Castilla D., Finberg R. W., Dierberg K., Tapson V., Hsieh L., Patterson T. F., Paredes R., Sweeney D. A., Short W. R., Touloumi G., Lye D. C., Ohmagari N., Oh M. D., Ruiz-Palacios G. M., Benfield T., Fätkenheuer G., Kortepeter M. G., Atmar R. L., Creech C. B., Lundgren J., Babiker A. G., Pett S., Neaton J. D., Burgess T. H., Bonnett T., Green M., Makowski M., Osinusi A., Nayak S., Lane H. C.; ACTT-1 Study Group Members , Remdesivir for the treatment of Covid-19—Final report. N. Engl. J. Med. 383, 1813–1826 (2020). - PMC - PubMed

Publication types