Comparative Study
. 2021 Aug 24;14(697):eabe2606.
doi: 10.1126/scisignal.abe2606.

Comparative analysis of TCR and CAR signaling informs CAR designs with superior antigen sensitivity and in vivo function

Affiliations
Comparative Study

Comparative analysis of TCR and CAR signaling informs CAR designs with superior antigen sensitivity and in vivo function

Alexander I Salter et al. Sci Signal. .

Abstract

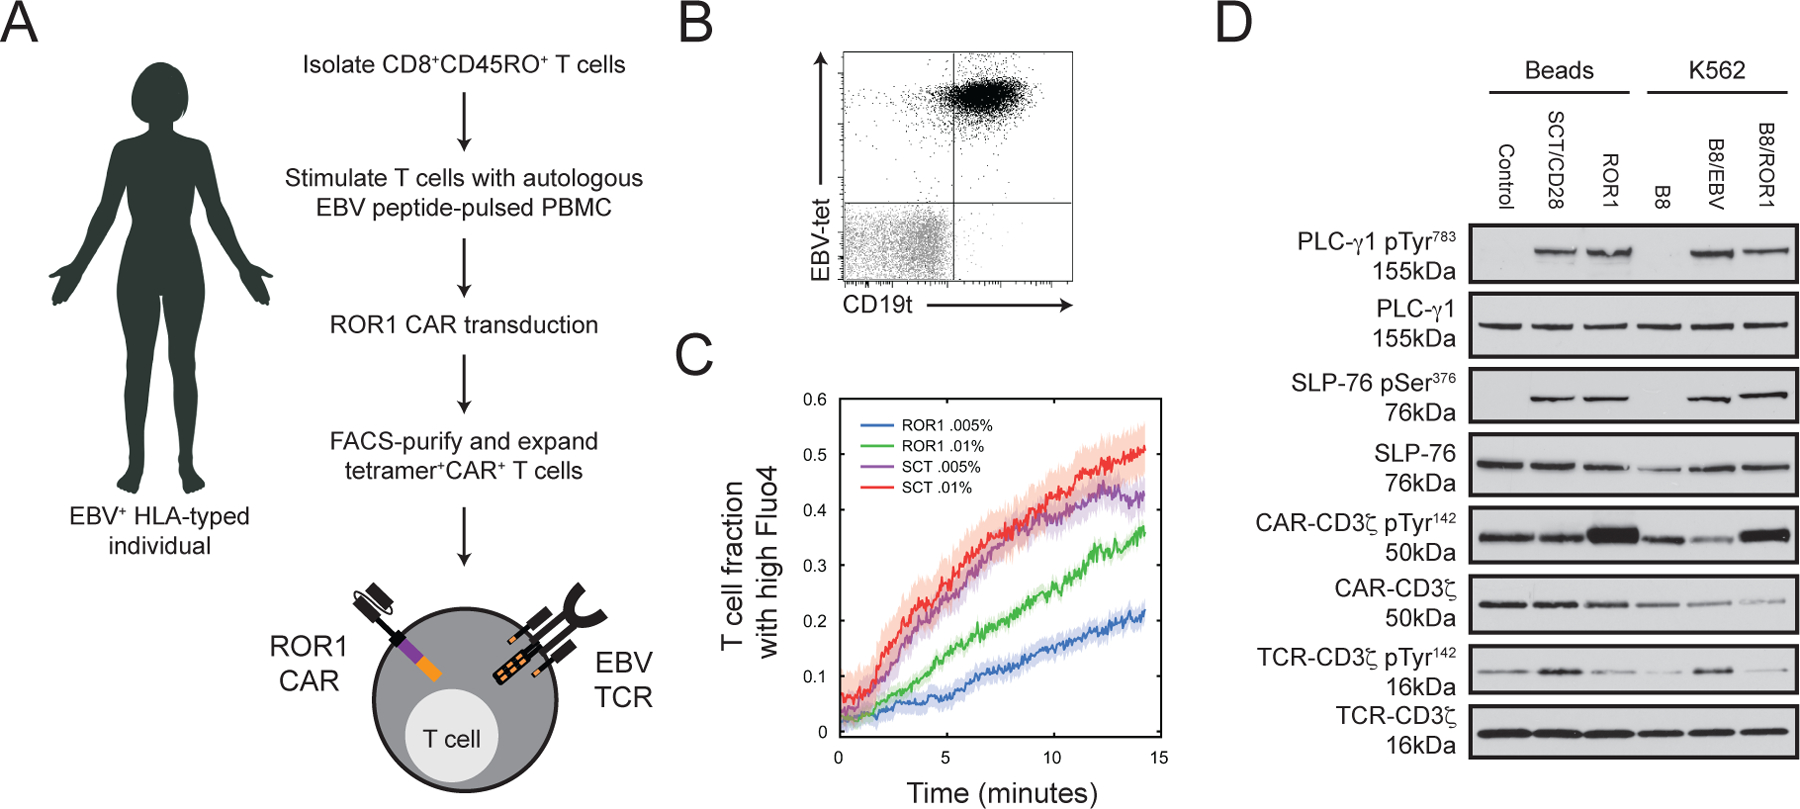
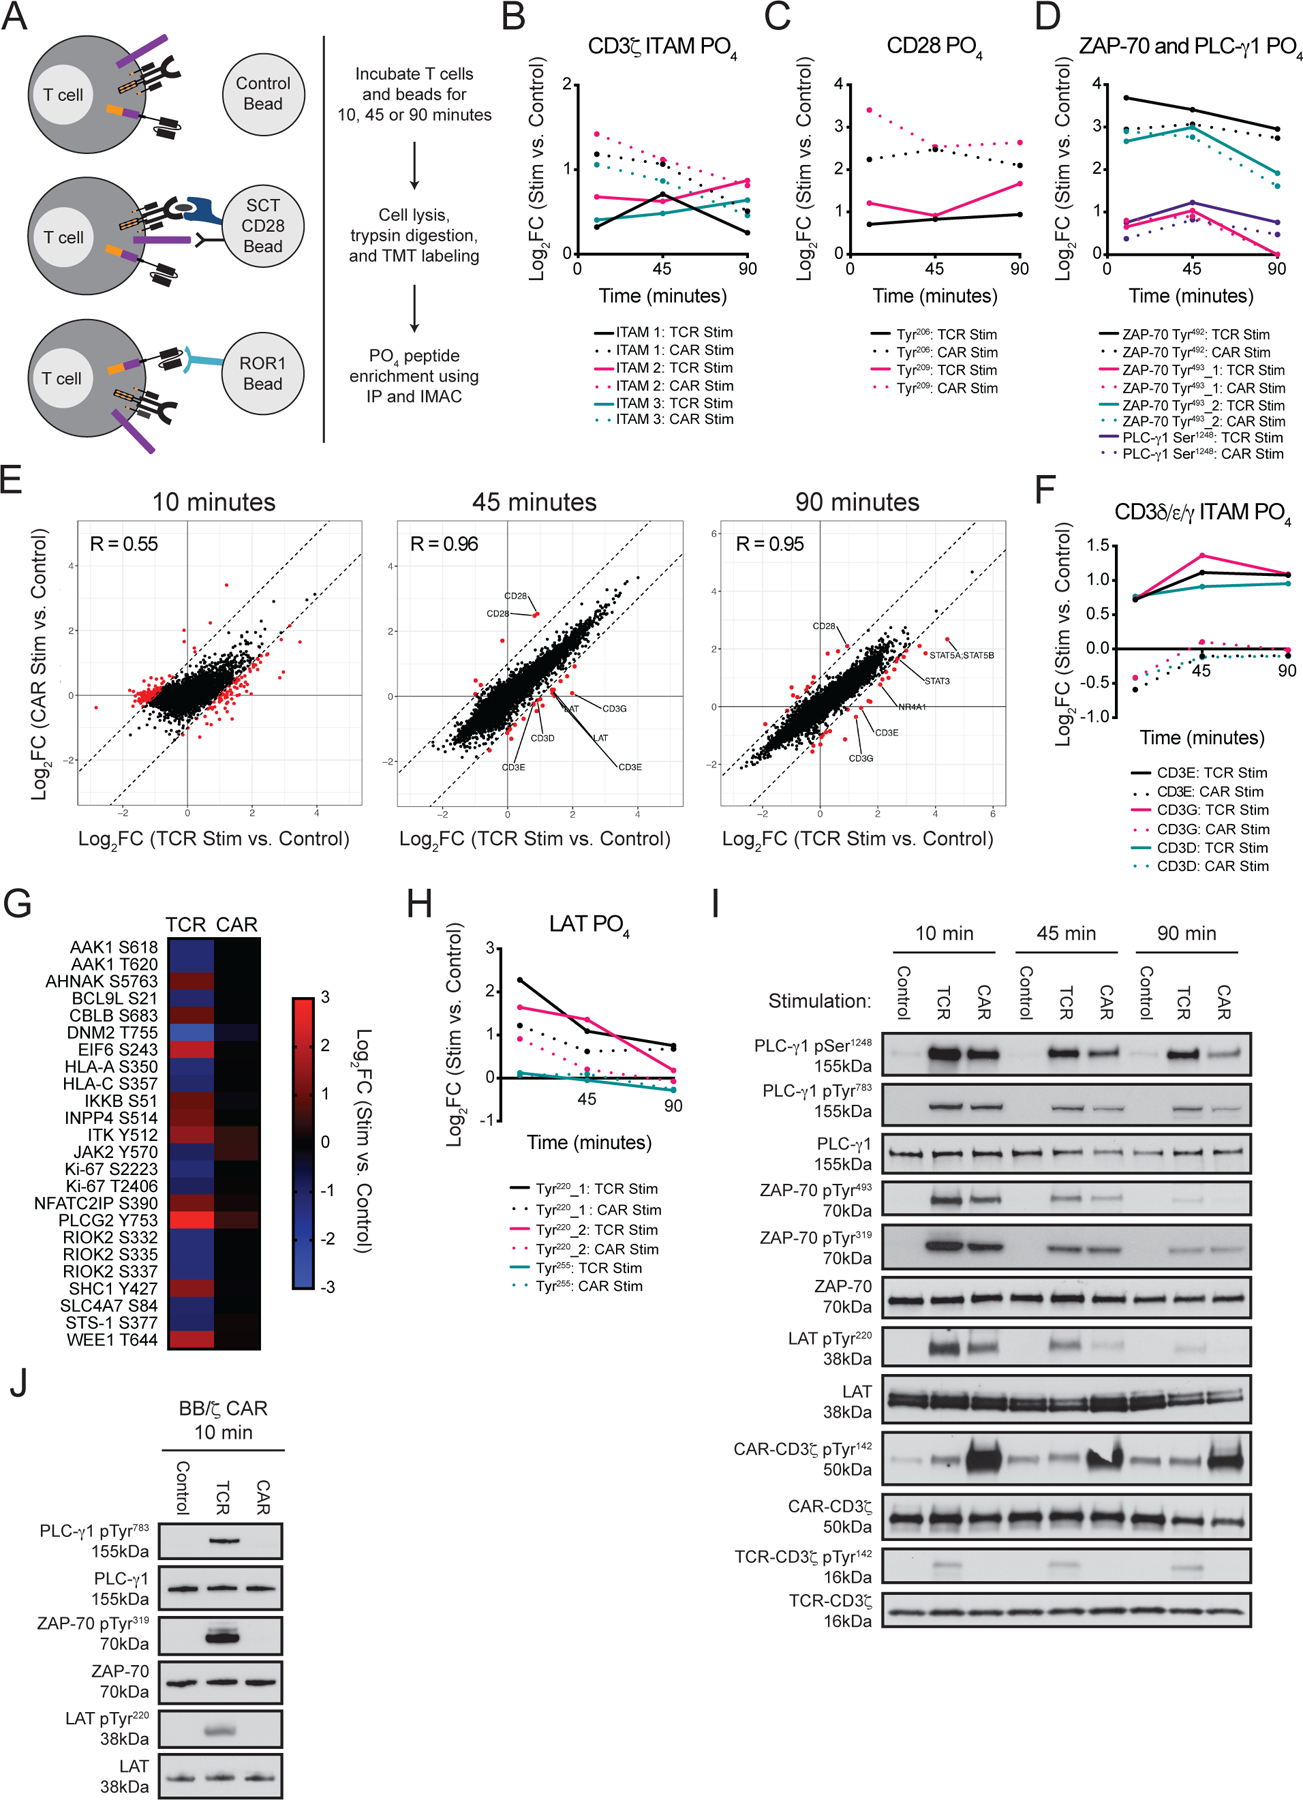
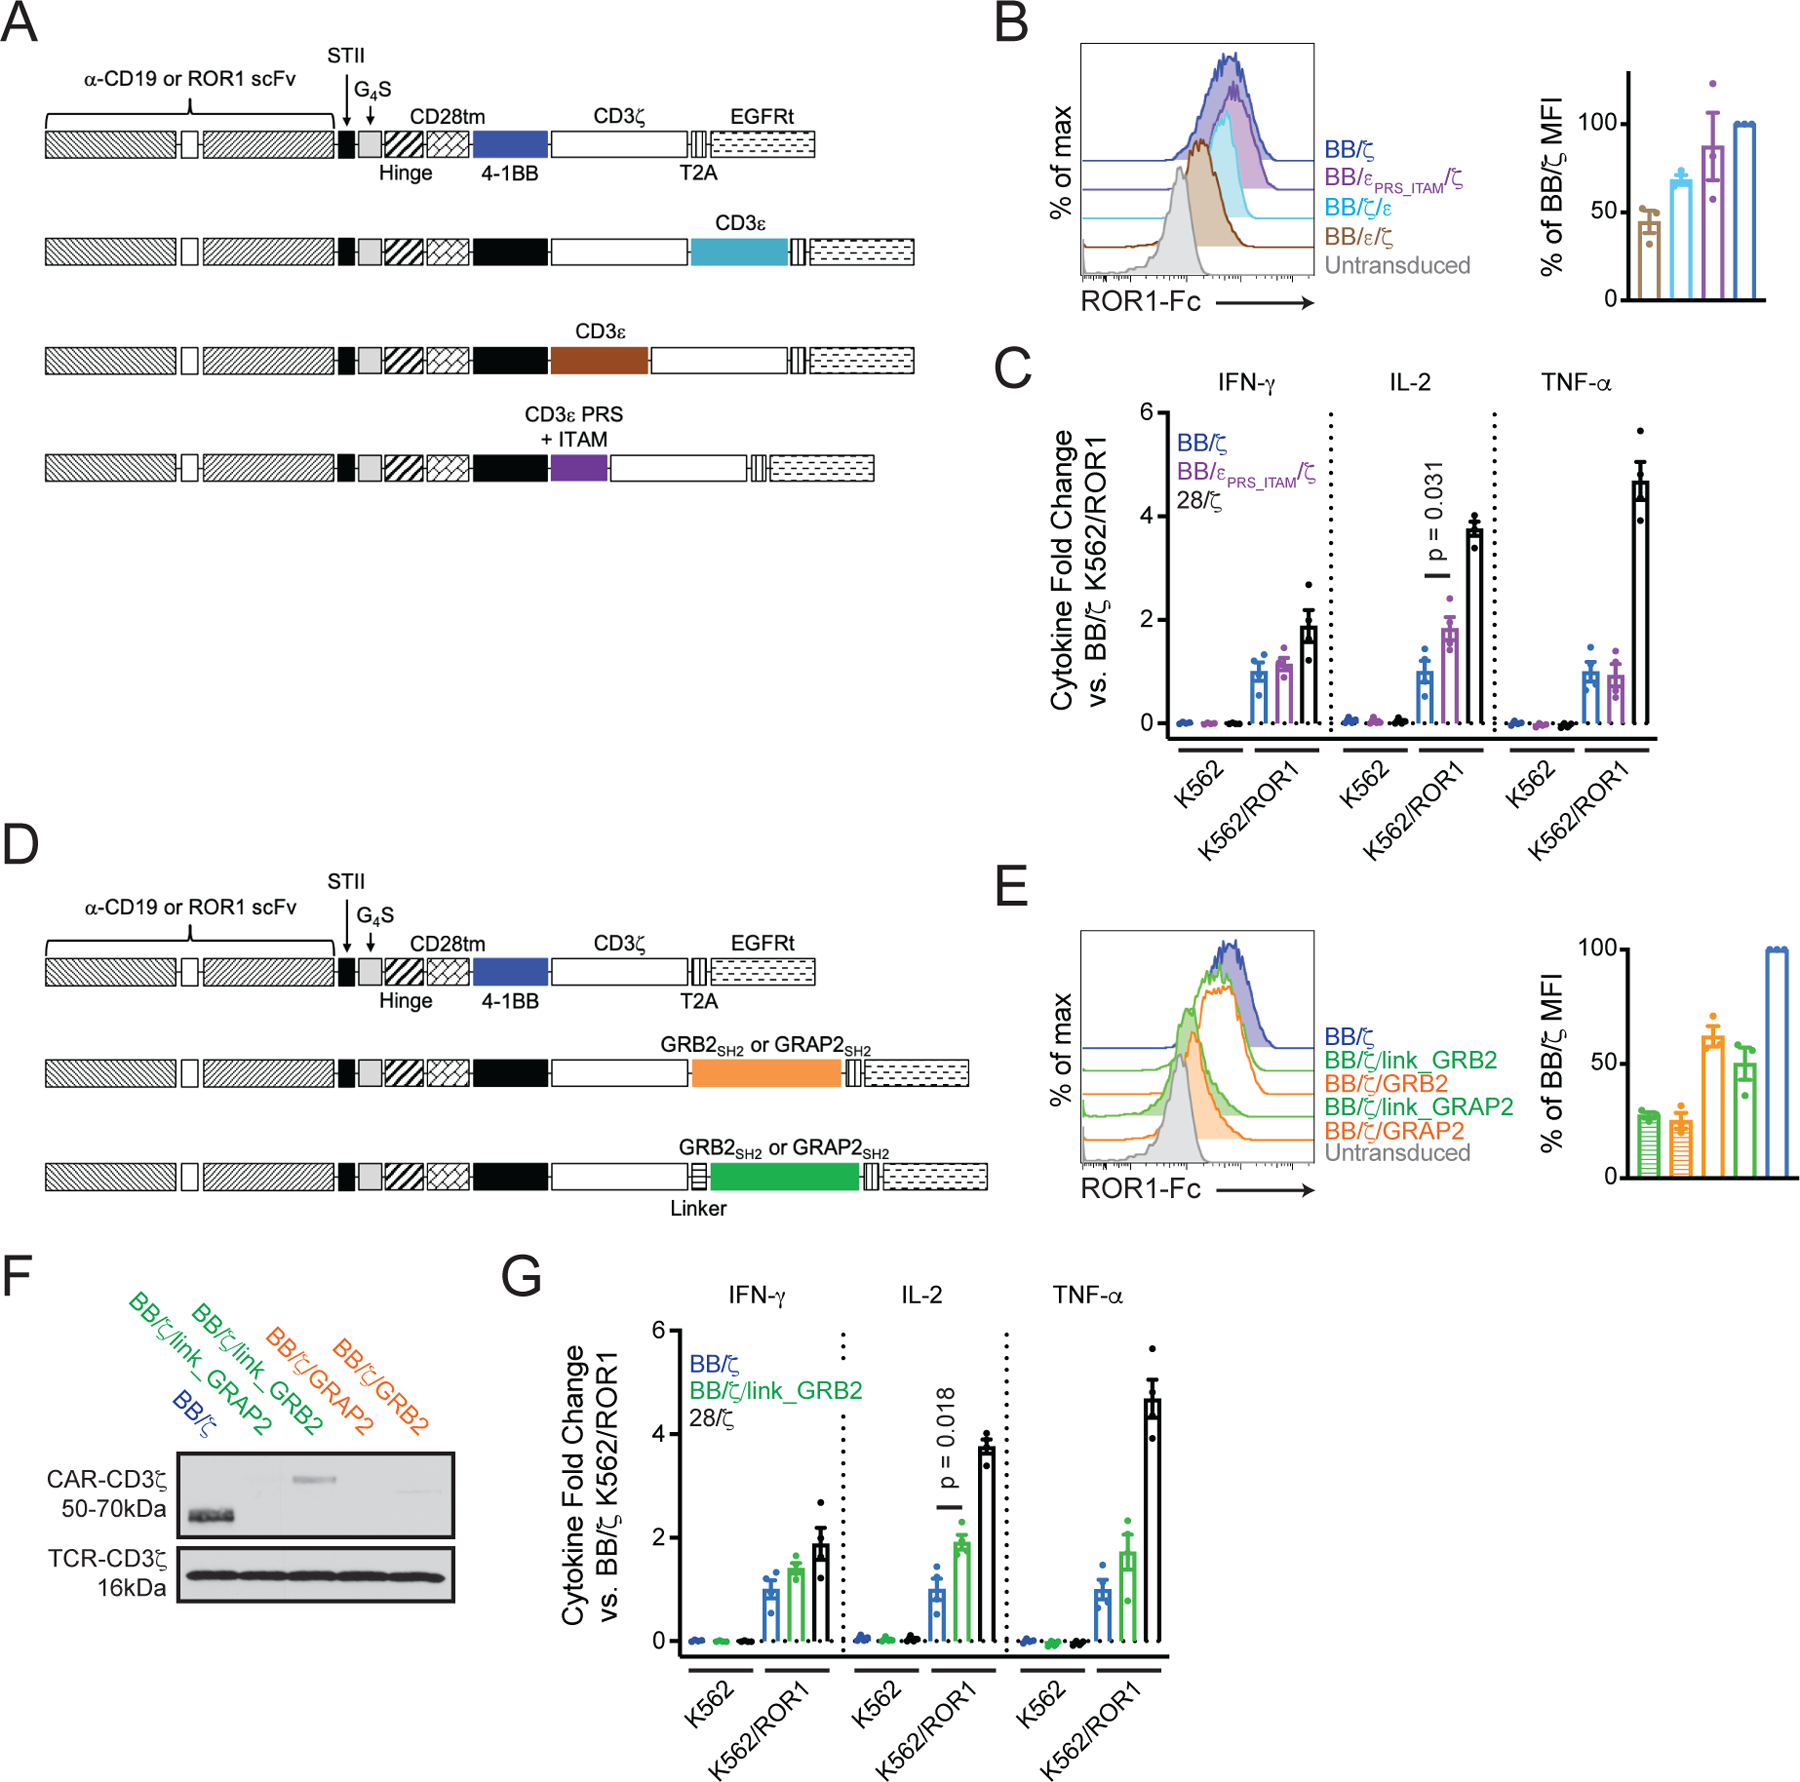
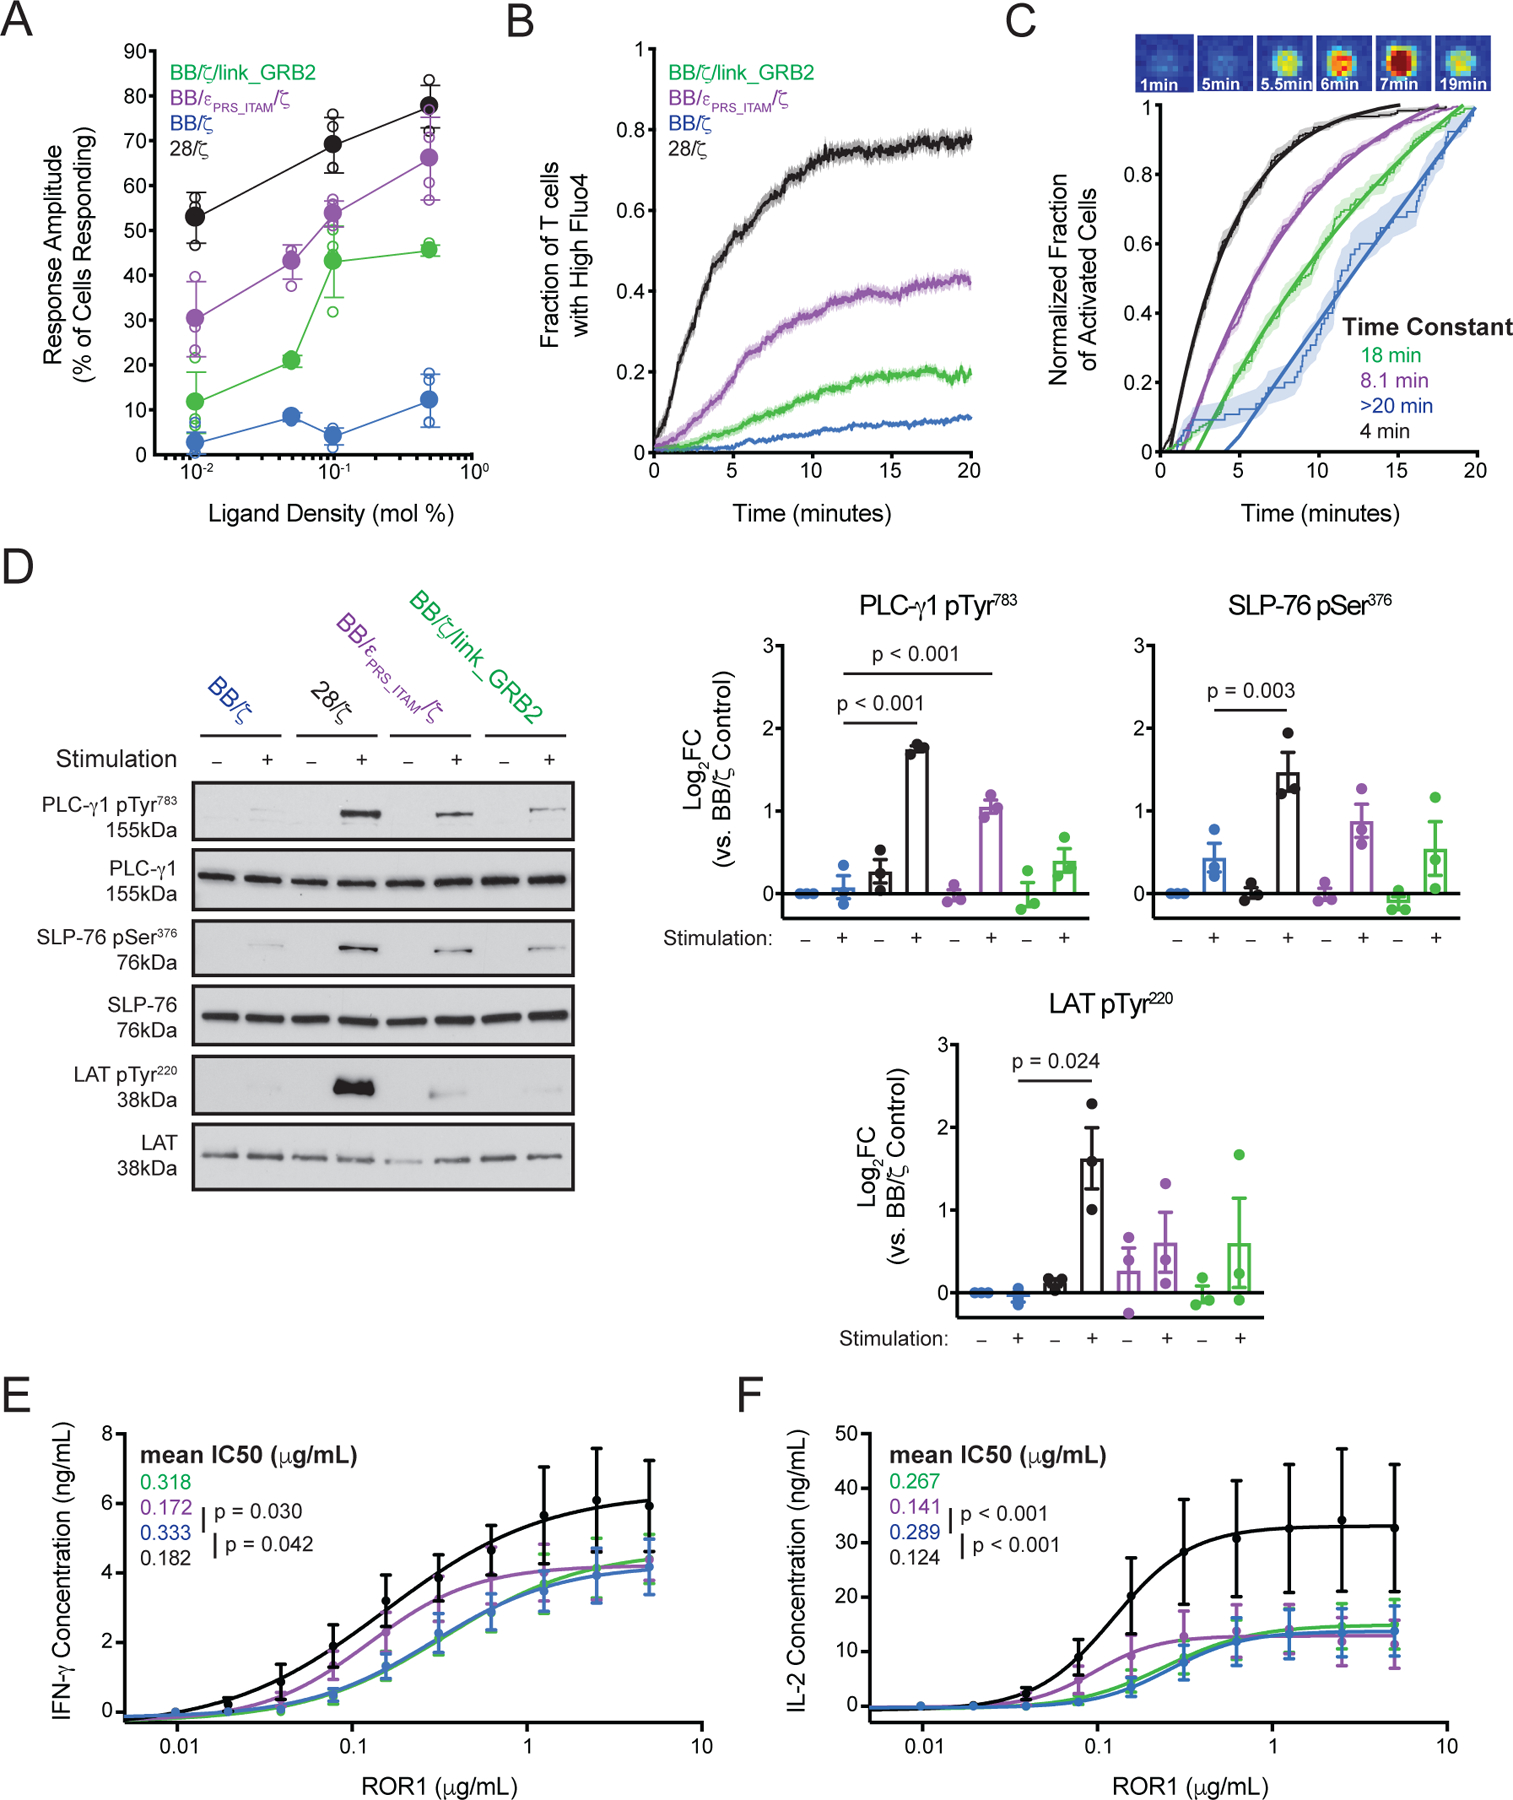
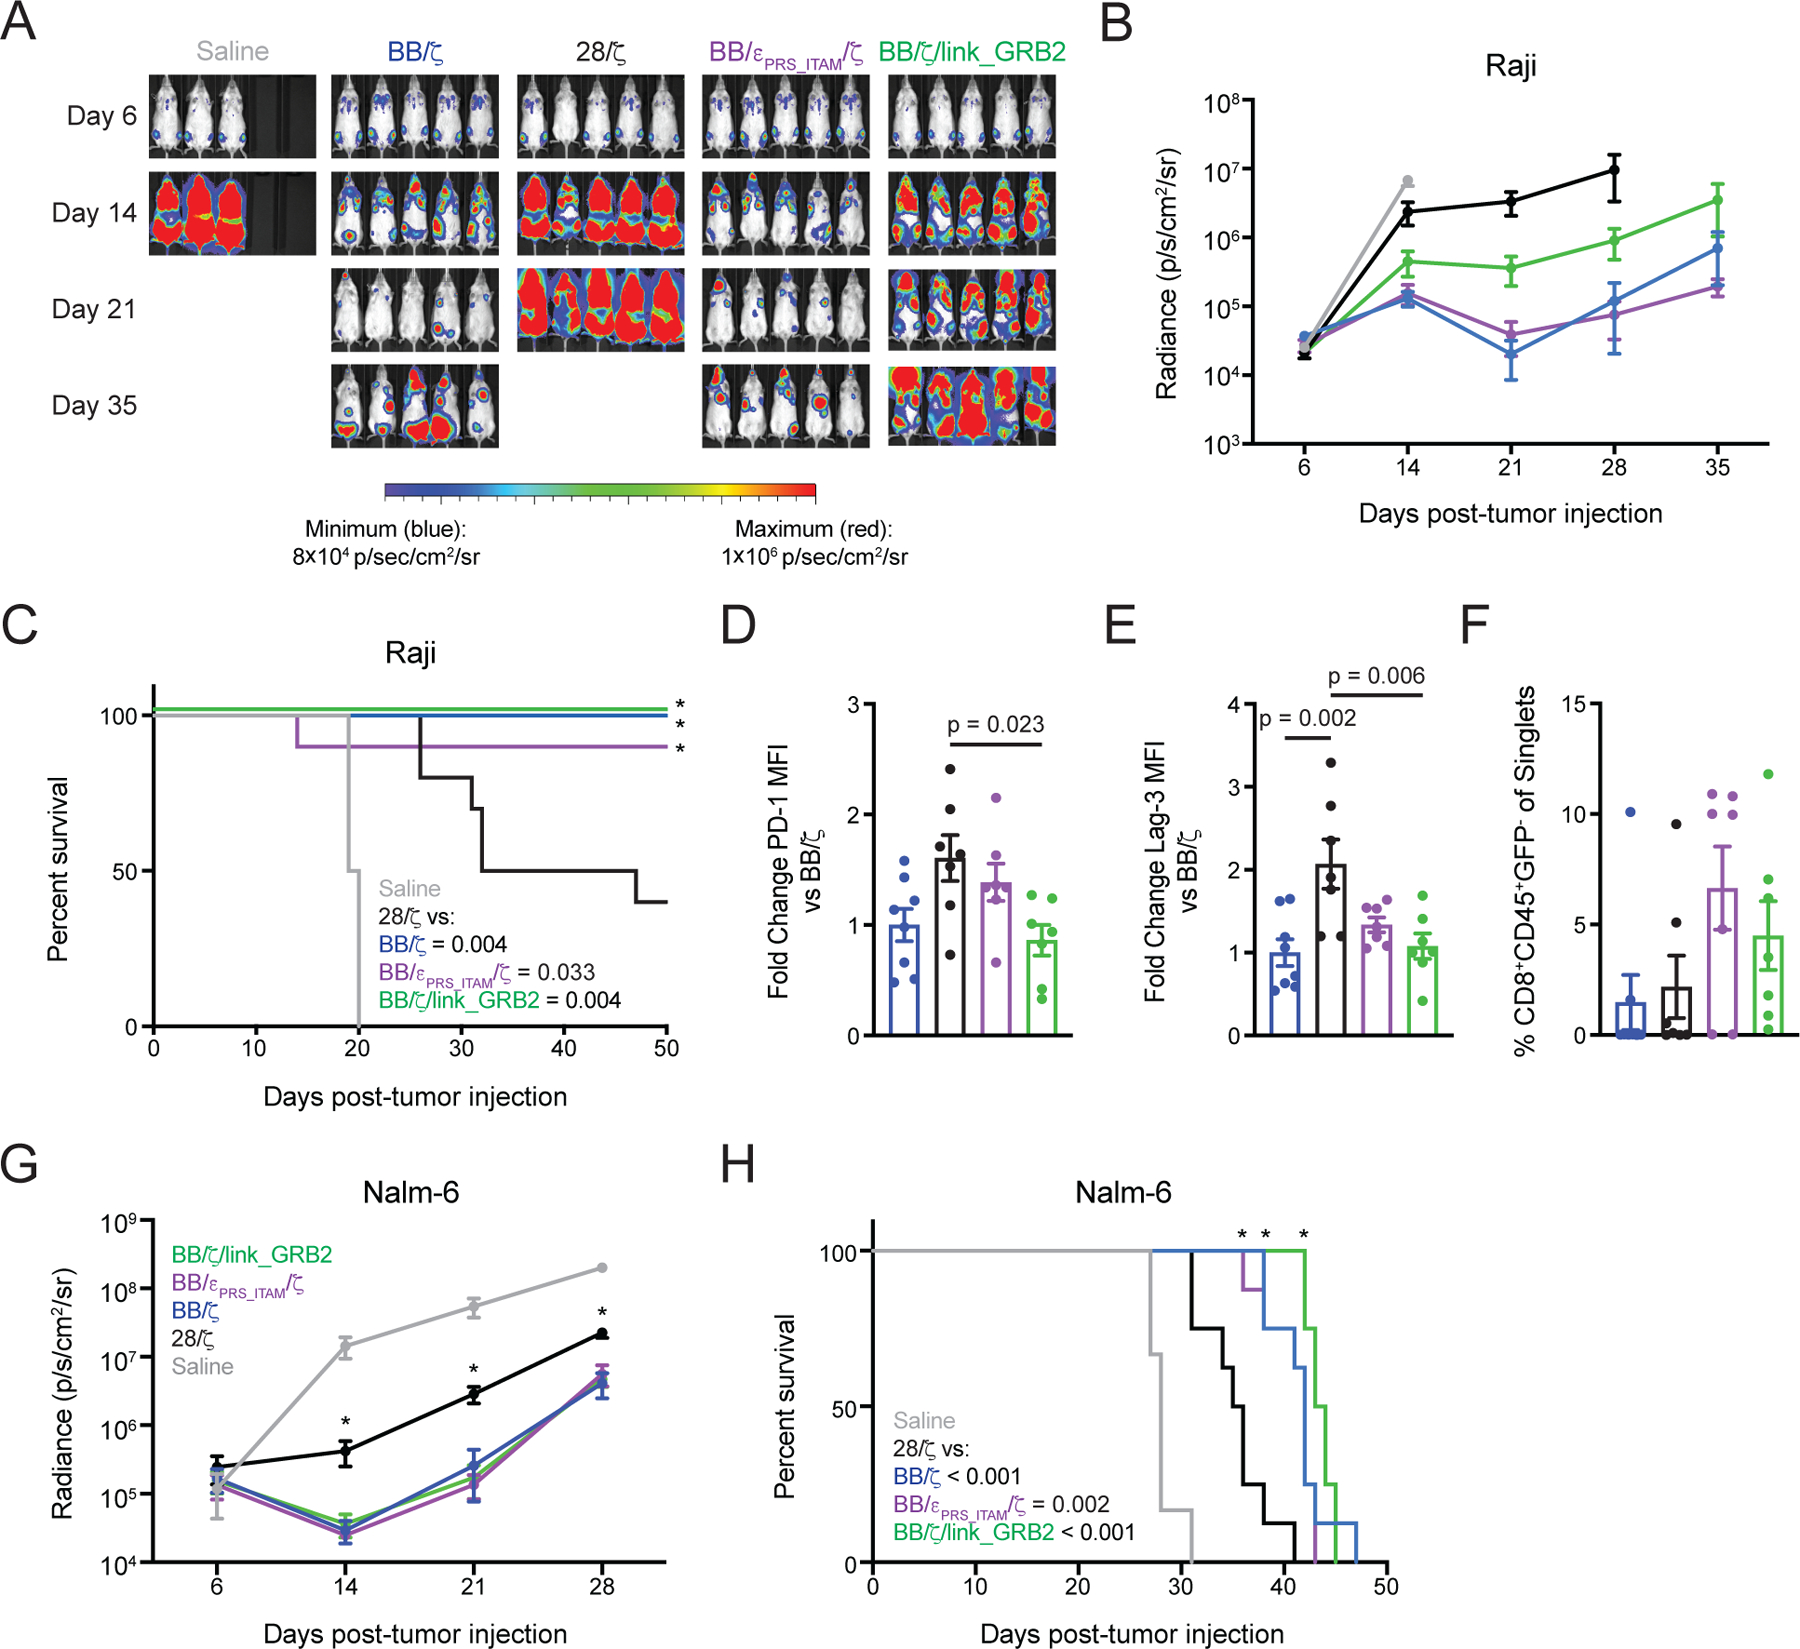
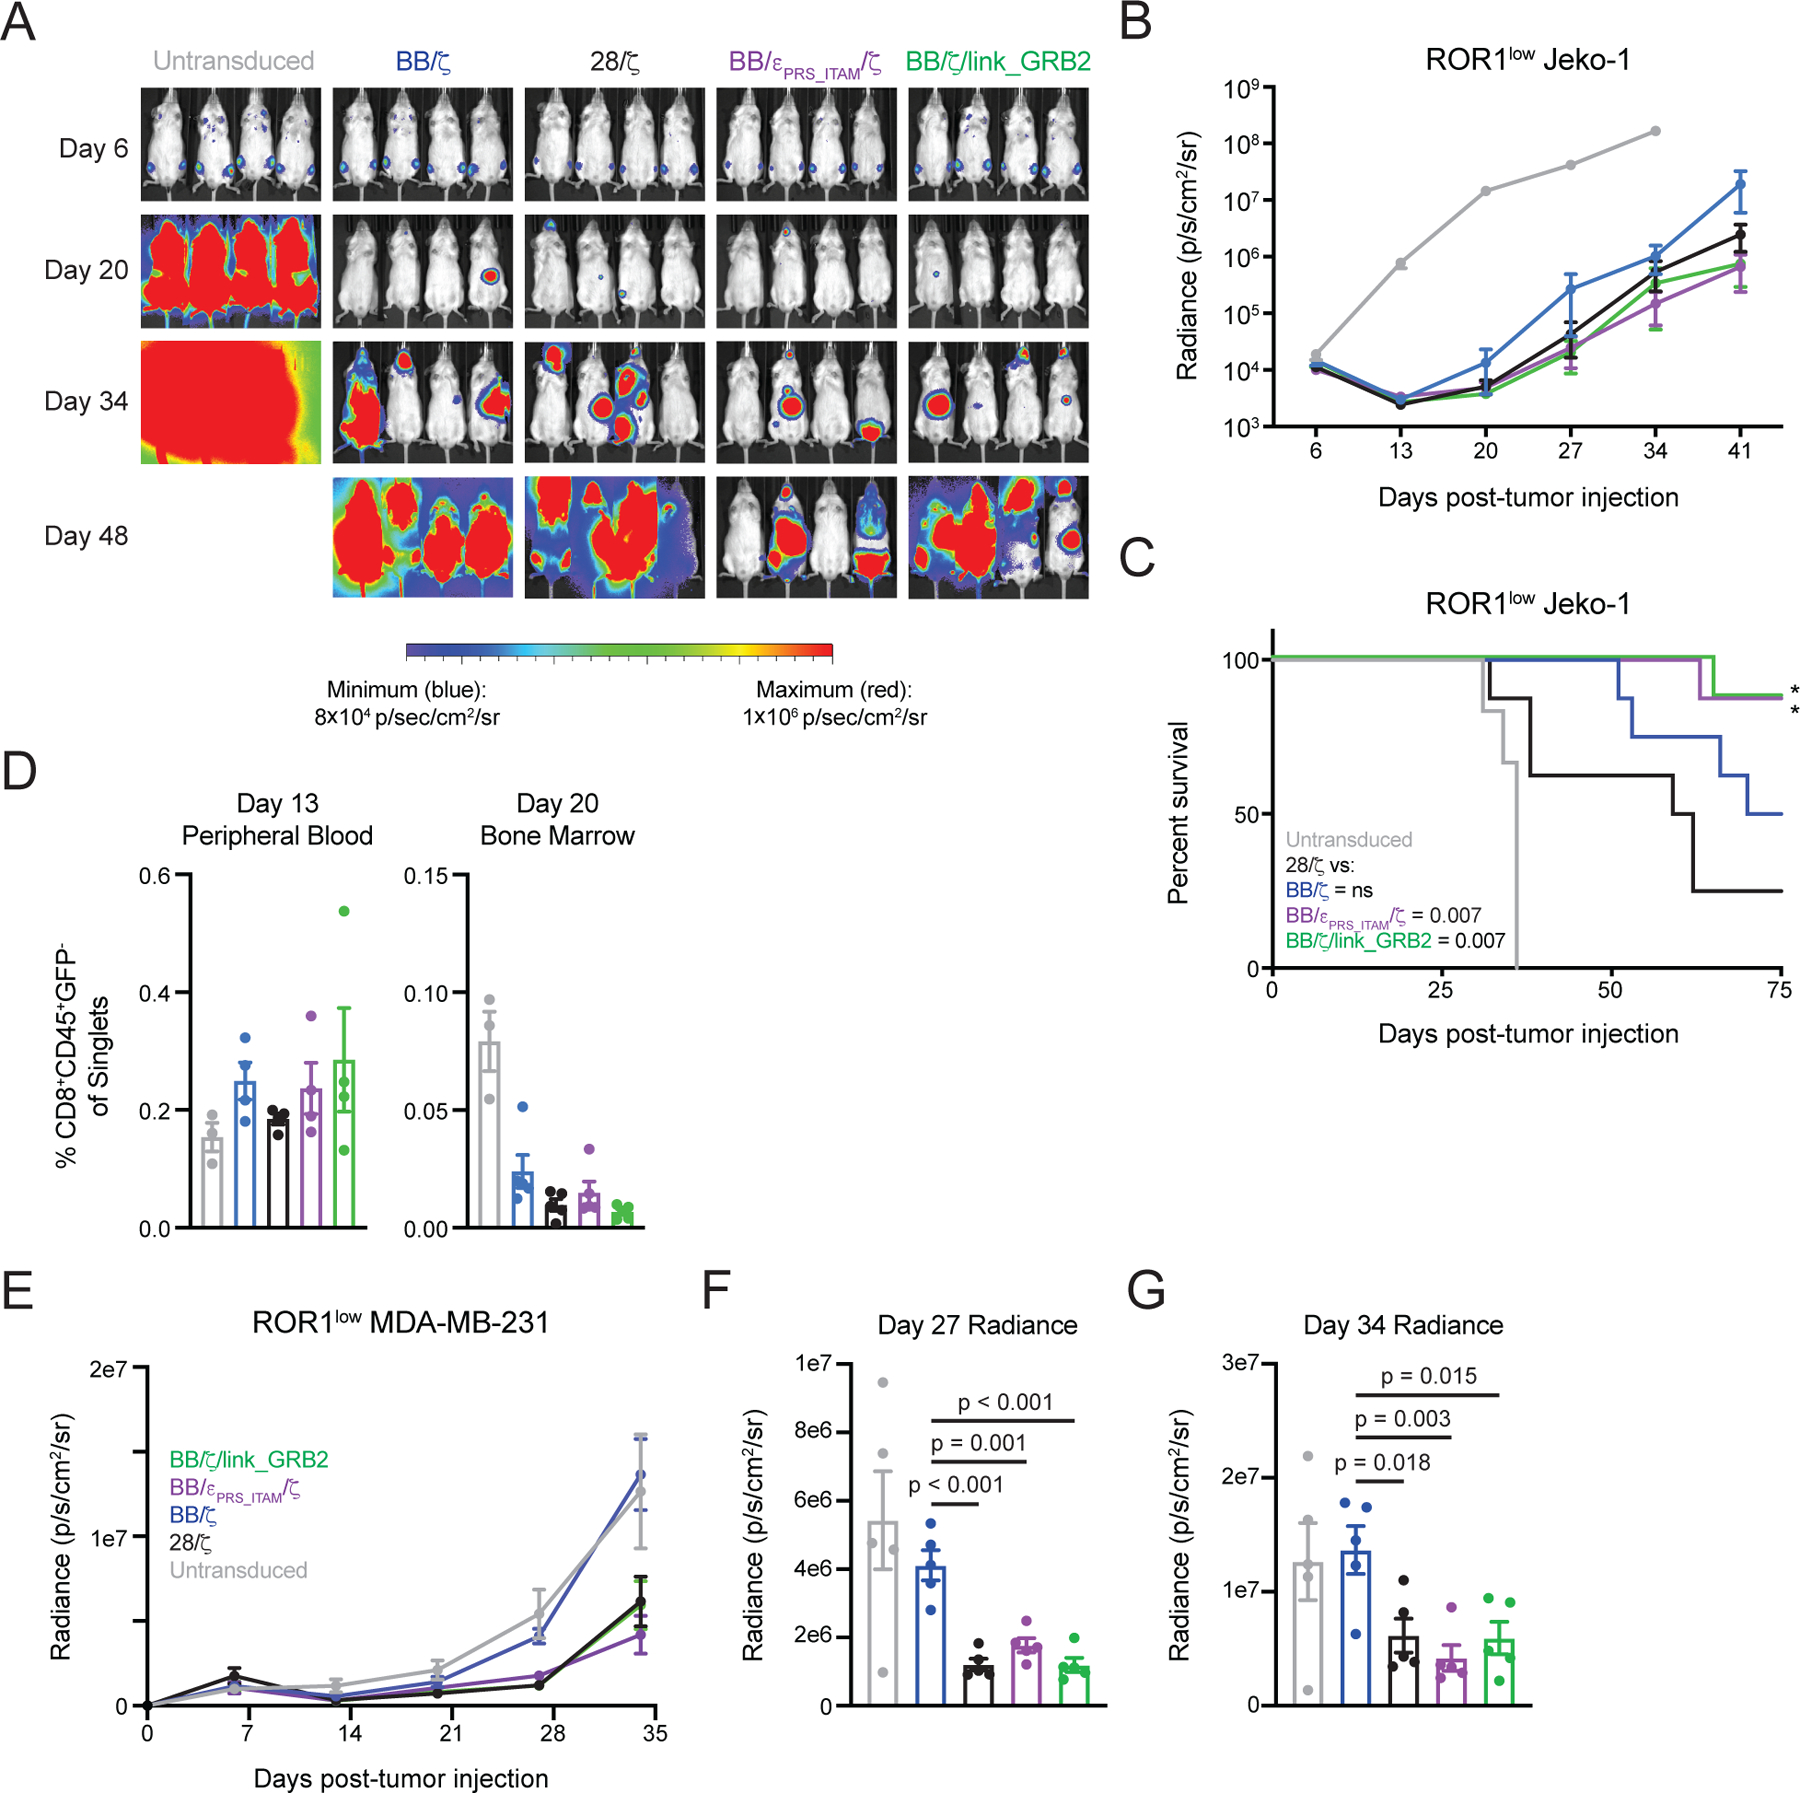
Chimeric antigen receptor (CAR)-modified T cell therapy is effective in treating lymphomas, leukemias, and multiple myeloma in which the tumor cells express high amounts of target antigen. However, achieving durable remission for these hematological malignancies and extending CAR T cell therapy to patients with solid tumors will require receptors that can recognize and eliminate tumor cells with a low density of target antigen. Although CARs were designed to mimic T cell receptor (TCR) signaling, TCRs are at least 100-fold more sensitive to antigen. To design a CAR with improved antigen sensitivity, we directly compared TCR and CAR signaling in primary human T cells. Global phosphoproteomic analysis revealed that key T cell signaling proteins-such as CD3δ, CD3ε, and CD3γ, which comprise a portion of the T cell co-receptor, as well as the TCR adaptor protein LAT-were either not phosphorylated or were only weakly phosphorylated by CAR stimulation. Modifying a commonplace 4-1BB/CD3ζ CAR sequence to better engage CD3ε and LAT using embedded CD3ε or GRB2 domains resulted in enhanced T cell activation in vitro in settings of a low density of antigen, and improved efficacy in in vivo models of lymphoma, leukemia, and breast cancer. These CARs represent examples of alterations in receptor design that were guided by in-depth interrogation of T cell signaling.


Conflict of interest statement

Competing interests: A.I.S. is a shareholder of and scientific consultant for Lyell Immunopharma. S.R.R. is a founder and shareholder of Lyell Immunopharma, and was a founder and scientific advisor of Juno Therapeutics, a Celgene company. R.G. has received consulting income from Juno Therapeutics, Celgene, Illumina, Takeda, Infotech Soft, and Merck, research support from Janssen Pharmaceuticals and Juno Therapeutics, and has an ownership interest in CellSpace Biosciences, Ozette Technologies, and Modulus Therapeutics. A.I.S., A.R., and S.R.R. have filed provisional patents relating to the CAR designs described in this manuscript. The other authors declare that they have no competing interests.

Figures

Figure 1.
Figure 1.. Bi-specific T cells and magnetic beads enable analysis of TCR and CAR signaling in a single cell population.
(A) Schematic describing formulation of bi-specific T cells possessing a EBV-specific TCR and ROR1-specific CAR. (B) Flow cytometry analysis of EBV-tetramer (EBV-tet) binding and CD19t transduction marker expression in expanded T cells. Plot shows stained (black) and isotype (grey) CD8+ singlet lymphocytes. Data are representative of three experiments using T cells from two unique donors. (C) Time plot shows mean ± SEM (shaded) Ca2+ mobilization in bi-specific T cells stimulated by ROR1 (green and blue) or SCT (red and purple) containing lipid bilayers as measured by Fluo-4 AM intensity of individual cell responses. Traces represent the fraction of cells above an activation threshold at any given time. Antigen density was modulated by altering the molar fraction of biotinylated lipids in the supported bilayer: 0.005% (magenta and blue) or 0.01% (red and green). (D) Western blot analysis for CD3ζ, CD3ζ pTyr142, SLP-76, SLP-76 pSer376, PLC-γ1 and PLC-γ1 pTyr783 in cell lysates after stimulation with indicated beads or K562 cells for 45 min. Data are representative of two experiments using T cells from two unique donors.
Figure 2.
Figure 2.. CAR stimulation promotes less intense phosphorylation of CD3 chains and proximal TCR signaling adaptors.
(A) Schematic of experimental design stimulating bi-specific T cells with beads coated with TCR (SCT/CD28) or CAR (ROR1) antigens. (B to D) Graphs show mean log2FC of the indicated phosphorylation (PO4) sites as depicted in (A) from two or three LC-MS/MS experiments with T cells from two unique donors. (E) Comparison of the mean log2FC of phosphorylation sites after TCR or CAR stimulation with SCT/CD28 or ROR1 beads. Red dots specify sites that possessed mean log2FC values differing by ≥ 1 between TCR and CAR stimulated samples at 10, 45, and 90 min relative to control bead stimulation. (F) Graph shows mean log2FC of phosphorylation of CD3δ, CD3ε, and CD3γ ITAMs. The log2FC in phosphorylation of both ITAM tyrosines was averaged. Data are means from two or three LC-MS/MS experiments with T cells from two unique donors. (G) Heat map shows mean log2FC of select phosphorylation sites at the 10-min time point. (H) Graph shows mean log2FC of select phosphorylation sites in LAT. (I) Western blot analysis for CD3ζ, CD3ζ pTyr142, LAT and LAT pTyr220, ZAP-70, ZAP-70 pTyr319, ZAP-70 pTyr493, PLC-γ1, and PLC-γ1 pTyr783, and PLC-γ1 pSer1248 (p = phosphorylation) in the bi-specific T cell lysates utilized for LC-MS/MS experiments. Blots are representative of three experiments using T cells prepared from two unique donors; compiled data is quantified in fig. S4A. (J) Western blot analysis for LAT, LAT pTyr220, ZAP-70, ZAP-70 pTyr319, PLC-γ1, and PLC-γ1 pTyr783 in lysates from bi-specific T cells expressing a BB/ζ CAR after 10 min of stimulation with control, SCT/CD28, or ROR1 beads. Blots are representative of three experiments using T cells prepared from two unique donors; compiled data is quantified in fig. S4B.
Figure 3.
Figure 3.. MS-guided CAR designs are expressed by primary T cells.
(A) Schematics of CARs with CD3ε sequences. (B) Flow cytometry analysis of ROR1-Fc binding to measure CAR expression on transduced T cells. Plots show untransduced (grey) or CD8+EGFRt+ (colors) singlet lymphocytes. Bar graph shows mean ± SEM of relative percent mean fluorescence intensity (MFI) compared to BB/ζ CAR T cells. N = three experiments using T cells from three unique donors. (C) Mean ± SEM fold change of IFN-γ, IL-2, or TNF-α concentration in cellular supernatant 24 hours after co-culture of indicated CAR T cells with K562 or K562/ROR1 tumor cells. N = four unique T cell donors. P value by an ordinary one-way ANOVA with Tukey’s post test. (D) Schematics of CARs with GRB2 or GRAP2 SH2 domains. (E) Flow cytometry analysis of ROR1-Fc binding, as in (B). Bar graph shows mean ± SEM of relative percent MFI compared to BB/ζ CAR T cells. N = three experiments using T cells from three unique donors. (F) Western blot analysis for CD3ζ in CAR T cell lysates. Blot is representative of three independent experiments using T cells from two unique donors. (G) Mean ± SEM fold change of IFN-γ, IL-2, or TNF-α concentration in cellular supernatant, as in (C). N = 4 unique T cell donors. Note, the BB/ζ and 28/ζ CAR data in (G) are the same as those in (C), altogether run in the same experiments. P value by an ordinary one-way ANOVA with Tukey’s post test.
Figure 4.
Figure 4.. Novel CAR designs possess increased antigen sensitivity.
(A) X-Y plot shows the mean ± SEM fraction of cells exhibiting Ca2+ responses after 20 min of exposure to bilayers possessing a range of ROR1 densities as measured by Fluo-4 AM fluorescence intensity. Mol % denotes the molar percentage of ROR1-coated lipids in the bilayer. N = 3 or 4 experiments using T cells from two unique donors. (B) Fluo-4 Ca2+ mobilization measurements for cells stimulated on 0.1% ROR1-labeled bilayers. Time plot shows mean ± SEM (shaded) of the cumulative fraction of Ca2+ mobilization across time after exposure to bilayers. N = 4 independent experiments. (C) Above, image sequence shows a representative example of changing Fluo-4 AM fluorescence intensity as a cell lands on and is activated by a ROR1-containing bilayer. Below, data from (B) is represented as normalized cumulative curves to highlight differences in the kinetics of Ca2+ mobilization. Thick lines are exponential fits to the data with activation time constants for the whole population of cells extracted. (D) Western blot analysis for LAT, LAT pTyr220, SLP-76, SLP-76 pSer376, PLC-γ1 and PLC-γ1 pTyr783 in T cell lysates after 10 minutes of incubation with ROR1 (+) or control (–) beads. Bar graphs show mean ± SEM of log2FC of normalized band intensity from three experiments using T cells from three unique donors. P values were calculated by repeated-measures one-way ANOVA with Tukey’s post test. (E and F) Graphs show mean ± SEM of IFN-γ (E) or IL-2 (F) concentration in supernatant 24 hours after stimulation with the indicated amounts of plate-bound ROR1. A sigmoidal curve was fitted to each CAR construct and mean IC50 is indicated. N = 5 experiments using T cells from five unique donors. P values were calculated by repeated-measures one-way ANOVA with Tukey’s post test.
Figure 5.
Figure 5.. BB/ζ CARs containing CD3ζ or GRB2 domains maintain in vivo antitumor function in settings of high antigen expression.
(A and B) Representative bioluminescence images (A) and mean ± SEM radiance (photons/second/cm2/sr) of (B) Raji/ffluc tumor burden in mice treated with CD19-specific CD8+ CAR T cells. N = 6 or 10 mice per group pooled from two independent experiments using T cells from unique donors. (C) Survival analysis of mice as in (B). Significance (*) and P values (inset legend) were calculated by log-rank test. (D to F) Graphs show mean ± SEM of normalized PD-1 (D) and Lag3 (E) mean fluorescence intensity (MFI) on CD8+CD45+GFP- CAR T cells as well as percent frequency of such cells (F) within the bone marrow 21 days after Raji cell tumor injection. N = 7 or 8 mice per group pooled from two independent experiments using T cells from unique donors. P values by ordinary one-way ANOVA with Tukey’s post test. (G) Graph shows mean ± SEM radiance (photons/second/cm2/sr) of Nalm-6/ffluc tumor burden in mice treated with CD19-specific CD8+ CAR T cells. N = 6 or 8 mice per group pooled from two independent experiments using T cells from unique donors. Significance (* P < 0.05) was assessed by one-way ANOVA with Tukey’s post test. (H) Survival analysis of mice as in (G). Significance (*) and P values (inset legend) assessed by log-rank test.
Figure 6.
Figure 6.. BB/ζ CARs containing CD3ζ or GRB2 domains enhance in vivo antitumor function in settings of low antigen expression.
(A and B) Representative bioluminescence images (A) and mean ± SEM radiance (photons/second/cm2/sr) of (B) Jeko-1/ffluc tumor burden in mice treated with ROR1-specific CD8+ CAR T cells. N = 7 or 8 mice per group pooled from two independent experiments using T cells from unique donors. (C) Survival analysis of mice as in (B). Significance (*) and P values (inset legend) assessed by log-rank test. (D) Graphs show mean ± SEM of CAR T cell frequency within the blood (left) or bone marrow (right) at the indicated time points after Jeko-1 tumor cell injection. N = three or four mice per group. (E to G) Mean ± SEM of radiance of luciferase-expressing MDA-MB-231 tumors over time (E), or at days 27 (F) and 34 (G) after MDA-MB-231 tumor cell injection and treatment with ROR1-specific CD8+ CAR T cells on day 7. N = 5 mice per group. P values determined by an ordinary one-way ANOVA with Tukey’s post test.

References

    1. Turtle CJ, Hanafi L-A, Berger C, Gooley TA, Cherian S, Hudecek M, Sommermeyer D, Melville K, Pender B, Budiarto TM, Robinson E, Steevens NN, Chaney C, Soma L, Chen X, Yeung C, Wood B, Li D, Cao J, Heimfeld S, Jensen MC, Riddell SR, Maloney DG, CD19 CAR-T cells of defined CD4+:CD8+ composition in adult B cell ALL patients, J. Clin. Invest 126, 2123–2138 (2016). - PMC - PubMed
    1. Turtle CJ, Hanafi L-A, Berger C, Hudecek M, Pender B, Robinson E, Hawkins R, Chaney C, Cherian S, Chen X, Soma L, Wood B, Li D, Heimfeld S, Riddell SR, Maloney DG, Immunotherapy of non-Hodgkin’s lymphoma with a defined ratio of CD8+ and CD4+ CD19-specific chimeric antigen receptor-modified T cells, Sci Transl Med 8, 355ra116 (2016). - PMC - PubMed
    1. Neelapu SS, Locke FL, Bartlett NL, Lekakis LJ, Miklos DB, Jacobson CA, Braunschweig I, Oluwole OO, Siddiqi T, Lin Y, Timmerman JM, Stiff PJ, Friedberg JW, Flinn IW, Goy A, Hill BT, Smith MR, Deol A, Farooq U, McSweeney P, Munoz J, Avivi I, Castro JE, Westin JR, Chavez JC, Ghobadi A, Komanduri KV, Levy R, Jacobsen ED, Witzig TE, Reagan P, Bot A, Rossi J, Navale L, Jiang Y, Aycock J, Elias M, Chang D, Wiezorek J, Go WY, Axicabtagene Ciloleucel CAR T-Cell Therapy in Refractory Large B-Cell Lymphoma, N Engl J Med 377, 2531–2544 (2017). - PMC - PubMed
    1. Gardner RA, Finney O, Annesley C, Brakke H, Summers C, Leger K, Bleakley M, Brown C, Mgebroff S, Kelly-Spratt KS, Hoglund V, Lindgren C, Oron AP, Li D, Riddell SR, Park JR, Jensen MC, Intent-to-treat leukemia remission by CD19 CAR T cells of defined formulation and dose in children and young adults, Blood 129, 3322–3331 (2017). - PMC - PubMed
    1. Kochenderfer JN, Somerville RPT, Lu T, Shi V, Bot A, Rossi J, Xue A, Goff SL, Yang JC, Sherry RM, Klebanoff CA, Kammula US, Sherman M, Perez A, Yuan CM, Feldman T, Friedberg JW, Roschewski MJ, Feldman SA, McIntyre L, Toomey MA, Rosenberg SA, Lymphoma Remissions Caused by Anti-CD19 Chimeric Antigen Receptor T Cells Are Associated With High Serum Interleukin-15 Levels, J. Clin. Oncol, JCO2016713024 (2017). - PMC - PubMed

Publication types

MeSH terms

Substances