. 2022 Jan 1;30(1):98-116.
doi: 10.4062/biomolther.2021.075.

Discovery of Cellular RhoA Functions by the Integrated Application of Gene Set Enrichment Analysis

Discovery of Cellular RhoA Functions by the Integrated Application of Gene Set Enrichment Analysis

Kwang-Hoon Chun. Biomol Ther (Seoul). .

Abstract

The small GTPase RhoA has been studied extensively for its role in actin dynamics. In this study, multiple bioinformatics tools were applied cooperatively to the microarray dataset GSE64714 to explore previously unidentified functions of RhoA. Comparative gene expression analysis revealed 545 differentially expressed genes in RhoA-null cells versus controls. Gene set enrichment analysis (GSEA) was conducted with three gene set collections: (1) the hallmark, (2) the Kyoto Encyclopedia of Genes and Genomes (KEGG) pathway, and (3) the Gene Ontology Biological Process. GSEA results showed that RhoA is related strongly to diverse pathways: cell cycle/growth, DNA repair, metabolism, keratinization, response to fungus, and vesicular transport. These functions were verified by heatmap analysis, KEGG pathway diagramming, and direct acyclic graphing. The use of multiple gene set collections restricted the leakage of information extracted. However, gene sets from individual collections are heterogenous in gene element composition, number, and the contextual meaning embraced in names. Indeed, there was a limit to deriving functions with high accuracy and reliability simply from gene set names. The comparison of multiple gene set collections showed that although the gene sets had similar names, the gene elements were extremely heterogeneous. Thus, the type of collection chosen and the analytical context influence the interpretation of GSEA results. Nonetheless, the analyses of multiple collections made it possible to derive robust and consistent function identifications. This study confirmed several well-described roles of RhoA and revealed less explored functions, suggesting future research directions.

Keywords: GSE64714; Gene Set Enrichment Analysis (GSEA); Gene ontology; Hallmark pathway; Kyoto Encyclopedia of Genes and Genomes (KEGG) pathway; RhoA.


Figures

Fig. 1
Fig. 1
Study flow diagram. The chart describes the methods used and the features extracted during analyses of the GSE dataset GSE64714.
Fig. 2
Fig. 2
Preprocessing and identification of DEGs. Datasets of three wild-type samples (control) and three RhoA-null samples (KO) were preprocessed and analyzed for DEGs. (A) Box plots of log2 expression values of the GSE64714 dataset before (left) and after RMA normalization (right). (B) PCA plot representing the differential gene expression patterns of RhoA-null and wild-type samples in two dimensions; x-axis=PC1: PCA component 1; y-axis=PC2: PCA component 2. (C) MA plot for 18,993 genes after filtration. The x-axis represents the average log2 intensity of genes, and the y-axis represents the log2 fold change. (D) Volcano plot for DEGs. DEG, differentially expressed gene. (E) A total of 189 DEGs (log2|FC|>1 and FDR<0.05) were selected and clustered hierarchically based on distances. The row for each cluster was divided into two parts (up- and downregulation) and are displayed using a heatmap.
Fig. 3
Fig. 3
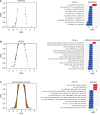
Quality assessments of three collections in GSEA. GSEA was performed for 20,563 genes using the fgsea package using (A) the “hallmark” (50 gene sets), (B) the “KEGG” (186 gene sets), and (C) the “GO BP” (7,350 gene sets) collections. In each pathway, the FDR of gene sets obtained from GSEA was plotted against the NES (left). Gene sets with a FDR<0.01 were displayed using bar plots (right). Only 12 gene sets of “GO BP” were selected and displayed because of space limitations. Red; positive NES, blue; negative NES.
Fig. 4
Fig. 4
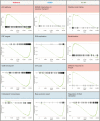
Enrichment plots in three collections. Enrichment plots for significantly up- or downregulated pathways for the “hallmark,” the “KEGG,” and the “GO BP” collections.
Fig. 5
Fig. 5
Overview of RhoA’s function inferred from GSEA. Highly scored gene sets from three collections were organized and combined according to their functional similarity (left boxes). Summarized common functions were noted on the right side. Cell cycle and growth-related functions were the most highly scored. Gene sets from the hallmark, KEGG pathway, and GO BP are colored in pink, blue, and yellow, respectively.
Fig. 6
Fig. 6
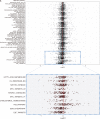
Evaluation of GSEA results of the “hallmark” pathways. (A) To inspect the performance of GSEA, the distribution of log2FC values of individual genes was displayed. All 50 gene sets of the hallmark pathway collection were examined. Each dot represents a mean log2FC value of an individual gene element from a triplicate sample. Gene sets are sorted along the y-axis by placing the set with the lowest FDR value on the bottom. The 10 most affected gene sets were further enlarged for the detail in the magnification box below. A vertical red line indicates genes showing no change in expression between RhoA-KO and the control. (B) The hierarchical clustering and heatmap display of most upregulated (p53 pathway) or downregulated (E2F targets pathway) genes by RhoA deletion. Gene names are listed on the right side and treatment is marked on the bottom of the colored map. The color bar indicates the log2FC values (RhoA-KO vs. control).
Fig. 6
Fig. 6
Evaluation of GSEA results of the “hallmark” pathways. (A) To inspect the performance of GSEA, the distribution of log2FC values of individual genes was displayed. All 50 gene sets of the hallmark pathway collection were examined. Each dot represents a mean log2FC value of an individual gene element from a triplicate sample. Gene sets are sorted along the y-axis by placing the set with the lowest FDR value on the bottom. The 10 most affected gene sets were further enlarged for the detail in the magnification box below. A vertical red line indicates genes showing no change in expression between RhoA-KO and the control. (B) The hierarchical clustering and heatmap display of most upregulated (p53 pathway) or downregulated (E2F targets pathway) genes by RhoA deletion. Gene names are listed on the right side and treatment is marked on the bottom of the colored map. The color bar indicates the log2FC values (RhoA-KO vs. control).
Fig. 7
Fig. 7
Mapping GSEA results on KEGG pathways. For two pathways obtained from GSEA on the KEGG pathways, DEGs were expressed in the signaling pathway diagram of (A) “SNARE interaction in vesicular transport” (KEGG id#: 04130) and (B) “DNA replication” signaling pathways (KEGG id#: 03030). Significantly upregulated or downregulated genes (p<0.05) by RhoA depletion are colored red or blue. Genes without significant change are colored green.
Fig. 7
Fig. 7
Mapping GSEA results on KEGG pathways. For two pathways obtained from GSEA on the KEGG pathways, DEGs were expressed in the signaling pathway diagram of (A) “SNARE interaction in vesicular transport” (KEGG id#: 04130) and (B) “DNA replication” signaling pathways (KEGG id#: 03030). Significantly upregulated or downregulated genes (p<0.05) by RhoA depletion are colored red or blue. Genes without significant change are colored green.
Fig. 8
Fig. 8
A directed acyclic graph (DAG) showing the hierarchical structure of gene sets of GO BP. A DAG was constructed from 51 most enriched GO BP terms (p<0.01 and |NES|>2) using (A) GOView web-based software (Shoop et al., 2004) and (B) AEGIS software (Zhu et al., 2019). (A) GO BP terms are colored red, and the terms with similar functions are grouped and circled. The names of the GO BP terms are listed below the group name. The end nodes representing the lowest level are colored green. (B) A DAG constructed using AEGIS software. (Left) The focus graph renders the hierarchical structure of the inquired sub GO BP terms. The structure is expressed in a buoyant layout mode. Each node represents a GO term and each link represents a parent–child relationship. A parent node is always placed at a level higher than its children. The enriched GO BP terms are colored blue. (Right) The context graph provides full ontology under the root anchor of “biological process” (GO:0008150, 13,310 GO terms). At each level, the node counts of terms of interest are presented in the purple bar, with the whole other GO terms at the same level in gray.
Fig. 9
Fig. 9
Comparative analyses of the KEGG “SNARE interaction in vesicular transport” with gene sets from the hallmark and GO BP. The KEGG “SNARE interaction in vesicular transport” gene set consists of 18 genes. Gene sets similar to the KEGG were retrieved from the hallmark (one gene set) and GO BP (10 gene sets) collections. (A) Whether the searched gene sets contain the 18 genes was visualized with a heatmap in brown color. (B) The range of gene set sizes is expressed in the bar plot. The numbers of the overlapped genes are expressed in orange and those of non-overlapped genes are in blue (left). The Jaccard distance is provided to take the set size into account for comparison (middle). NES values are presented on the right side. The gene sets were sorted in the order of the Jaccard distance. (C) According to the collection, the FDR-NES plot of 12 selected gene sets shows that even similar gene sets are evaluated differently in GSEA. (D) A DAG diagram shows the resemblance between two gene sets closely related to the KEGG gene set: “GO vesicle docking” (GO: 0048278, blue) and “GO organelle membrane fusion” (GO: 0090174) in the orange-colored box. (E) Enrichment plots of the three most closely resembled GO BP gene sets.
Fig. 9
Fig. 9
Comparative analyses of the KEGG “SNARE interaction in vesicular transport” with gene sets from the hallmark and GO BP. The KEGG “SNARE interaction in vesicular transport” gene set consists of 18 genes. Gene sets similar to the KEGG were retrieved from the hallmark (one gene set) and GO BP (10 gene sets) collections. (A) Whether the searched gene sets contain the 18 genes was visualized with a heatmap in brown color. (B) The range of gene set sizes is expressed in the bar plot. The numbers of the overlapped genes are expressed in orange and those of non-overlapped genes are in blue (left). The Jaccard distance is provided to take the set size into account for comparison (middle). NES values are presented on the right side. The gene sets were sorted in the order of the Jaccard distance. (C) According to the collection, the FDR-NES plot of 12 selected gene sets shows that even similar gene sets are evaluated differently in GSEA. (D) A DAG diagram shows the resemblance between two gene sets closely related to the KEGG gene set: “GO vesicle docking” (GO: 0048278, blue) and “GO organelle membrane fusion” (GO: 0090174) in the orange-colored box. (E) Enrichment plots of the three most closely resembled GO BP gene sets.
Fig. 10
Fig. 10
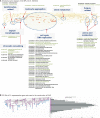
Comparative analyses of the hallmark “p53 pathway” with gene sets from the KEGG and GO BP. The gene sets with similarity with the hallmark “p53 pathway” gene set (50 genes) were searched from the KEGG and GO BP collections. (A) Gene set sizes are expressed in the bar plot (left). Orange, the overlapped genes; blue, non-overlapped genes. The Jaccard distance is provided in the middle. NES values are presented on the right side. The gene sets were sorted in the order of the Jaccard distance. (B) The FDR-NES plot of the 10 selected gene sets (left). The gene set is listed in increasing NES value order, and the corresponding NES value is provided on the right. (C) The distribution of log2FC values of individual genes. The 10 selected gene sets were examined. Each dot represents a mean log2FC value of an individual gene element. Gene sets are marked with the number along the y-axis. (D) The enrichment plots for the hallmark “p53 pathway” and the KEGG “p53 signaling pathway” gene sets are compared.
Fig. 10
Fig. 10
Comparative analyses of the hallmark “p53 pathway” with gene sets from the KEGG and GO BP. The gene sets with similarity with the hallmark “p53 pathway” gene set (50 genes) were searched from the KEGG and GO BP collections. (A) Gene set sizes are expressed in the bar plot (left). Orange, the overlapped genes; blue, non-overlapped genes. The Jaccard distance is provided in the middle. NES values are presented on the right side. The gene sets were sorted in the order of the Jaccard distance. (B) The FDR-NES plot of the 10 selected gene sets (left). The gene set is listed in increasing NES value order, and the corresponding NES value is provided on the right. (C) The distribution of log2FC values of individual genes. The 10 selected gene sets were examined. Each dot represents a mean log2FC value of an individual gene element. Gene sets are marked with the number along the y-axis. (D) The enrichment plots for the hallmark “p53 pathway” and the KEGG “p53 signaling pathway” gene sets are compared.

References

    1. Adnane J., Muro-Cacho C., Mathews L., Sebti S. M., Munoz-Antonia T. Suppression of rho B expression in invasive carcinoma from head and neck cancer patients. Clin. Cancer Res. 2002;8:2225–2232. - PubMed
    1. Ashburner M., Ball C. A., Blake J. A., Botstein D., Butler H., Cherry J. M., Davis A. P., Dolinski K., Dwight S. S., Eppig J. T., Harris M. A., Hill D. P., Issel-Tarver L., Kasarskis A., Lewis S., Matese J. C., Richardson J. E., Ringwald M., Rubin G. M., Sherlock G. Gene ontology: tool for the unification of biology. The Gene Ontology Consortium. Nat. Genet. 2000;25:25–29. doi: 10.1038/75556. - DOI - PMC - PubMed
    1. Carlson M. mouse4302.db: Affymetrix Mouse Genome 430 2.0 Array annotation data (chip mouse4302) R package version 3.2.3. 2016.
    1. Chen Z., Sun J., Pradines A., Favre G., Adnane J., Sebti S. M. Both farnesylated and geranylgeranylated RhoB inhibit malignant transformation and suppress human tumor growth in nude mice. J. Biol. Chem. 2000;275:17974–17978. doi: 10.1074/jbc.C000145200. - DOI - PubMed
    1. Cheng C., Seen D., Zheng C., Zeng R., Li E. Role of small GTPase RhoA in DNA damage response. Biomolecules. 2021;11:212. doi: 10.3390/biom11020212. - DOI - PMC - PubMed

LinkOut - more resources