. 2021 Aug 24;12(1):5086.
doi: 10.1038/s41467-021-25177-3.

Comprehensive characterization of 536 patient-derived xenograft models prioritizes candidatesfor targeted treatment

Collaborators, Affiliations

Comprehensive characterization of 536 patient-derived xenograft models prioritizes candidatesfor targeted treatment

Hua Sun et al. Nat Commun. .

Erratum in

  • Author Correction: Comprehensive characterization of 536 patient-derived xenograft models prioritizes candidates for targeted treatment.
    Sun H, Cao S, Mashl RJ, Mo CK, Zaccaria S, Wendl MC, Davies SR, Bailey MH, Primeau TM, Hoog J, Mudd JL, Dean DA 2nd, Patidar R, Chen L, Wyczalkowski MA, Jayasinghe RG, Rodrigues FM, Terekhanova NV, Li Y, Lim KH, Wang-Gillam A, Van Tine BA, Ma CX, Aft R, Fuh KC, Schwarz JK, Zevallos JP, Puram SV, Dipersio JF; NCI PDXNet Consortium; Davis-Dusenbery B, Ellis MJ, Lewis MT, Davies MA, Herlyn M, Fang B, Roth JA, Welm AL, Welm BE, Meric-Bernstam F, Chen F, Fields RC, Li S, Govindan R, Doroshow JH, Moscow JA, Evrard YA, Chuang JH, Raphael BJ, Ding L. Sun H, et al. Nat Commun. 2022 Jan 7;13(1):294. doi: 10.1038/s41467-021-27678-7. Nat Commun. 2022. PMID: 34996889 Free PMC article. No abstract available.

Abstract

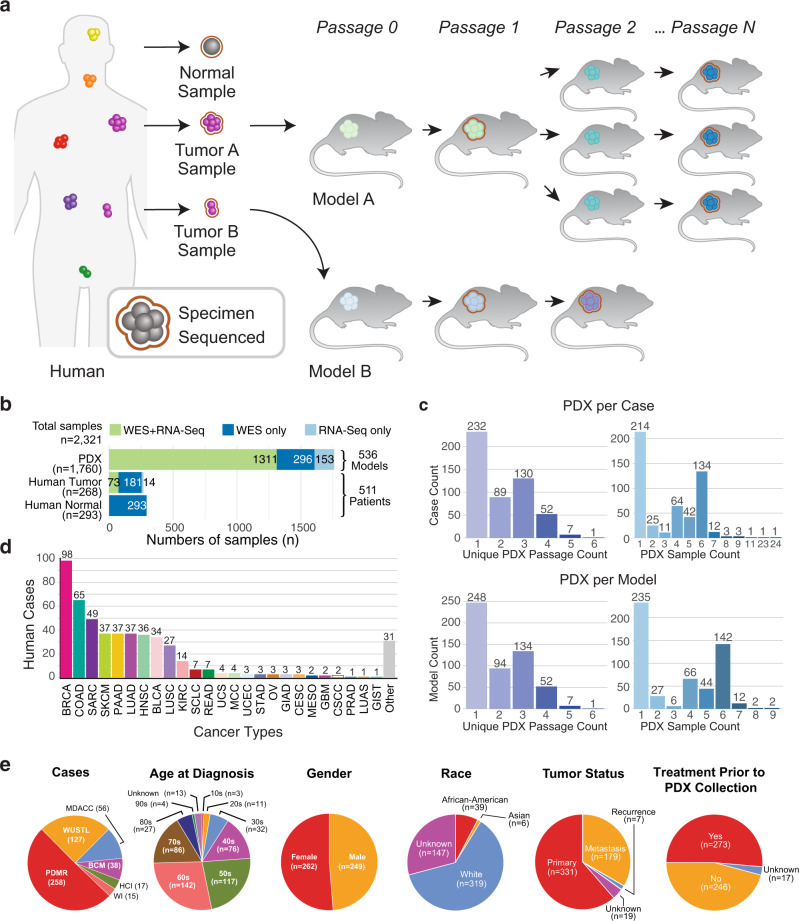
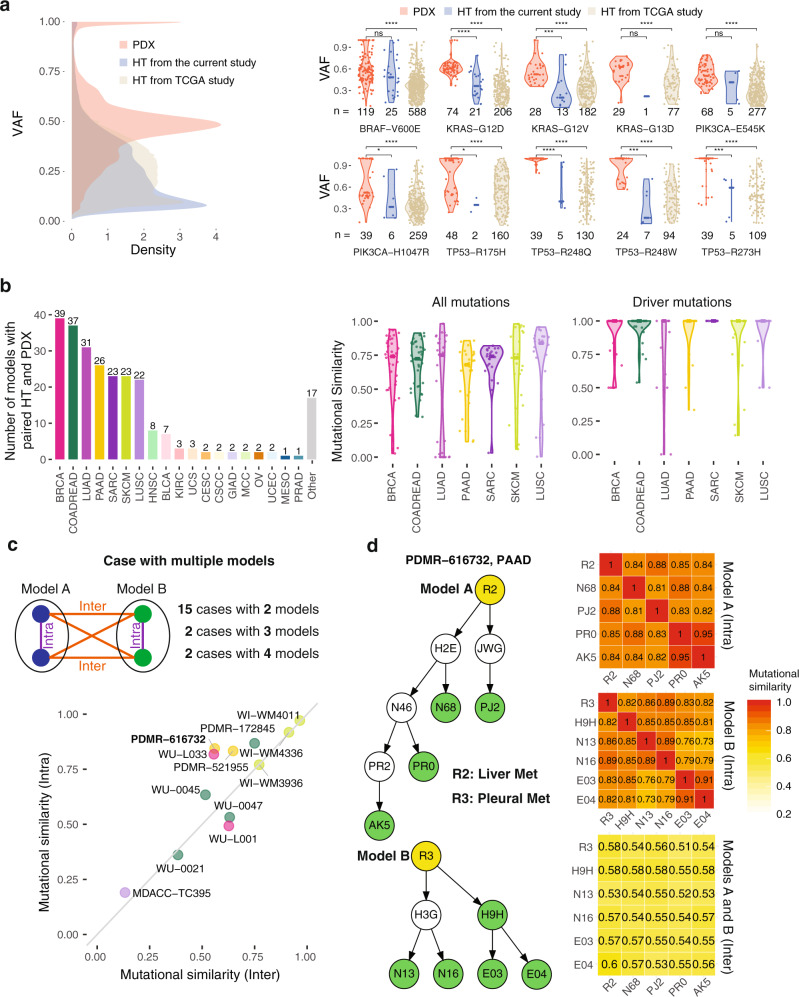
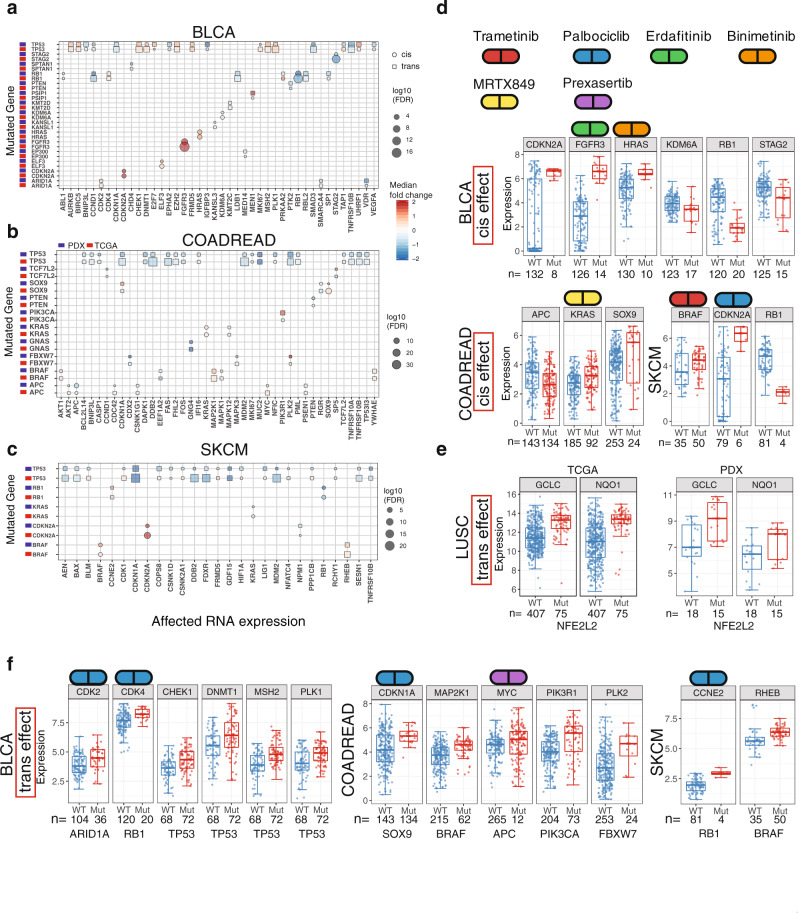
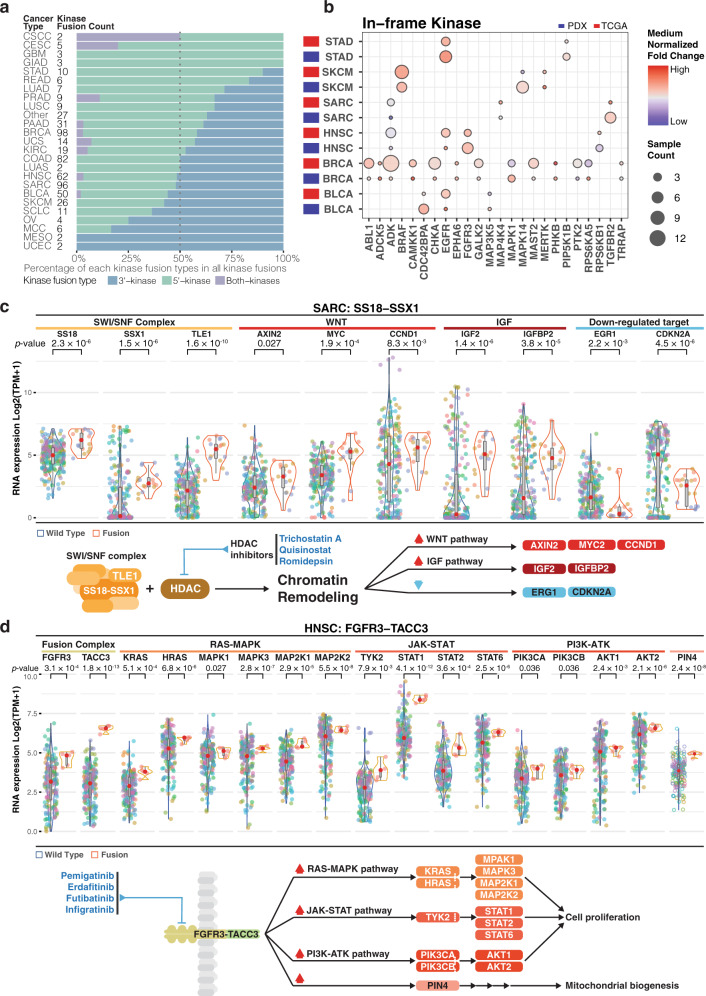
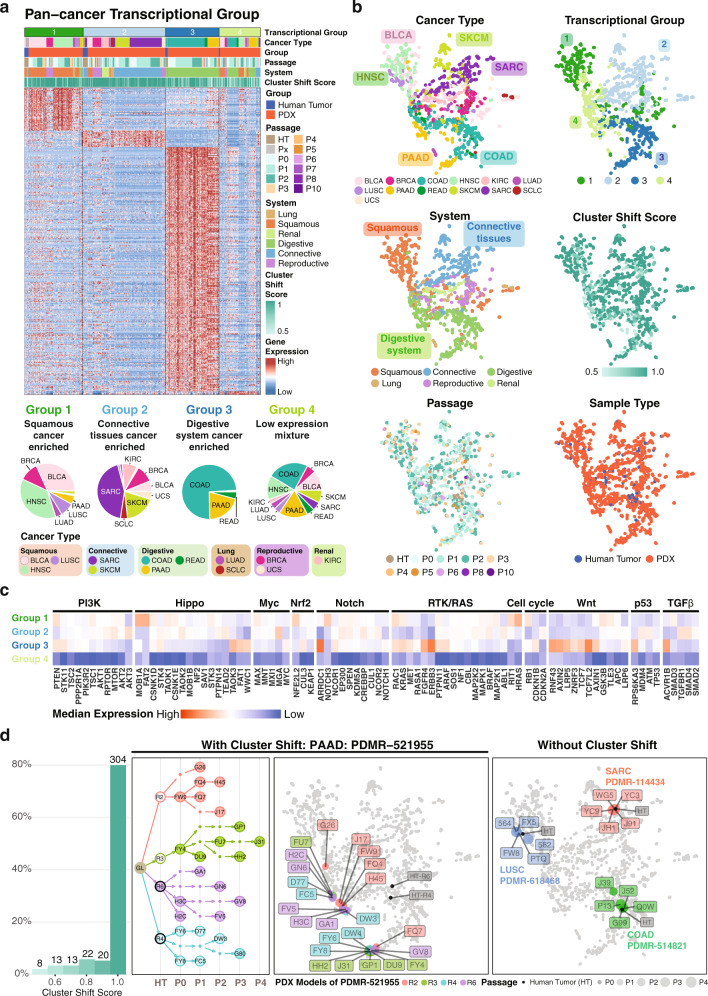
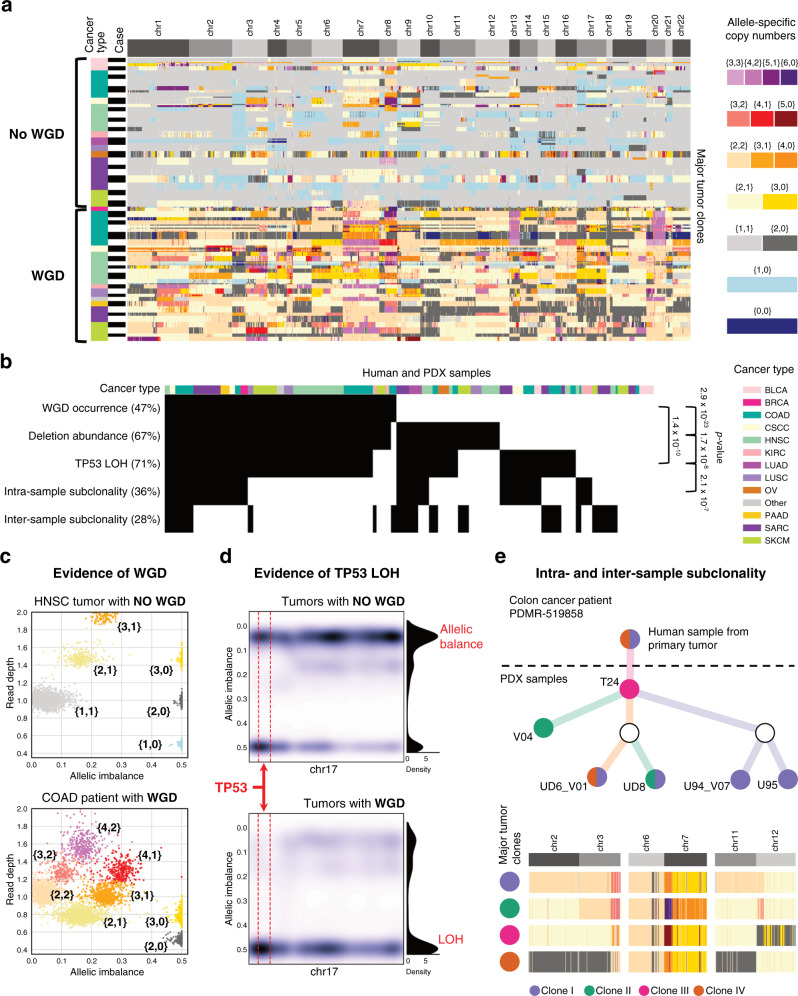
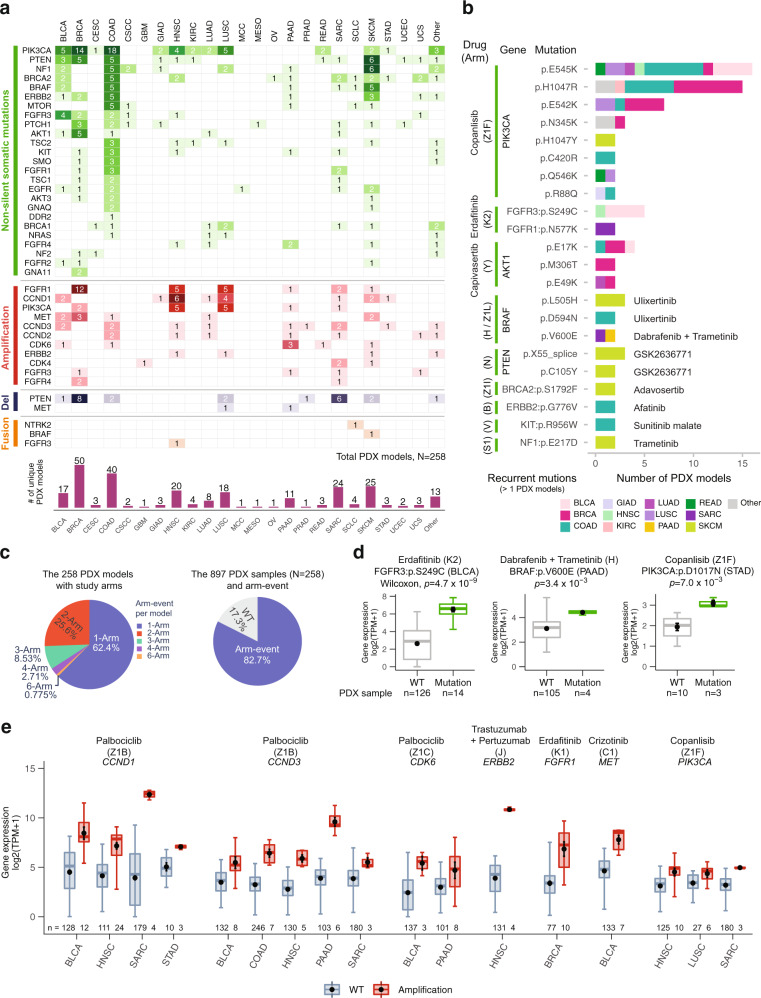
Development of candidate cancer treatments is a resource-intensive process, with the research community continuing to investigate options beyond static genomic characterization. Toward this goal, we have established the genomic landscapes of 536 patient-derived xenograft (PDX) models across 25 cancer types, together with mutation, copy number, fusion, transcriptomic profiles, and NCI-MATCH arms. Compared with human tumors, PDXs typically have higher purity and fit to investigate dynamic driver events and molecular properties via multiple time points from same case PDXs. Here, we report on dynamic genomic landscapes and pharmacogenomic associations, including associations between activating oncogenic events and drugs, correlations between whole-genome duplications and subclone events, and the potential PDX models for NCI-MATCH trials. Lastly, we provide a web portal having comprehensive pan-cancer PDX genomic profiles and source code to facilitate identification of more druggable events and further insights into PDXs' recapitulation of human tumors.


Conflict of interest statement

The University of Utah may choose to license PDX models developed in the Welm labs, which may result in tangible property royalties to Drs. Welm and members of their labs who developed the models. M.T.L. is a founder and limited partner in StemMed Ltd. and a manager in StemMed Holdings, its general partner. He is a founder and equity stakeholder in Tvardi Theraeutics Inc. Some PDXs are exclusively licensed to StemMed Ltd. resulting in royalty income to M.T.L. L.E.D. is a compensated employee of StemMed Ltd. The other authors declare no competing interests.

Figures

Fig. 1
Fig. 1. Data summary.
a Project schematic, showing a human image to represent multiple patients with different cancer diagnoses (pan-cancer). Tumor samples, implanted in mice to form PDX models, are propagated through a sequence of hosts, some of which provide specimens for next-generation sequencing and genomic analysis. b Sample types (left) and sequence data by assay (top) and associated counts of human cases and PDX models (right). c Distributions of cases according to the number of PDX passage indices (upper left) and PDX samples (upper right) in the lineage. Analogous distributions for PDX models (lower set) are also shown. d Distribution of cases by cancer type, following TCGA study abbreviations where possible. e Clinical features of cases (age at diagnosis, gender, self-reported race) and specimens (tumor status, treatment status), and PDTC source of sequence data. Key: PDTC, PDX Development and Trial Center; PDX, patient-derived xenograft; RNA-seq, RNA sequencing; TCGA, The Cancer Genome Atlas; WES, whole exome sequencing. Cancer type definitions in this work: BLCA, Bladder/urothelial carcinoma; BRCA, breast carcinoma; CESC, cervical carcinoma; COAD, colon adenocarcinoma; CSCC, cutaneous squamous cell carcinoma; GBM, glioblastoma multiforme; GIAD, gastrointestinal carcinoma, NOS; GIST, gastrointestinal stromal tumor; HNSC, head-and-neck squamous cell carcinoma; KIRC, kidney renal clear cell carcinoma; LUAD, lung adenocarcinoma; LUAS, lung adenosquamous carcinoma; LUSC, lung squamous cell carcinoma; MCC, Merkel cell tumor; MESO, mesothelioma; OV, ovarian carcinoma (epithelial or NOS); PAAD, pancreatic adenocarcinoma; PRAD, prostate carcinoma, NOS; READ, rectal adenocarcinoma; SARC, sarcoma; SCLC, small cell lung carcinoma; SKCM, skin cutaneous melanoma; STAD, stomach adenocarcinoma; UCEC, uterine corpus endometrial carcinoma; UCS, uterine carcinosarcoma. Source data are provided as a Source Data file.
Fig. 2
Fig. 2. The landscape of somatic mutations in human tumors and PDXs.
a Comparison of variant allele frequency (VAFs) for mutations between PDX and TCGA data. Number of samples (n) for each group is shown in the figure. b Number of patients with both human and PDX samples and the similarity of somatic mutations between them across different cancer types. c Mutational similarity among samples from different PDX models. d Schematics of tree plots of two PDX models from example case PDMR-616732 and the heatmap matrix of intra- and inter-mutational similarity. The mutational similarity quantifies the percentage of overlapping mutations between two samples. In a., we use two-sided Wilcoxon rank-sum test for calculating p values, where *, **, ***, and **** stand for p-value < 0.05, < 0.01, < 0.001, and < 0.0001 respectively. Source data are provided as a Source Data file.
Fig. 3
Fig. 3. Cis and trans effect of driver mutations on gene expression.
ac Cis and trans effect of driver mutations on RNA expression from TCGA tumors and PDXs on three different cancer types: bladder (BLCA), colorectal (COADREAD), and skin cutaneous melanoma (SKCM). Boxplots for the cis effect (d) and trans effect (e, f) of key driver genes on gene expression. Number of samples (n) for each group is shown in the figure. The box boundary of each box plot indicates third quartile and first quartile respectively from the top to bottom. The whisker on top were drawn out from the third quartile to the largest data point or up to 1.5 × IQR. Similarly, the bottom whisker extends from the first quartile down to 1.5 × IQR or the lowest data point. The red dot at the center indicates medium. Source data are provided as a Source Data file.
Fig. 4
Fig. 4. Fusion events in pan-cancer.
a Distribution of kinase fusion type based on kinase location (5′, 3′ and both kinases fusion) per cancer type (Fusion count: kinase fusion events detected in each PDX model. Kinase fusion percentage: kinase fusion count/total detected fusions). b Median normalized expression of fusion involving kinase per cancer type. Fusion in greater than 2 PDX samples while overlap with TCGA events are shown (Sample count: independent PDX sample). c, d Expression of genes in fusions and those significantly altered (Wilcoxon test, p < 0.05) in the downstream pathways for respectively (c) SS18-SSX1 in sarcoma (SARC) and (d) FGFR3-TACC3 in head and neck squamous cell carcinoma (HNSC). The diagram below illustrates the simplified mechanism and pathway for given fusion. Potential treatment intervention labeled in blue texts. Dot color indicates samples from the same patient case. The diagram below illustrates the simplified mechanism and pathway for given fusion. Potential treatment intervention labeled in blue texts. The box boundary of each box plot indicates third quartile and first quartile respectively from the top to bottom. The whisker on top were drawn out from the third quartile to the largest data point or up to 1.5 × IQR. Similarly, the bottom whisker extends from the first quartile down to 1.5 × IQR or the lowest data point. The red dot at the center indicates medium. P-values were calculated using two-sided Wilcoxon rank-sum tests. Source data are provided as a Source Data file.
Fig. 5
Fig. 5. Pan-cancer transcriptional groups.
a Top panel is four major pan-cancer transcriptional groups (limegreen, skyblue, oceanblue, and light olive) identified from the expression of significant positive differentially expressed genes (FDR > 0.05, fold change > 1) of each transcriptional group in cancer types with sample size greater than 20. Those include Bladder Urothelial Carcinoma (BLCA), Breast invasive carcinoma (BRCA), Colon adenocarcinoma (COAD), Head and Neck squamous cell carcinoma (HNSC), Kidney renal clear cell carcinoma (KIRC), Lung adenocarcinoma (LUAD), Lung squamous cell carcinoma (LUSC), Pancreatic adenocarcinoma (PAAD), Rectum adenocarcinoma (READ), Sarcoma (SARC), Small cell lung cancer (SCLC), Skin Cutaneous Melanoma (SKCM), Uterine Carcinosarcoma (UCS). The heatmap shows differentially expressed genes (DEGs) from each group. Bottom panel is the ratio of each cancer type in each transcriptional group. b Dimension reduction UMAP 2D-plots using 1000 most variable genes. Each point represents one sample. Colors in each panel indicate respectively cancer type, transcriptional group, system, cluster shift score, passage, and sample type of each sample. c Normalized medium expression of genes in major oncogenic pathways. d First panel is the distribution of cluster shift score. Second and third panel are the pedigree tree and the 2D distribution of case PMDR-521955. Each color (light coral, yellow green, purple, and light teal) indicates one PDX model originated from the same hurman tumor sample. In the second panel, filled circles are human samples with RNA-Seq data. Hollow circle and dot are human and PDX sample without data. Fourth panel is an example of PDX models without cluster shift. Each color (red, blue, and green) indicates samples from one PDX model. Source data are provided as a Source Data file.
Fig. 6
Fig. 6. Extensive presence of WGDs and subclonality correlates with abundance of deletions and TP53 LOH.
a Allele-specific CNAs of major tumor clones and presence/absence of WGD are inferred for 270 human and PDX samples from 54 cases of different cancer types. b Presence of WGD, deletion abundance, LOH of gene TP53, intra- and inter-sample subclonality are indicated (black) across all samples and significant correlations between pairs of these features are reported on the right side (p-values are computed from Pearson’s chi-squared statistic). c The absence/presence of a WGD (top/bottom) are supported by the presence of low/high numbers of distinct clusters of genomic regions (each point corresponds to a 250 kb genomic bin and is colored according to the corresponding allele-specific CNAs using the same color legend as in a) with different values of allelic balance and read depth in two PDX samples from two HNSC and COAD patients. d A kernel density estimate of the allelic balance is computed for all samples without (top) or with (bottom) a WGD across 250 kb bins of chromosome 17 (whole-chromosome density is shown on the right side) and in a 6 Mb genomic region surrounding gene TP53 (dashed red lines). e For a colon cancer (COAD) patient, a tree represents the relationships between the corresponding human and PDX samples (nodes), which contain four major tumor clones (violet, green, magenta, and dark orange) with different CNAs (bottom with allele-specific CNAs colored as in a). Source data are provided as a Source Data file.
Fig. 7
Fig. 7. NCI-MATCH trial related druggable genes and recurrent alterations.
a Genomic alterations of 258 candidate PDX models, which satisfied the study arm specifications across 23 cancer types, include the 25 target genes of non-silent mutations, 13 copy number alteration genes, and 3 fusion genes. b Distribution of 22 recurrent point mutations (> 1 PDX models) in the 10 druggable target genes with 9 drugs across 12 cancer types. The information in parentheses is a matched study arm. c Distribution of target arms per PDX model and positive signal arms in PDX samples. The left pie chart presents the distribution of PDX models in single-arm and multiple-arm (>1 arms). The right chart shows the percentage of PDX models between wild type and arm-event. d, e Target drugs and target gene alterations that are associated with gene expression (N, number of independent PDX models; n, number of independent PDX samples). d The point mutations of target arms that relate to upregulation of gene expression in cancer. e The amplification-related target arms match with upregulation of gene expression in different cancer types (n, number of PDX samples). And gene expressions are significantly different (absolute value of log2-fold-change > 0.585 and p < 0.05) between wild-type (WT) and amplification. In d and e data are presented as box plots where the middle line is the median, the largest value at the end of the upper whisker is the maximum, and the smallest value at the end of the lower whisker is the minimum. The black dot with error bar is mean ± SEM in box plots. The p-values are calculated by a two-sided Wilcoxon rank sum test in R. Source data are provided as a Source Data file.

References

    1. Dobrolecki LE, et al. Patient-derived xenograft (PDX) models in basic and translational breast cancer research. Cancer Metastasis Rev. 2016;35:547–573. - PMC - PubMed
    1. Jung J, Seol HS, Chang S. The generation and application of patient-derived xenograft model for cancer research. Cancer Res Treat. 2018;50:1–10. - PMC - PubMed
    1. Tuveson D, Clevers H. Cancer modeling meets human organoid technology. Science. 2019;364:952–955. - PubMed
    1. Hynds R. E., Vladimirou E., Janes S. M. The secret lives of cancer cell lines. Dis. Model Mech.11, 1–5 (2018). - PMC - PubMed
    1. Hidalgo M, et al. Patient-derived xenograft models: an emerging platform for translational cancer research. Cancer Disco. 2014;4:998–1013. - PMC - PubMed

Publication types