. 2021 Aug 24;12(1):5103.
doi: 10.1038/s41467-021-25354-4.

Dysregulated cholesterol homeostasis results in resistance to ferroptosis increasing tumorigenicity and metastasis in cancer

Affiliations

Dysregulated cholesterol homeostasis results in resistance to ferroptosis increasing tumorigenicity and metastasis in cancer

Wen Liu et al. Nat Commun. .

Abstract

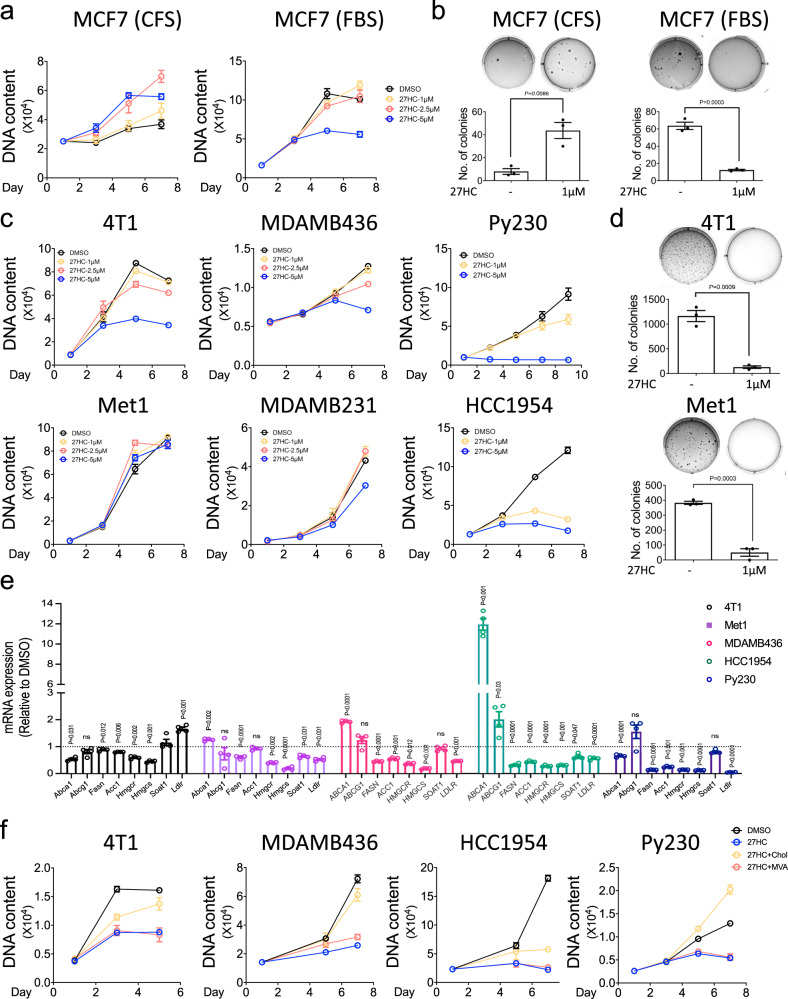
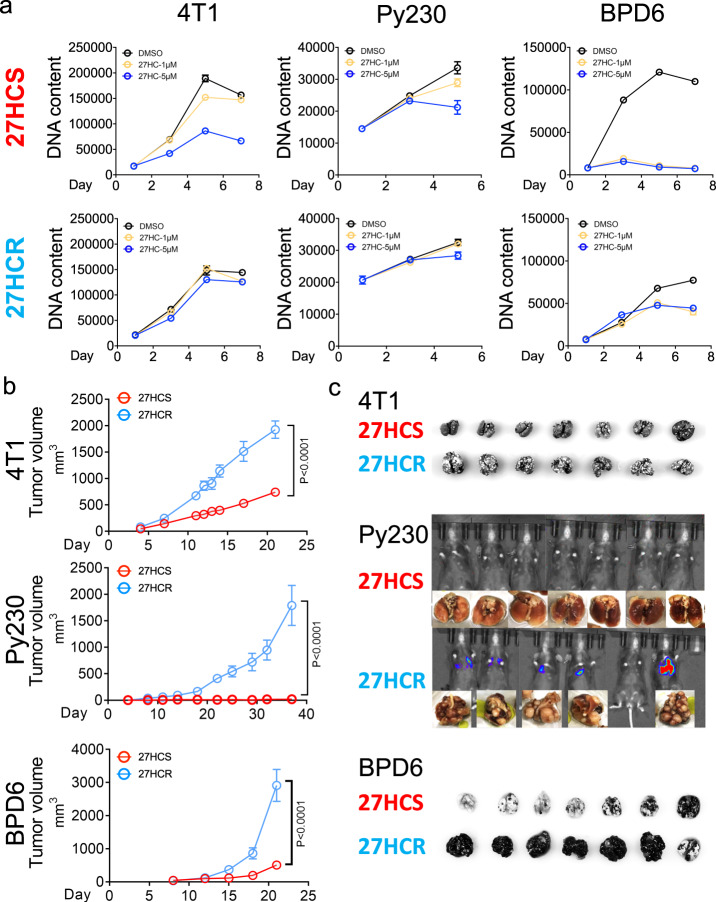
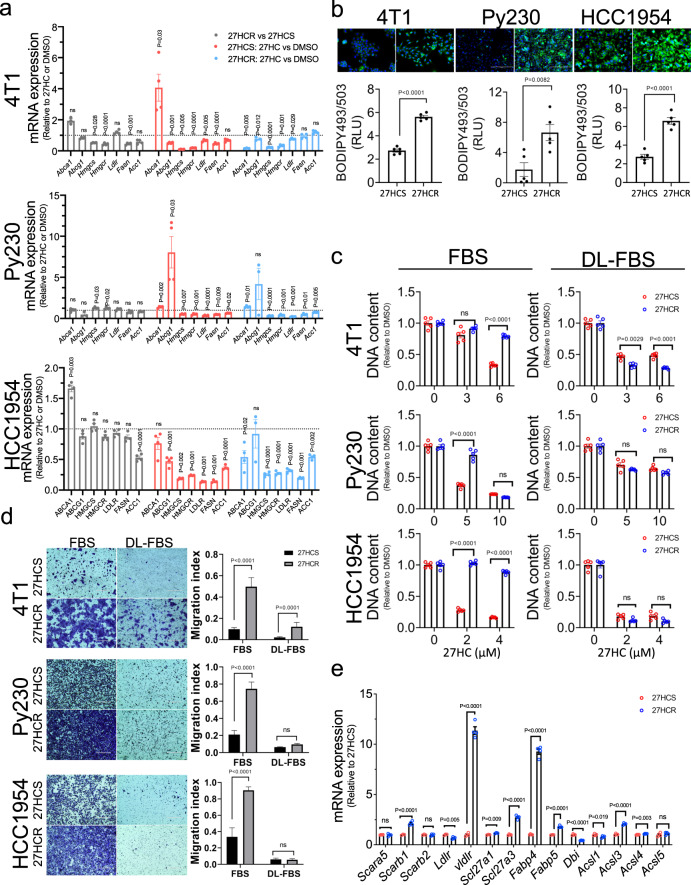
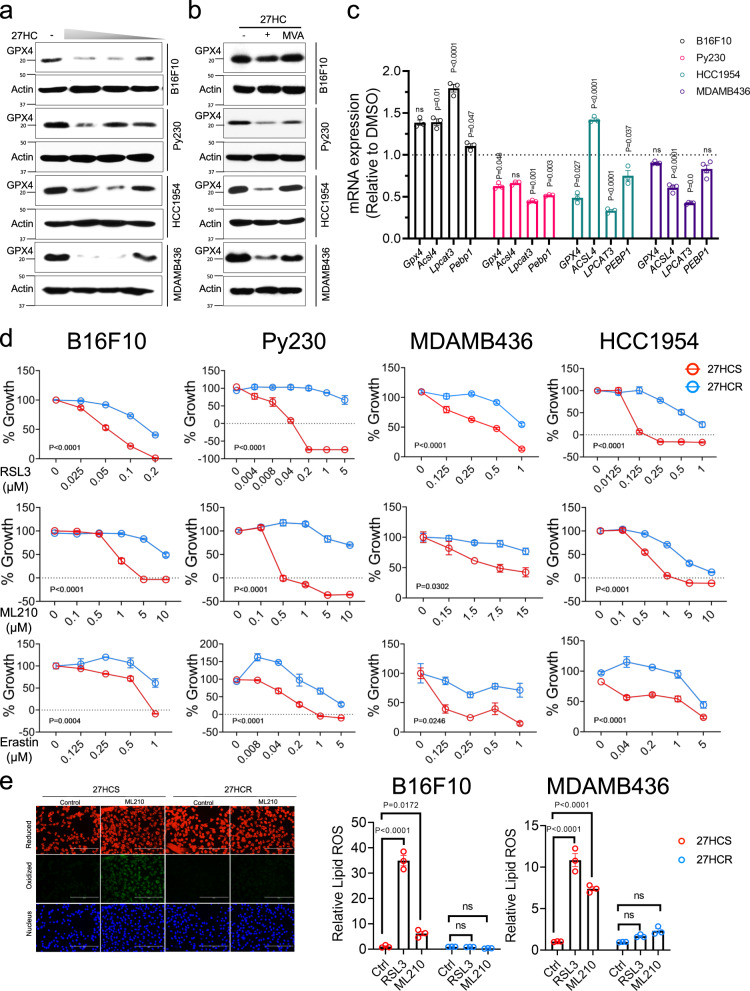
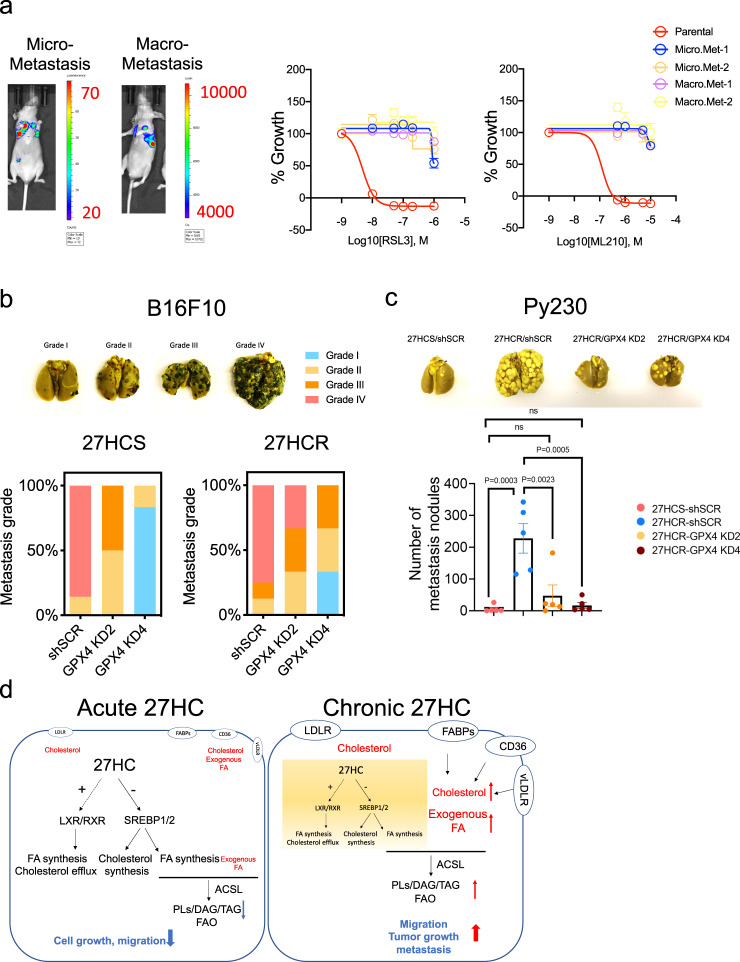
Hypercholesterolemia and dyslipidemia are associated with an increased risk for many cancer types and with poor outcomes in patients with established disease. Whereas the mechanisms by which this occurs are multifactorial we determine that chronic exposure of cells to 27-hydroxycholesterol (27HC), an abundant circulating cholesterol metabolite, selects for cells that exhibit increased cellular uptake and/or lipid biosynthesis. These cells exhibit substantially increased tumorigenic and metastatic capacity. Notably, the metabolic stress imposed upon cells by the accumulated lipids requires sustained expression of GPX4, a negative regulator of ferroptotic cell death. We show that resistance to ferroptosis is a feature of metastatic cells and further demonstrate that GPX4 knockdown attenuates the enhanced tumorigenic and metastatic activity of 27HC resistant cells. These findings highlight the general importance of ferroptosis in tumor growth and metastasis and suggest that dyslipidemia/hypercholesterolemia impacts cancer pathogenesis by selecting for cells that are resistant to ferroptotic cell death.


Conflict of interest statement

The authors declare no competing interests.

Figures

Fig. 1
Fig. 1. 27HC inhibits the growth of ER-negative breast cancer cells.
a ER-positive MCF7 cells were plated in charcoal stripped serum (CFS, left) and complete (FBS, right) media, followed by treatment with the indicated doses of 27HC. Cells were then harvested at different time points and cell growth was assessed by measuring DNA content using Hoechst 33258. b MCF7 cells were seeded in 6-well plates in soft agar mixed with media containing stripped (CFS, left) and complete serum (FBS, right), followed by the treatment with vehicle (0.1% DMSO) or 27HC (1 µM), and incubated for 3 weeks. Colonies were stained with crystal violet. The graph represents the number of colonies growing in soft agar per well. c Time-dependent cell growth curves of various ER-negative breast cancer cells (4T1, Met1, MDAMB436, MDAMB231, Py230, and HCC1954) treated with indicated concentrations of 27HC. d Soft agar assay showing that 27HC (1 µM) inhibits the colony formation of 4T1 and Met1. e qRT-PCR analysis of the mRNA expression levels of LXR, SREBP1c, and SREBP2 (genes involved in lipid metabolism) from 4T1, Met1, MDAMB436, HCC1954, and Py230 cells treated with 27HC (5 µM) for 24–72 h. f Supplementation with cholesterol (Chol, 10 µM) but not mevalonate (MVA, 500 µM) reversed the antiproliferative effects of 27HC (5 µM) in 4T1, MDAMB436, HCC1954, and Py230 cells. Data are plotted as mean ± SEM as representative results from two to four independent experiments (except Fig. 1b which was performed a single time); n = 5 wells of cells (a, c, and f); n = 3 wells of cells b and d; n = 4 wells of cells e. P values were calculated using two-sided unpaired Student’s t test b, d, and e. Numerical source data are reported in the Supplementary Data 1 and in the Source Data File.
Fig. 2
Fig. 2. Chronic exposure to 27HC selects for cells with increased malignant phenotypes.
a ER-negative cancer cells were treated with 0.1% DMSO or 27HC (5 µM) for 1–4 months. Emergent cells are resistant to the antiproliferative effects of 27HC. Representative data from 4T1 (left), Py230 (middle), and BPD6 (right) cancer models are shown. Data plotted as mean ± SEM as representative results from three independent experiments, n = 5 wells of cells. b Xenograft tumors from 27HCS and 27HCR cells in 4T1 (upper), Py230 (middle), and BPD6 (lower) in syngeneic mouse models. (4T1-27HCS, n = 8 mice; 4T1-27HCR, n = 8 mice; Py230-27HCS, n = 6 mice; Py230-27HCR, n = 8 mice; BPD6-27HCS, n = 8 mice; BPD6-27HCR, n = 8 mice), Data plotted are mean ± SEM, P values were calculated using two-way ANOVA. c Lung metastasis from 27HCS- and 27HCR cells in 4T1 (upper), Py230 (middle), and BPD6 (lower) intravenously injected in syngeneic mouse models. Mice were euthanized on Day 21 (4T1), Day 78 (Py230), and Day 20 (BPD6), respectively. Numerical source data are reported in the Source Data File.
Fig. 3
Fig. 3. Increased lipid uptake is a feature of cells resistant to the antiproliferative actions of 27HC.
a qRT-PCR profiling of the expression of select genes involved in lipid metabolism in 27HCS and 27HCR cells treated with 0.1% DMSO or 27HC (5 µM) for 24–72 h. Representative data from 4T1, Py230, and HCC1954 cancer models are shown. Data are plotted as mean ± SEM as representative results from two (HCC1954), four (Py230), and one (4T1) independent experiments, n = 4 wells of cells. b Lipid droplet content in 27HCS and 27HCR derivitives of 4T1, Py230, and HCC1954 cells were visualized using BODIPY 493/503 staining. Data are plotted as mean ± SEM as representative results from three independent experiments, n = 5 wells of cells c 27HCS and 27HCR derivatives of 4T1, Py230, and HCC1954 cells were cultured in lipid-rich (FBS) and lipid-depleted (DL-FBS) serum-containing media and treated with 0.1% DMSO or 27HC at indicated doses, followed by assessment of cell growth. Data are plotted as mean ± SEM as representative results from three independent experiments, n = 5 wells of cells d Migration assays performed using 27HCSand 27HCR derivatives of 4T1, Py230, and HCC1954 cells cultured in lipid-rich (FBS) and lipid-depleted (DL-FBS) serum-containing media. Data are plotted as mean ± SEM; n = 8-20 random fields measurements from a total of three transwell chambers. e qRT-PCR analysis of the mRNA expression levels of genes involved in lipid uptake and trafficking in 27HCS and 27HCR derivatives of 4T1, Py230, and HCC1954 cells. Representative results from Py230 cells are shown, and results for other cell lines are shown in Supplementary Data 4. Data are plotted as mean ± SEM as representative results from two (4T1 and HCC1954) and eight (Py230) independent experiments; n = 4 wells of cells; P values were calculated using a two-sided unpaired Student’s t test a, b, and e and one-way ANOVA with Tukey’s post hoc test c and d. Numerical source data are reported in the Supplementary Data 2 and in the Source Data File.
Fig. 4
Fig. 4. 27HCR cells are resistant to ferroptosis.
a B16F10, Py230, HCC1954, and MDAMB436 cells were treated with various doses of 27HC for 48 hr. Cell lysates were harvested, and western immunoblots were used to analyze GPX4 expression levels. β-Actin was used as a loading control. Representative results from two independent experiments are shown. b mevalonate (MVA, 500 µM) supplementation reversed 27HC-dependent inhibition of GPX4 protein expression in B16F10, Py230, MDAMB436, and HCC1954 cells. Representative results from three independent experiments are shown. c qRT-PCR analysis of the expression of genes involved in lipid peroxidation (GPX4, Acsl4, Lpcat3, and Pebp1) in 27HCS and 27HCR cells. Data plotted as mean ± SEM (n = 3 wells of cells for B16F10, Py230, and HCC1954; n = 4 wells of cells for MDAMB436). P values were calculated using two-sided unpaired Student’s t test. d 27HCS and 27HCR derivatives of B16F10, Py230, HCC1954, and MDAMB436 cells were treated with inducers of ferroptosis, including GPX4 inhibitors, RSL3 (upper), and ML210 (middle), and the xc- inhibitor, erastin (lower) and 0.1% DMSO control. Morphology of ferroptotic cell death such as cells rounding up and plasma membrane rupture were observed in treated cells. Cell growth was assessed after 48–72 h by measuring DNA content using Hoechst 33258. Relative cell growth (% of Growth) was then calculated by normalizing each treatment condition to control-treated wells. Data plotted as mean ± SEM as representative results from four independent experiments (n = 5 wells of cells for B16F10, MDAMB436, and HCC1954; n = 3 wells of cells for Py230). P values were calculated using two-way ANOVA. e RSL3 (1 µM) and ML210 (5 µM) induced lipid peroxidation in 27HCS and 27HCR-detivatives of B16F10 and -MDAMB436 cells as measured by BODIPY-C11 staining. Fluorescent images of BODIPY-C11 stained B16F10 cells treated with ML210 for 4 h are shown in the left panels. Data plotted as mean ± SEM; n = 3 wells of cells. P values were calculated using one-way ANOVA. Figure 4e results were repeated in Py230 cells. Unprocessed immunoblots and numerical source data are reported in the Source Data File.
Fig. 5
Fig. 5. GPX4 inhibition sensitizes 27HCR cells to ferroptosis and reduces their metastatic capability.
a A total of 2 × 105 luciferase labeled Py230-27HCS and -27HCR cells were injected intravenously into nude or C57/BL6 mice. After 2 months, Py230-27HCS cells developed micrometastasis and Py230-27HCR cells formed overt macrometastasis. Bioluminescent images of lung metastasis as shown in the left panels. Metastatic tumor cells were then recovered from lungs and propagated as cell lines (Micrometastasis: Micro. Met1 and 2 and Macrometastasis: Macro Met1 and 2). Py230 parental and lung metastasis derivative cell lines were treated with GPX4 inhibitors, RSL3 (middle), and ML210 (right) for 48 h, followed by cell proliferation assay. Relative cell growth (% of Growth) was calculated by normalizing each treatment condition to control-treated wells. Data plotted as mean ± SEM from five technical replicates. b 2 × 105 GPX4 wild-type (shSCR) and knockdown (KD2 and KD4) B16F10-27HCS and -27HCR cells were injected intravenously into C57BL/6 mice (n = 5 mice). Lung metastases were graded and scored when mice were euthanized on Day 16. Representative images of lung tissue used for grading are shown in the upper panel. c 3 × 105 GPX4 wild-type (shSCR) and knockdown (KD2 and KD4) Py230-27HCR cells, as well as GPX4 wild-type (shSCR) Py230-27HCS cells were injected intravenously into C57BL/6 mice (n = 5 mice). Lung metastases were quantified when mice were euthanized on Day 40. Representative lung images are shown in the upper inset. Data plotted as mean ± SEM; P values were calculated using two-way ANOVA. d The proposed model to explain how cancer cells respond to 27HC treatment. Acute (left) treatment with 27HC disrupts lipid metabolism via interfering with SREBPs and LXR signaling, and this results in the inhibition of cell growth and migration. Cancer cells can adapt to the metabolic stress imposed by chronic treatment by 27HC (right). The cells that survive (27HC resistant cells) increase lipid uptake and accommodate the metabolic stress associated with this activity by upregulating the activity of processes that allow them to withstand lipid oxidative stress (ferroptosis); an activity which confers upon them enhanced tumor growth and metastatic capabilities. Numerical source data are reported in the Source Data File.

References

    1. Vrieling A, Buck K, Kaaks R, Chang-Claude J. Adult weight gain in relation to breast cancer risk by estrogen and progesterone receptor status: a meta-analysis. Breast Cancer Res. Treat. 2010;123:641–649. doi: 10.1007/s10549-010-1116-4. - DOI - PubMed
    1. Jiralerspong S, et al. Obesity, diabetes, and survival outcomes in a large cohort of early-stage breast cancer patients. Ann. Oncol. 2013;24:2506–2514. doi: 10.1093/annonc/mdt224. - DOI - PMC - PubMed
    1. Danilo C, Frank PG. Cholesterol and breast cancer development. Curr. Opin. Pharm. 2012;12:677–682. doi: 10.1016/j.coph.2012.07.009. - DOI - PubMed
    1. Kucharska-Newton AM, et al. HDL-cholesterol and incidence of breast cancer in the ARIC cohort study. Ann. Epidemiol. 2008;18:671–677. doi: 10.1016/j.annepidem.2008.06.006. - DOI - PMC - PubMed
    1. Silvente-Poirot S, Poirot M. Cancer. Cholest. Cancer, Balance Sci. 2014;343:1445–1446. - PubMed

Publication types

MeSH terms