. 2021 Aug 24;11(1):17099.
doi: 10.1038/s41598-021-96355-y.

Evaluation of a mechanical lung model to test small animal whole body plethysmography

Affiliations

Evaluation of a mechanical lung model to test small animal whole body plethysmography

Swen Hülsmann et al. Sci Rep. .

Abstract

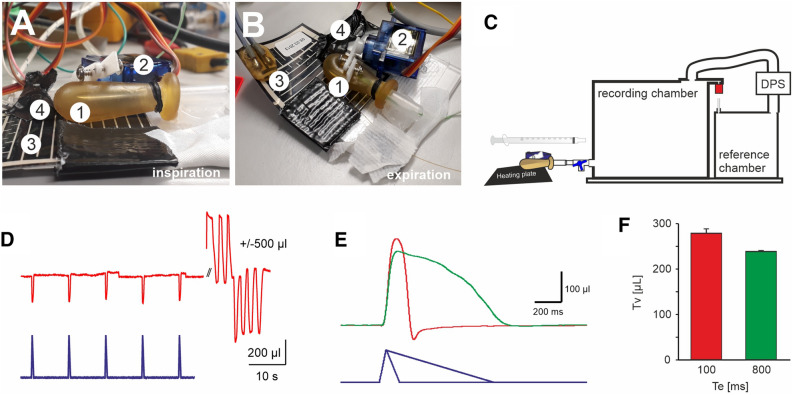
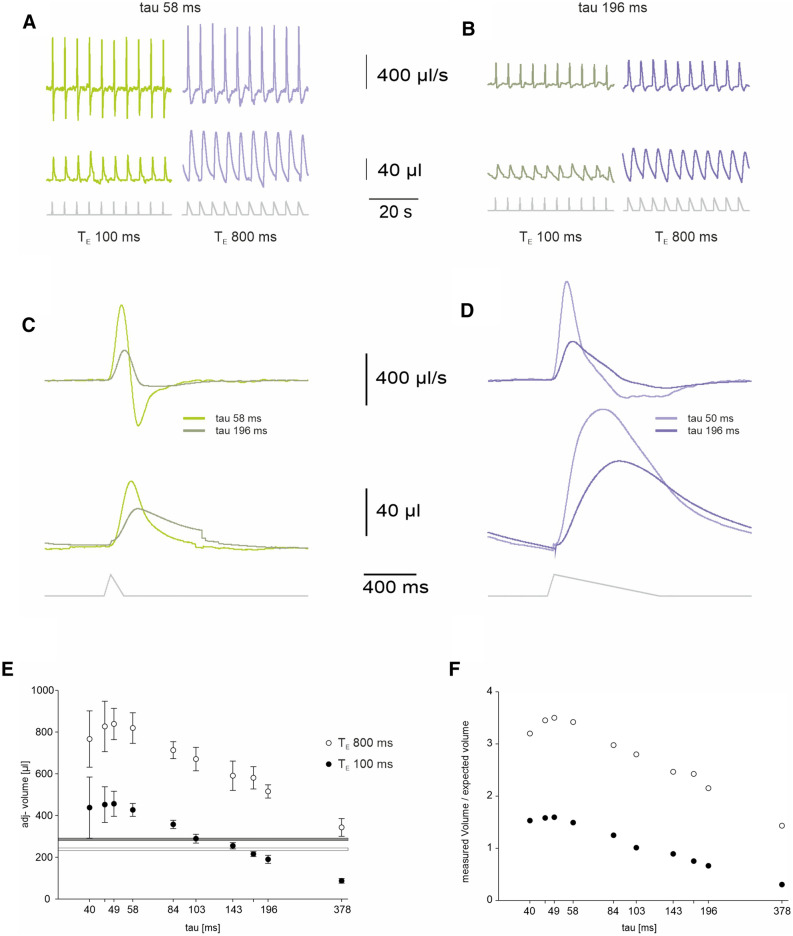
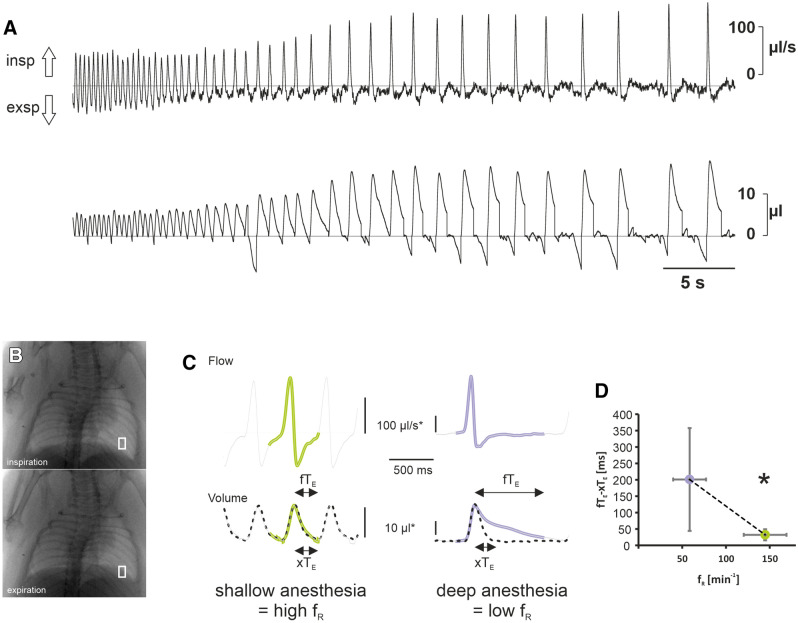
Whole-body plethysmography (WBP) is an established method to determine physiological parameters and pathophysiological alteration of breathing in animals and animal models of a variety of diseases. Although frequently used, there is ongoing debate about what exactly is measured by whole-body-plethysmography and how reliable the data derived from this method are. Here, we designed an artificial lung model that enables a thorough evaluation of different predictions about and around whole-body plethysmography. Using our lung model, we confirmed that during WBP two components contribute to the pressure changes detected in the chamber: (1) the increase in the pressure due to heating and moistening of the air during inspiration, termed conditioning; (2) changes in the chamber pressure that depend on airway resistance. Both components overlap and contribute to the temporal pressure-profile measured in the chamber or across the wall of the chamber, respectively. Our data showed that a precise measurement of the breathing volume appears to be hindered by at least two factors: (1) the unknown relative contribution of each of these two components; (2) not only the air in the inspired volume is conditioned during inspiration, but also air within the residual volume and dead space that is recruited during inspiration. Moreover, our data suggest that the expiratory negative pressure peak that is used to determine the enhanced pause (Penh) parameter is not a measure for airway resistance as such but rather a consequence of the animal's response to the airway resistance, using forced or active expiration to overcome the resistance by a higher thoracic pressure.


Conflict of interest statement

The authors declare no competing interests.

Figures

Figure 1
Figure 1
Measurement of the tidal volume (VT) that is exchanged during a “respiratory” cycle of the artificial lung model (ALM). (A,B) Design of the ALM. (A) Lateral view of the ALM in inspiration (1) latex bulb, (2) servo motor with lever, (3) heating plate, (4) temperature sensor. (B) Top view of the ALM in expiration. (C) Schematic drawing of the experiment. To test the tidal volume of the ALM, it was connected to the plethysmography chamber. DPS = differential pressure sensor. (D) Recording of 5 cycles. Each inspiration (TI 50 ms, TE 100 ms) leads to a reduction of the pressure in the chamber (red trace). Blue trace analog out control signal. The pressure changes were calibrated by injection and withdrawal of 500 µl of air using a 1 ml syringe attached to the same port. (E) Enlarged (inverted) view of the calibrated pressure change (volume) from a respiratory cycle of the ALM with TI 50 ms, TE 100 ms (red) and TI 50 ms, TE 800 ms (green). (F) Average data of the volume that is exchanged during one respiratory cycle.
Figure 2
Figure 2
Experimental testing of the ALM placed inside the plethysmography chamber. (A) Photograph of the lung dummy in the FWBP plethysmography chamber. Cables passing through the lid of the chamber, secured and sealed by polymer clay (1). (B) Different cut luer-lock cannulas were used to adjust the resistance of the ALM. (C) Schematic drawing of the chamber design. The flow through mode was used by applying constant suction of 150 ml/min to the outlet port (3) with a 3-way-valve. At the inlet port (4), the flow was limited by a defined resistance, a silicon tube (τ 58 ms). Pressure changes were recorded with a differential pressure sensor (DPS) between the recoding chamber and a reference chamber (2). (DF) Analysis of the effect of the different degrees of airway resistance. To mimic low airway resistance (D) no cannula was attached to “tracheal” opening of the dummy lung (5). To apply additional resistance either a cut 20G (yellow, E) or a cut 27G (white, F) cannula was attached to the luer adapter. (D) Chamber pressure (non-calibrated) in the no-resistance situation. The lower trace represents the analog control signal for the micro servo motor (TI 50 ms, TE 100 ms). Traces in red are from recordings with the heating plate turned on (40 °C; see Fig. 1) and the yellow trace with the heating plate off (26 °C). The chamber pressure follows the lever of the servo motor with a short delay (see also Fig. 4). Note that with no temperature added to the ALM, almost no pressure change is measured (yellow trace). (E,F) Effects of addition of airway resistance. (E) With the first resistance (20G) the pressure in the chamber changes already in the unheated dummy lung (26 °C), with an obvious difference between the signal at 40 °C (red) and 26 °C (yellow). Subtraction (blue trace) of the 26 °C signal from the 40 °C signal reveals the pressure change that is based on warming of the air during the breath. Interestingly, it almost equals the change when no resistance was used (dotted trace). (F) Using a larger resistance (27G), the pressure changes are increased, moreover the difference between the signal at 40 °C and 26 °C is not easy to appreciate anymore. However, subtraction (blue trace) of the 26 °C signal from the 40 °C signal reveals that the flow that is based on warming is still very similar. The gray trace (D) resembles the pressure curve shown in Fig. 1E.
Figure 3
Figure 3
The apparent tidal volume depends on the decay time constant (tau) of the FWBP chamber (A) Flow (upper trace) and volume trace from the ALM in a chamber with a pressure decay time constant (tau) of approximately 58 ms for two different durations of expiration (TE100 ms and TE800 ms). (B) Flow (upper trace) and volume trace from the ALM in a chamber with a pressure decay time constant (tau) of 196 ms for two different durations of expiration (TE 100 ms and TE 800 ms). (C) Comparison of the averaged flow (upper traces) and volume traces for respiratory cycles with TE 100 ms from the ALM in two chambers with different corner frequencies. Note that the faster time constant (τ = 58 ms) leads to a larger apparent tidal volume for both durations of expiration (TE 100 ms and TE 800 ms). (D) Comparison of the averaged flow (upper traces) and volume traces for respiratory cycles with TE 800. The faster τ (58 ms) leads to a larger apparent tidal volume. (E) The plot shows the adjusted tidal volume of the ALM in relation to the time constant of the chamber (tau [ms]). Filled circles are from respiratory cycle with TE 100 ms (TI 50 ms), open circles from T800ms cycles; error bars equal standard deviation. The gray bar represents the adjVolume from the volume calibration (Fig. 1) for TE 100 ms, the white bar the data for TE 800 ms (upper and lower edge of bar =  ± STD). (F) Comparison of the difference between measured adjTV and known TV of the ALM.
Figure 4
Figure 4
Flow whole-body plethysmography (FWBP) of the artificial lung model (ALM). (A) Two frames; inspiration (left) and expiration (right) from a video of the ALM during the FWBP taken at 240 Hz. Regions of interest (ROIs) were placed on the servo motor lever of the ALM (ROI1), on the bulb of the ALM (ROI2) and on the tip a light guide that allowed the synchronization with the plethysmography measurement (ROI3). (B) Timing of different parameters of the ALM with 50 ms duration of the inspiration (TI) and 100 ms expiration (TE). (1) Green trace analog out from the digitizer. The gray trace represents the inverted pressure measured in the bulb according to the measurement shown in Fig. 1. (2) PMT signal of the LED (3) that was driven from the analog out and was also the source for the light signal that was recorded by the video. Graphical overlay of the two signals allows exact matching of the signals from the video and the A/D interface (4) Intensity of the ROI1 from the servo motor lever indicating the response of the ALM. (5) Flow signal of the FWBP. (6) Intensity of the reflex from the bulb of the ALM. (7) Volume of the FWBP. (C) Timing of the FWBP-parameters (see B) from ALM recording with a TI of 50 ms and a TE of 800 ms. Traces are averages of at least 3 consecutive cycles.
Figure 5
Figure 5
Measurements in the closed chamber (pressure plethysmograph (PWBP)). (A) Schematic drawing of the chamber. (B) Raw volume traces from PWBP with the heating plate off; without resistance (green trace) and with a resistance attached to the ALM (blue trace) for TE 100 ms (right) and TE 800 ms. (C) Raw volume from the same ALM as in (B) with heating turned on. (D) Bar chart of the basic statistical data of the adjusted volumes. DPS = differential pressure sensor. Gray traces in (B) represent the pressure/volume curve of the ALM shown in Fig. 1E (a.u.).
Figure 6
Figure 6
Analysis of the enhanced pause (Penh) parameter. (A) Left traces show the flow signal form an ALM (heater on) with no additional resistance (Ti 50 ms and TE 100 ms). The gray curve represents the integral of the flow, which equals volume (normalized). (A’) same ALM as (A) with TE changed to 800 ms. (B,B’) Measurements as in (A,A’) with a 20G resistance. (C,C’) Measurements as in (A,A’) with a 27G resistance. The parameters for Penh are peak inspiratory flow (PIF); peak expiratory flow (PEF); expiratory time (Te), which equals the interval between peak of volume trace and beginning of next inspiration; time to expire 65% of the volume (Rt). In all experiments the respiratory rate was 0.5 s-1; traces are average data from 5 to 10 respiratory cycles.
Figure 7
Figure 7
Effect of isoflurane on airflow, tidal volume and XLF-based lung transparence. (A) Flow whole-body plethysmography (FWBP) trace from an anesthetized mouse. Inspiratory concentration of isoflurane was increased shortly before the recording started. Upper trace shows the flow, while the lower trace shows the integral of the flow over time, which represents the volume (both parameters were not corrected for humidity and temperature; see methods). (B) Example of X-ray-based lung function (XLF) images taken in inspiration and expiration. (C) Comparison of XLF-based X-ray transmission (dotted line) and FWBP-based flow (upper trace) and volume changes (lower trace) during shallow (green) and deep anesthesia (purple). (D) Comparison of the arithmetic differences of the duration of expiratory (TE) between FWBP (fTE) and XLF (xTE). Statistical analysis reveals a significant reduction in the difference (fTE-xTE [ms]) when the respiratory rate (fR) becomes faster (asterisk indicates significance p < 0.05; Mann–Whitney Rank Sum Test).

References

    1. Dullin C, et al. X-ray based lung function measurement-a sensitive technique to quantify lung function in allergic airway inflammation mouse models. Sci. Rep. 2016;6:36297. doi: 10.1038/srep36297. - DOI - PMC - PubMed
    1. Lim R, et al. Measuring respiratory function in mice using unrestrained whole-body plethysmography. J. Vis. Exp. 2014 doi: 10.3791/51755. - DOI - PMC - PubMed
    1. DeLorme MP, Moss OR. Pulmonary function assessment by whole-body plethysmography in restrained versus unrestrained mice. J. Pharmacol. Toxicol. Methods. 2002;47:1–10. doi: 10.1016/s1056-8719(02)00191-0. - DOI - PubMed
    1. Vondráková K, Hoven RVD, Hirt RA. Adenosine 5'-monophosphate aerosol challenge does not provoke airflow limitation in healthy cats. Acta Vet. Brno. 2006;75:329–336. doi: 10.2754/avb200675030329. - DOI
    1. Chao HT, et al. Dysfunction in GABA signalling mediates autism-like stereotypies and Rett syndrome phenotypes. Nature. 2010;468:263–269. doi: 10.1038/nature09582. - DOI - PMC - PubMed

Publication types