. 2021 Aug 24;11(1):16732.
doi: 10.1038/s41598-021-96167-0.

Intrinsic activation of β-catenin signaling by CRISPR/Cas9-mediated exon skipping contributes to immune evasion in hepatocellular carcinoma

Affiliations

Intrinsic activation of β-catenin signaling by CRISPR/Cas9-mediated exon skipping contributes to immune evasion in hepatocellular carcinoma

Masafumi Akasu et al. Sci Rep. .

Abstract

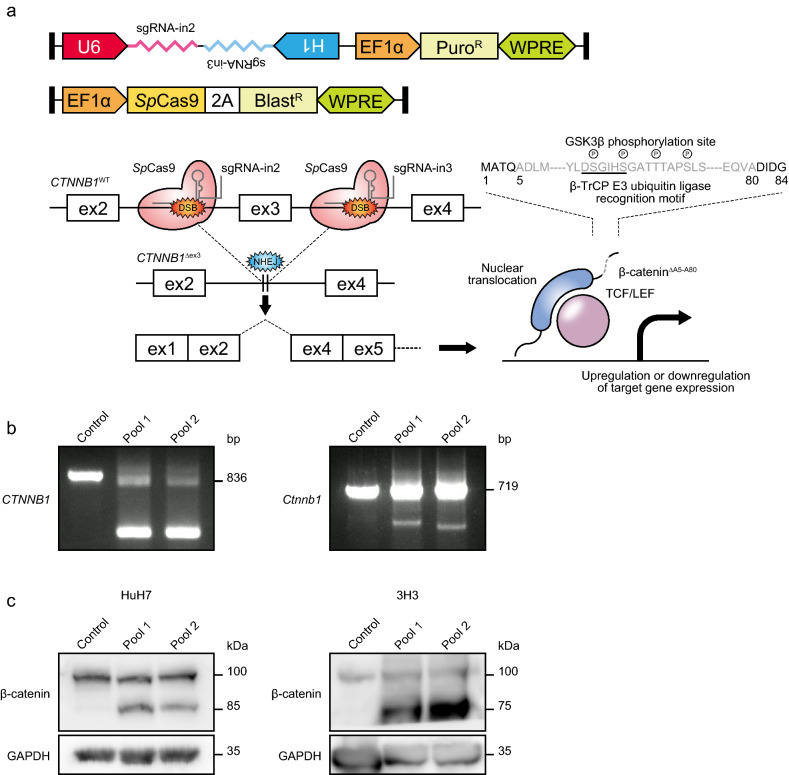
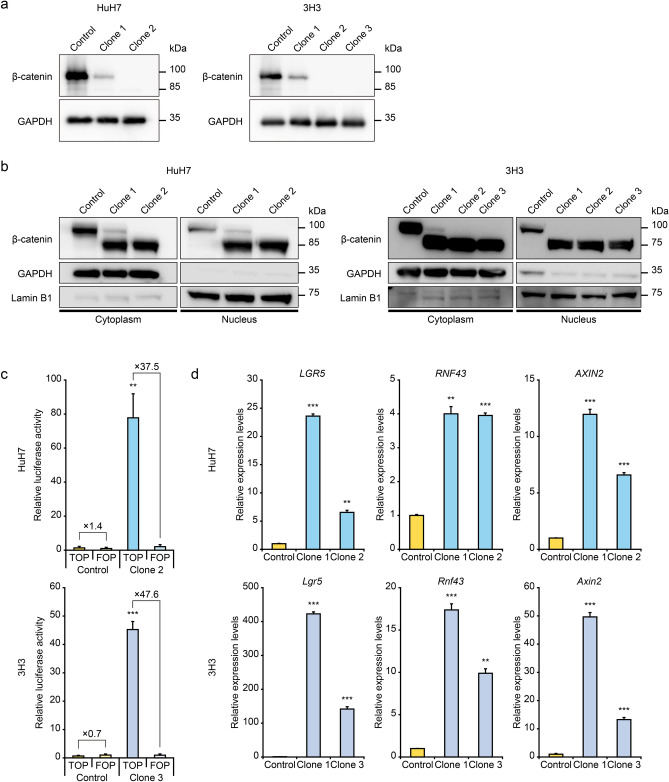
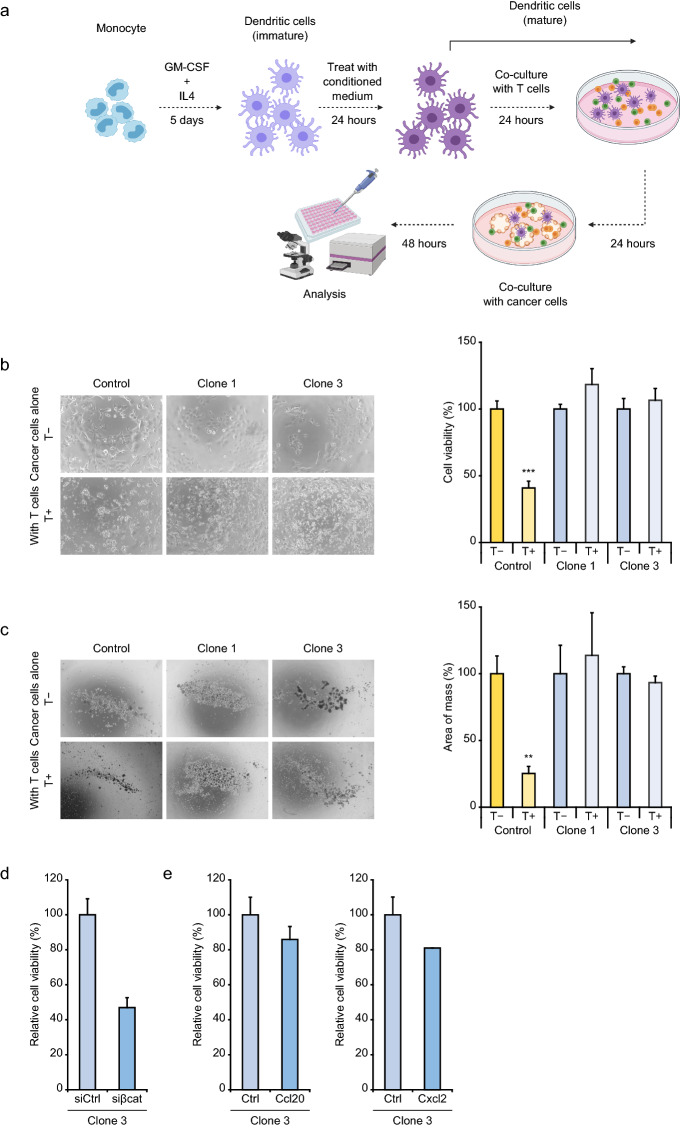
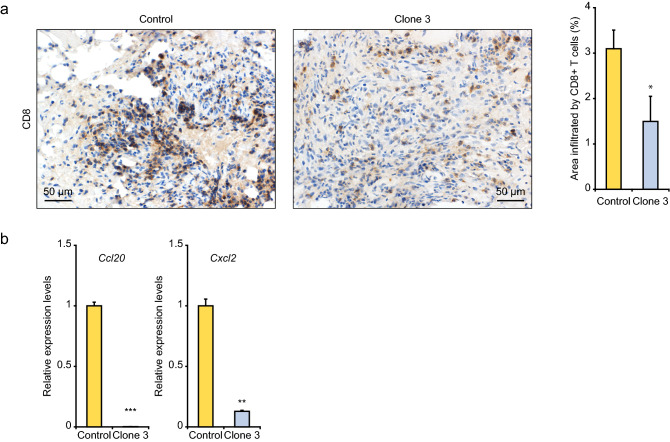
Comprehensive analysis of clinical samples has recently identified molecular and immunological classification of hepatocellular carcinoma (HCC), and the CTNNB1 (β-catenin)-mutated subtype exhibits distinctive characteristics of immunosuppressive tumor microenvironment. For clarifying the molecular mechanisms, we first established human and mouse HCC cells with exon 3 skipping of β-catenin, which promoted nuclear translocation and activated the Wnt/β-catenin signaling pathway, by using newly developed multiplex CRISPR/Cas9-based genome engineering system. Gene set enrichment analysis indicated downregulation of immune-associated gene sets in the HCC cells with activated β-catenin signaling. Comparative analysis of gene expression profiles between HCC cells harboring wild-type and exon 3 skipping β-catenin elucidated that the expression levels of four cytokines were commonly decreased in human and mouse β-catenin-mutated HCC cells. Public exome and transcriptome data of 373 human HCC samples showed significant downregulation of two candidate cytokine genes, CCL20 and CXCL2, in HCC tumors with β-catenin hotspot mutations. T cell killing assays and immunohistochemical analysis of grafted tumor tissues demonstrated that the mouse Ctnnb1Δex3 HCC cells evaded immunosurveillance. Taken together, this study discovered that cytokine controlled by β-catenin signaling activation could contribute to immune evasion, and provided novel insights into cancer immunotherapy for the β-catenin-mutated HCC subtype.


Conflict of interest statement

The authors declare no competing interests.

Figures

Figure 1
Figure 1
CRISPR/Cas9-mediated exon 3 skipping of β-catenin. (a) Schematic representation of exon 3 skipping of β-catenin (CTNNB1). (b,c) PCR and immunoblot analysis of β-catenin in human and mouse HCC cell lines, HuH7 and 3H3. The expected PCR product sizes of wild-type and exon 3-skipping β-catenin are 836 bp, 294 bp (pool 1) and 294 bp (pool 2) in humans and 719 bp, 307 bp (pool 1) and 280 bp (pool 2) in mice, respectively. The molecular weights of β-cateninwild-type and β-cateninΔA5–A80 are 85 kDa and 77 kDa in both humans and in mice. GAPDH was used as a loading control. Full-length gels and blots are presented in Supplementary Figure X.
Figure 2
Figure 2
Activation of the Wnt/β-catenin signaling pathway in HCC cells harboring exon 3 skipping β-catenin. (a) Immunoblot analysis of β-catenin by using an antibody targeting amino acids 29–49 of β-catenin. Full-length blots are presented in Supplementary Figure X. (b) Immunoblot analysis of cytoplasmic and nuclear protein fractions. GAPDH and lamin B1 were used as controls of the cytoplasmic and nuclear protein fractions, respectively. Full-length blots are presented in Supplementary Figure X. (c) TOPFlash dual luciferase assay. Luciferase activity of control cells transfected with the FOPFlash vector was used as a control. (d) Quantitative RT-PCR analysis of downstream genes of the Wnt/β-catenin signaling pathway. Error bars are the mean ± SD. P-values were calculated by Welch's t test. **P < 0.01; ***P < 0.001.
Figure 3
Figure 3
Alteration of signaling pathways by exon 3 skipping of β-catenin in HCC. (a) Bubble plots of gene sets negatively enriched in the HuH7-CTNNB1Δex3 and 3H3-Ctnnb1Δex3 cells. (b) Enrichment plots of gene sets commonly associated with the HuH7-CTNNB1Δex3 and 3H3-Ctnnb1Δex3 cells. Hallmark (H: hallmark) and ontology (C5.BP: gene ontology biological process) gene sets were obtained from the MSigDB. Normalized enrichment score (NES), normalized P-value and false discovery rate (FDR) were calculated by the GSEA application.
Figure 4
Figure 4
Downregulation of cytokines in human and mouse HCC cells with exon 3 skipping of β-catenin. (a) Volcano plots of differentially expressed cytokine genes between the HuH7 and 3H3 cells with and without β-catenin signaling activation. (b) Venn diagram of cytokine genes downregulated in the HuH7-CTNNB1Δex3 and 3H3-Ctnnb1Δex3 cells. Twenty and sixteen genes were extracted from 114 genes registered in the CYTOKINE ACTIVITY gene set (fold-change < 0.5 and P-value < 0.01). (c) Quantitative PCR analysis of four candidate cytokine genes downregulated by β-catenin signaling activation. Error bars are the mean ± SD. P-values were calculated by Welch's t test. *P < 0.05; **P < 0.01; ***P < 0.001.
Figure 5
Figure 5
Downregulation of cytokines in human HCC samples with CTNNB1 hotspot mutations. Boxes in violin plots represent the interquartile range (range from the 25th to the 75th percentile), and horizontal lines show the median values. P-values were calculated by Mann–Whitney U test.
Figure 6
Figure 6
Immune evasion of mouse HCC cells with β-catenin signaling activation. (a) Schematic representation of in vitro T cell killing assays. (b,c) Two- and three-dimensional T cell killing assays of the 3H3-Ctnnb1Δex3 cells. The left and right panels show representative phase-contrast images and cell viability data, respectively. Error bars are the mean ± SD. P-values were calculated by Welch's t test. **P < 0.01; ***P < 0.001. (d) and (e) Three-dimensional T cell killing assays of the β-catenin-knockdown and cytokine-expressing 3H3-Ctnnb1Δex3 cells, respectively. Error bars are the mean ± SD.
Figure 7
Figure 7
Immune evasion of mouse HCC tissues with β-catenin signaling activation. (a) CD8+ T cells in grafted tumor tissues. The left and right panels show representative immunohistochemical images and T cell infiltration data, respectively. (b) Quantitative PCR analysis of cytokine genes in grafted tumor tissues. Error bars are the mean ± SD. P-values were calculated by Welch's t test. *P < 0.05.

References

    1. Yang JD, et al. A global view of hepatocellular carcinoma: Trends, risk, prevention and management. Nat. Rev. Gastroenterol. Hepatol. 2019;16:589–604. doi: 10.1038/s41575-019-0186-y. - DOI - PMC - PubMed
    1. Finn RS, et al. Atezolizumab plus bevacizumab in unresectable hepatocellular carcinoma. N. Engl. J. Med. 2020;382:1894–1905. doi: 10.1056/NEJMoa1915745. - DOI - PubMed
    1. Llovet JM, Montal R, Sia D, Finn RS. Molecular therapies and precision medicine for hepatocellular carcinoma. Nat. Rev. Clin. Oncol. 2018;15:599–616. doi: 10.1038/s41571-018-0073-4. - DOI - PubMed
    1. Kumar-Sinha C, Chinnaiyan AM. Precision oncology in the age of integrative genomics. Nat. Biotechnol. 2018;36:46–60. doi: 10.1038/nbt.4017. - DOI - PMC - PubMed
    1. Llovet JM, Villanueva A, Lachenmayer A, Finn RS. Advances in targeted therapies for hepatocellular carcinoma in the genomic era. Nat. Rev. Clin. Oncol. 2015;12:408–424. doi: 10.1038/nrclinonc.2015.103. - DOI - PubMed

Publication types