. 2022 Jun;43(6):1508-1520.
doi: 10.1038/s41401-021-00753-x. Epub 2021 Aug 24.

Discovery of novel MIF inhibitors that attenuate microglial inflammatory activation by structures-based virtual screening and in vitro bioassays

Affiliations

Discovery of novel MIF inhibitors that attenuate microglial inflammatory activation by structures-based virtual screening and in vitro bioassays

Yu Zhang et al. Acta Pharmacol Sin. 2022 Jun.

Abstract

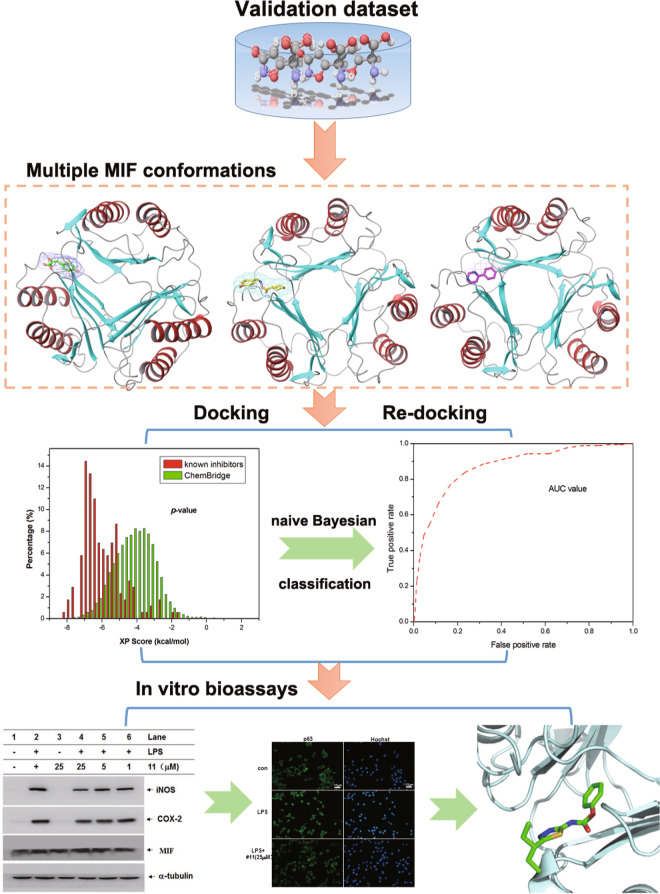
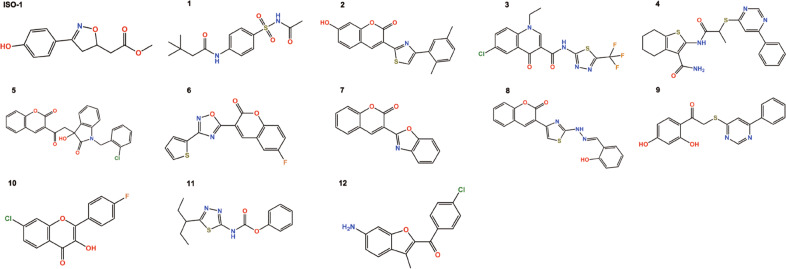
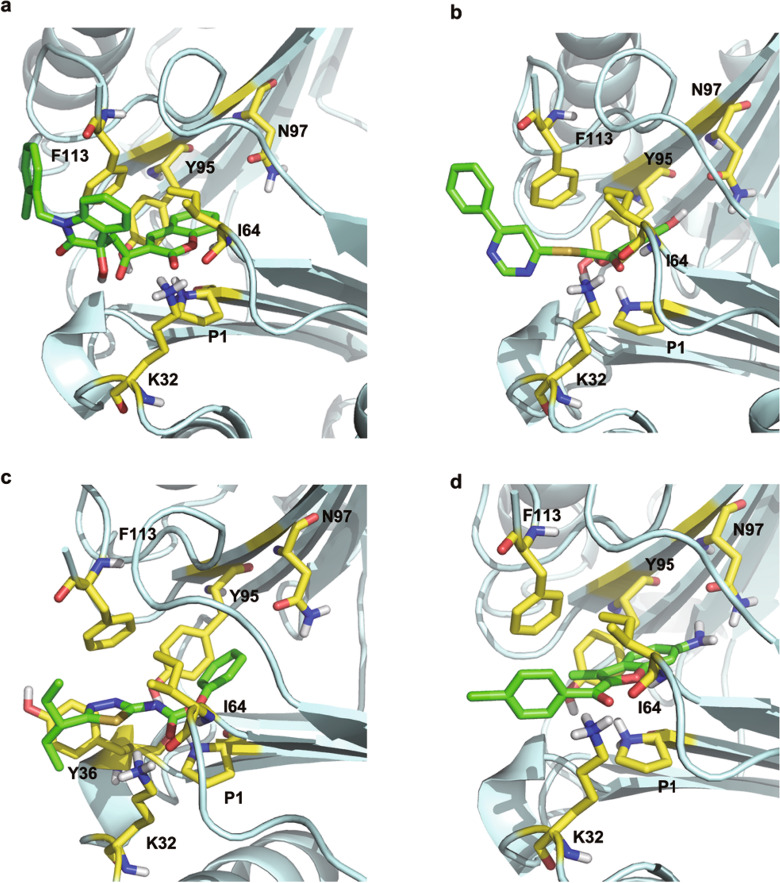
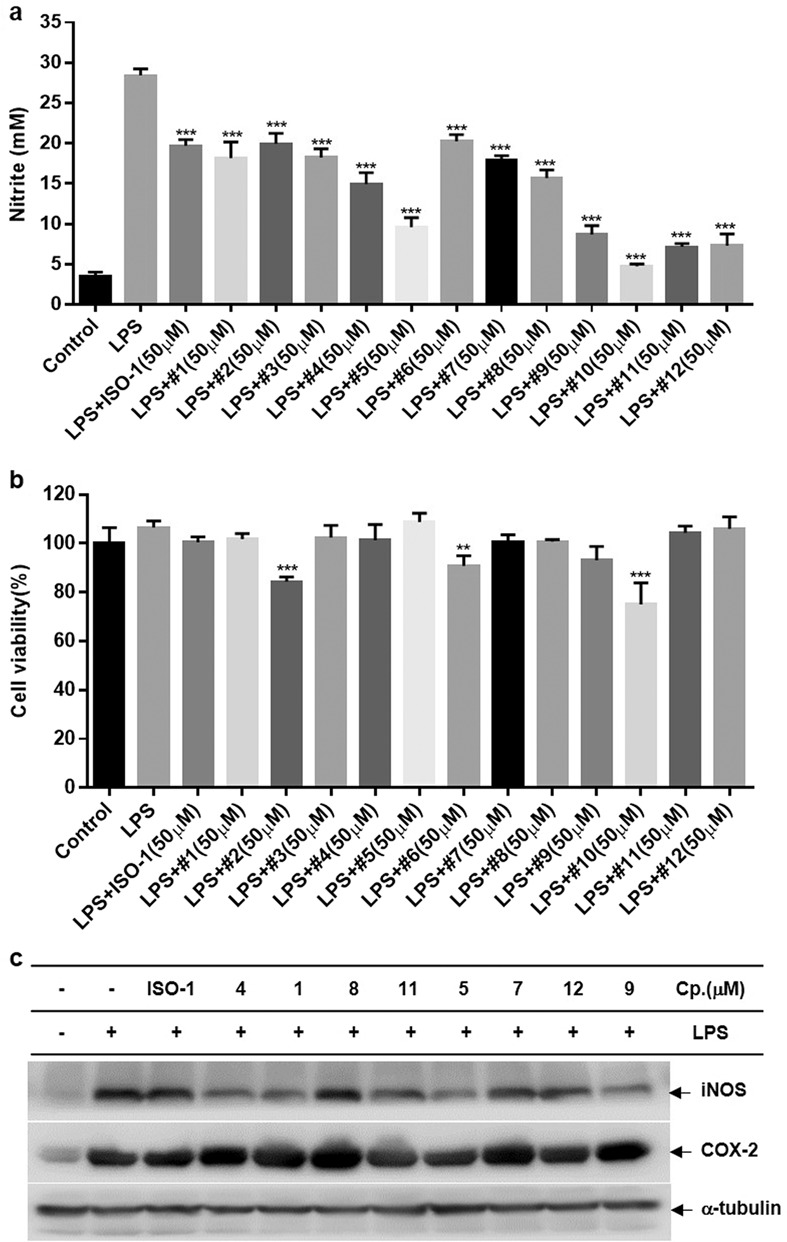
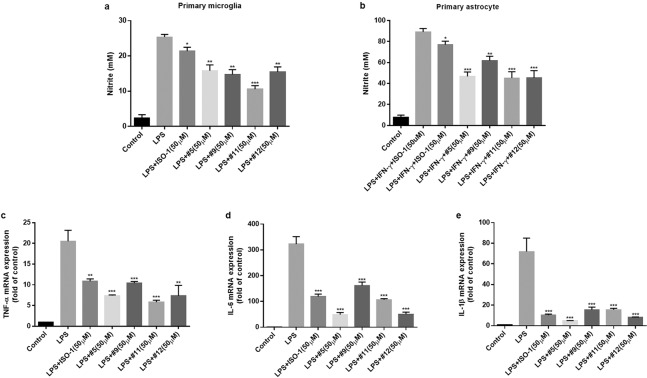
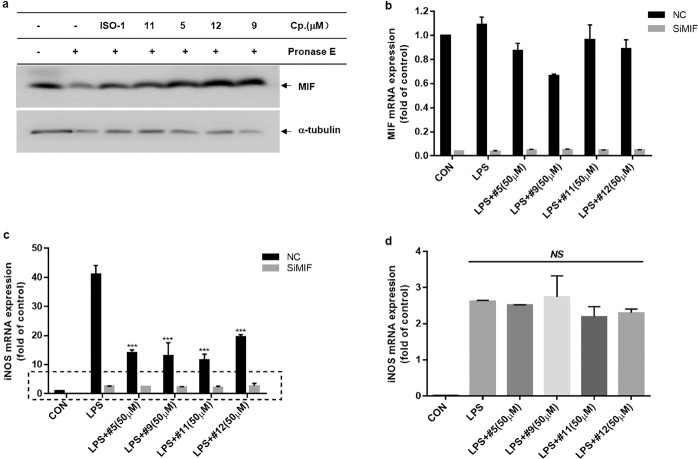
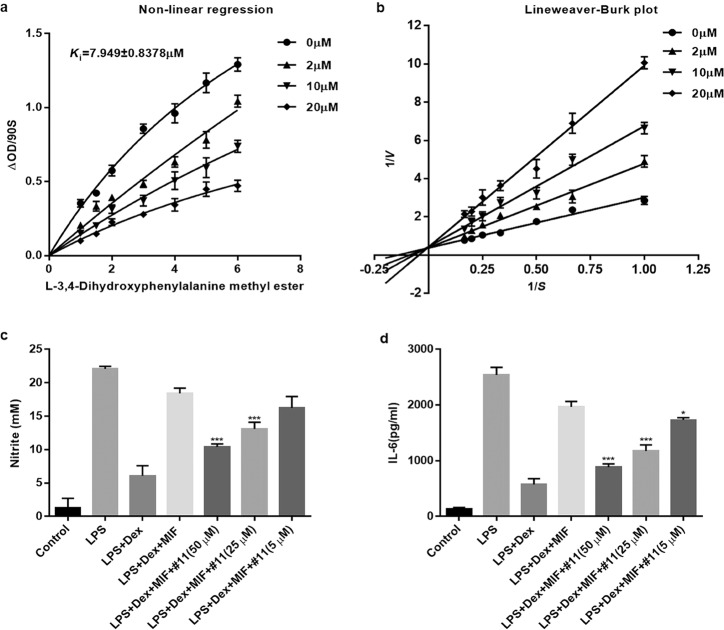
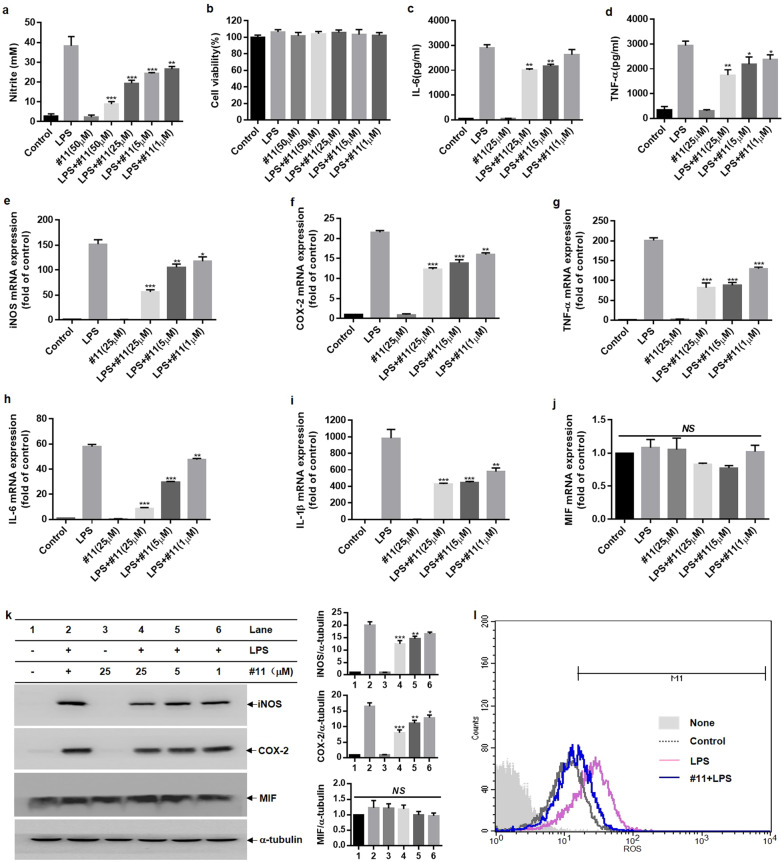
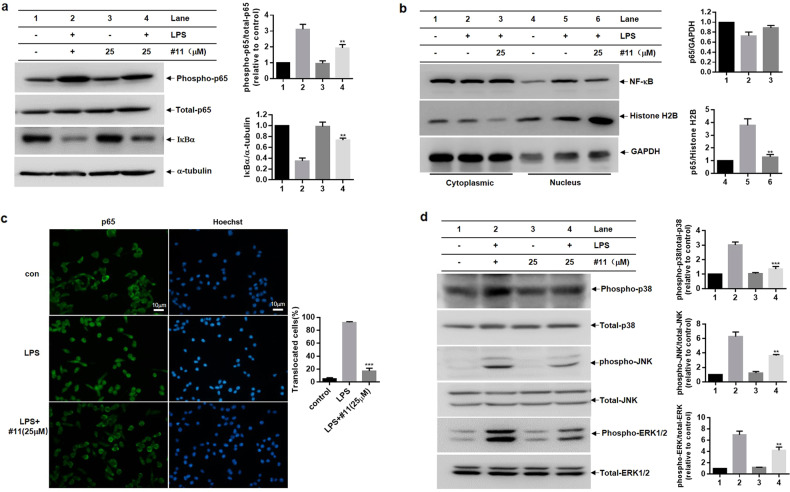
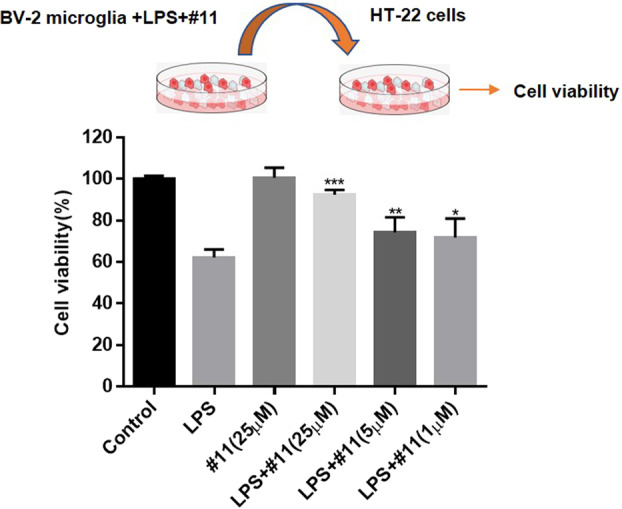
Macrophage migration inhibitory factor (MIF) is a pluripotent pro-inflammatory cytokine and is related to acute and chronic inflammatory responses, immune disorders, tumors, and other diseases. In this study, an integrated virtual screening strategy and bioassays were used to search for potent MIF inhibitors. Twelve compounds with better bioactivity than the prototypical MIF-inhibitor ISO-1 (IC50 = 14.41 μM) were identified by an in vitro enzymatic activity assay. Structural analysis revealed that these inhibitors have novel structural scaffolds. Compound 11 was then chosen for further characterization in vitro, and it exhibited marked anti-inflammatory efficacy in LPS-activated BV-2 microglial cells by suppressing the activation of nuclear factor kappa B (NF-κB) and mitogen-activated protein kinases (MAPKs). Our findings suggest that MIF may be involved in the regulation of microglial inflammatory activation and that small-molecule MIF inhibitors may serve as promising therapeutic agents for neuroinflammatory diseases.

Keywords: macrophage migration inhibitory factor; naive Bayesian classification; neuroinflammation; tautomerase assay; virtual screening.


Conflict of interest statement

The authors declare no competing interests.

Figures

Fig. 1
Fig. 1. Workflow of virtual screening.
It includes machine learning, MIF complex structures and bioassays.
Fig. 2
Fig. 2. Chemical structures of compounds.
They include ISO-1 and the 12 active compounds identified by machine learning-based virtual screening with multiple MIF structures and enzyme-based assays.
Fig. 3
Fig. 3. The 3D presentation of the interactions.
MIF binding pockets for 5 (a), 9 (b), 11(c) and 12 (d).
Fig. 4
Fig. 4. Effects of the compounds on the production of NO, cell viability, protein levels of iNOS, and COX-2 in LPS-primed BV-2 microglial cells.
Cells were exposed to the compounds (50 μM) for 30 min prior to LPS (0.2 µg/mL) stimulation for 24 h. a The release of NO in cell culture medium was evaluated by Griess reagent. b Cell viability was measured using an MTT reagent. c The expression of iNOS and COX-2 at the protein level was examined by Western blotting. The expression of α-tubulin was used as an internal control. **P < 0.01, ***P < 0.001 compared to the LPS-alone group.
Fig. 5
Fig. 5. Effects of compounds 5, 9, 11, and 12 on the production of NO and the mRNA expression of pro-inflammatory factors in glial cells.
Cells were pretreated with 25 μM compounds 5, 9, 11, and 12 for 30 min prior to LPS or LPS + INF-γ stimulation. a, b After 24 h of LPS (0.2 µg/mL) or LPS+INF-γ (50 U) stimulation, the levels of NO in the supernatants of primary microglial cells (a) and primary astrocytes (b) were determined by Griess reagent. ce RT-qPCR analysis of TNF-α (c), IL-1β (d), and IL-6 (e) mRNA levels after LPS stimulation for 6 h. *P < 0.05, **P < 0.01, ***P < 0.001 compared to the LPS-alone group.
Fig. 6
Fig. 6. The anti-inflammatory effects of MIF tautomerase inhibitors were dependent on MIF expression.
a Lysates of BV-2 microglial cells were collected by M-PER lysis and incubated with compounds 5, 9, 11, and 12 (50 μM) for 1 h. Then, pronase E was added and incubated for 15 min, and each reaction was stopped by the addition of a protease inhibitor cocktail. The protein level of MIF was determined by Western blotting. bd BV-2 microglial cells were treated with MIF siRNA or scrambled siRNA (NC) for 36–48 h and then primed with LPS (0.2 µg/mL) with or without compounds 5, 9, 11, and 12 (50 μM) for 6 h. mRNA expression of MIF (b) and iNOS (c, d) was examined by RT-qPCR. ***P < 0.001 compared to the LPS-alone group.
Fig. 7
Fig. 7. Competitive inhibition pattern and the inhibition of MIF-mediated abrogation of glucocorticoid activity by compound 11.
a, b Nonlinear regression analysis and Lineweaver−Burk plot showing the inhibitory constant (Ki) and type of inhibition. c, d Primary microglial cells were pretreated for 30 min with dexamethasone (DEX; 0.1 μM) and recombinant MIF (0.25 μM) in the presence or absence of the compounds (5-50 μM) prior to LPS (0.2 μg/mL) stimulation. At 24 h after LPS stimulation, the levels of NO in the supernatants were measured using Griess reagents (c), and the levels of IL-6 were measured using ELISA (d). *P < 0.05, ***P < 0.001 compared with the LPS + DEX + MIF group.
Fig. 8
Fig. 8. Effects of compound 11 on the generation of pro-inflammatory factors in LPS-primed BV-2 microglial cells.
Cells were pretreated with compound 11 (1–50 μM) for 0.5 h prior to LPS (0.2 µg/mL) stimulation. a, b After 24 h of LPS stimulation, NO levels were evaluated by Griess reagent (a), and cell viability was determined by MTT assays (b). c, d The production of IL-6 (c) and TNF-α (d) in supernatants after LPS stimulation for 24 h was evaluated by ELISA. ej The mRNA expression of iNOS, COX-2, TNF-α, IL-6, IL-1β, and MIF after LPS treatment for 6 h was assessed by RT-qPCR. k Western blot analysis of iNOS, COX-2, MIF, and α-tubulin protein expression in lysates of LPS-primed BV-2 microglial cells at 16 h (k, left). The expression of α-tubulin was used as an internal control, and the relative expression of MIF, iNOS, and COX-2 was quantified by densitometric analysis (k, right). l After 16 h of LPS stimulation, the production of intracellular ROS was measured by flow cytometry. *P < 0.05, **P < 0.01, ***P < 0.001 compared with the LPS-alone group.
Fig. 9
Fig. 9. Compound 11 inhibits LPS-induced BV-2 microglial cells activation via NF-κB and MAPK signaling.
BV-2 microglial cells were primed with compound 11 (25 μM) for 30 min before LPS stimulation. a Western blot analysis of phospho-p65, p65, IκBα, and α-tubulin protein levels in LPS-primed BV-2 microglial cells at 20 min (a, left). The relative expression of phospho-p65 and IκBα was quantified by densitometric analysis (a, right). b Western blot analysis of p65 and Histone H2B in the nuclear fraction and Western blot analysis of p65 and GAPDH in the cytoplasm of LPS-primed BV-2 microglial cells at 1 h (b, left). Histone H2B and GAPDH were used as internal controls. The relative expression of p65 in the nucleus and cytoplasm was quantified by densitometric analysis (b, right). c After 1 h of LPS stimulation, NF-κB p65 subunit localization was visualized by immunofluorescence analysis, and all cell nuclei were counterstained with Hoechst. The scale bar represents 10 μm (c, left). The ratio of cells with p65 nuclear translocation was calculated by counting at least 100 cells in a coverslip (c, right). d Western blot analysis of MAPKs (p38, JNK, ERK) in the lysates of LPS-primed BV-2 microglial cells at 1 h (d, left). Total p38, JNK, and ERK were used as internal controls, and the relative phosphorylation level of p38, JNK, and ERK was quantified by densitometric analysis (d, right). **P < 0.01, ***P < 0.001 compared with the LPS-alone group.
Fig. 10
Fig. 10. Neuroprotective effect of compound 11 on CM from a microglia/neuroblastoma co-culture model.
BV-2 microglial cells were pretreated with or without compound 11 (1–25 μM) and then stimulated with LPS (0.2 µg/mL) for 6 h. The culture media was discarded, and fresh medium was added. After 24 h of incubation, the culture supernatants were collected and then added to HT-22 neuronal cells as described in the Methods. After co-culture for 24 h, cell viability was determined using an MTT reagent. *P < 0.05, **P < 0.01, ***P < 0.001 compared with the LPS-alone group.

References

    1. Amor S, Peferoen LAN, Vogel DYS, Breur M, Der Valk PV, Baker D, et al. Inflammation in neurodegenerative diseases- an update. Immunology. 2014;142:151–66. doi: 10.1111/imm.12233. - DOI - PMC - PubMed
    1. Block ML, Zecca L, Hong J. Microglia-mediated neurotoxicity: uncovering the molecular mechanisms. Nat Rev Neurosci. 2007;8:57–69. doi: 10.1038/nrn2038. - DOI - PubMed
    1. Dong XH, Zhen XC. Glial pathology in bipolar disorder: potential therapeutic implications. Neurosci Ther. 2015;21:393–7. doi: 10.1111/cns.12390. - DOI - PMC - PubMed
    1. Perry VH, Nicoll JAR, Holmes C. Microglia in neurodegenerative disease. Nat Rev Neurol. 2010;6:193–201. doi: 10.1038/nrneurol.2010.17. - DOI - PubMed
    1. Xu L, Li Y, Sun H, Zhen X, Qiao C, Tian S, et al. Current developments of macrophage migration inhibitory factor (MIF) inhibitors. Drug Discov Today. 2013;18:592–600. doi: 10.1016/j.drudis.2012.12.013. - DOI - PubMed

MeSH terms

Substances