

Life-history responses of a freshwater rotifer to copper pollution
- PMID: 34429893
- PMCID: PMC8366851
- DOI: 10.1002/ece3.7877
Life-history responses of a freshwater rotifer to copper pollution
Abstract
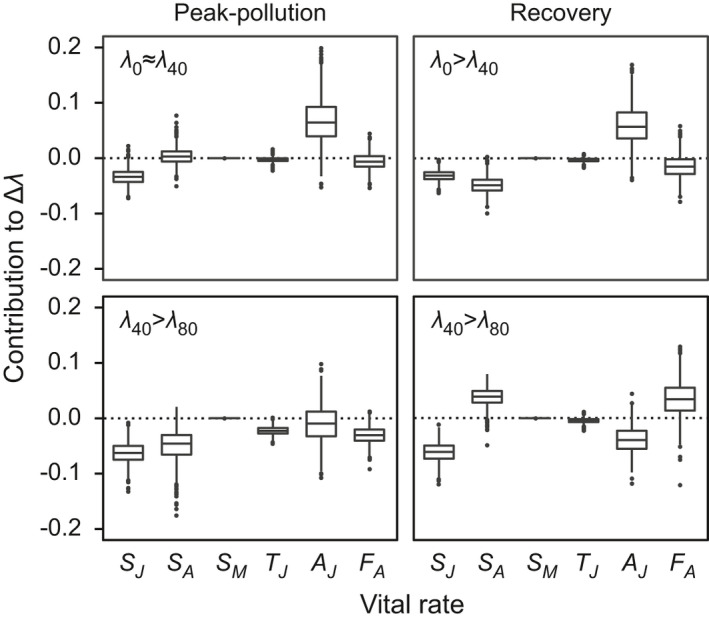
In organisms with dormant stages, life-history responses to past pollution can be studied retrospectively. Here, we study such responses in a rotifer (Brachionus calyciflorus) from the once heavily copper-polluted Lake Orta (Italy). We extracted resting eggs from sediments, established clonal lineages from hatchlings, and exposed newborns of these lineages to one of three copper concentrations that each mimicked a specific period in the lake's pollution history. For each rotifer, we daily collected life-table data. We then estimated treatment-specific vital rates and used a stage-structured population model to project population growth rate λ. We also estimated elasticities of λ to vital rates and contributions of vital rates to observed Δλ between copper treatments. As expected, λ decreased with increasing copper concentration. This decrease resulted mostly from a decline in juvenile survival rate (SJ ) and partly from a decline in the survival rate of asexually reproducing females (SA ). Maturation rate, and with one exception fecundity, also declined but did not contribute consistently to Δλ. λ was most elastic to SJ and SA , indicating that survival rates were under stronger selection than maturation rate and fecundity. Together, our results indicate that variation in juvenile survival is a key component in the rotifers' copper response. The consistent decrease in SJ with increasing copper stress and the sensitivity of λ to that decrease also suggest that juvenile survival is a useful indicator of population performance under environmental pollution.
Keywords: copper; life history; pollution; population growth; rotifer; vital rate.
© 2021 The Authors. Ecology and Evolution published by John Wiley & Sons Ltd.
Conflict of interest statement
The authors declare no conflict of interest.
Figures


Similar articles
-
[Effects of glyphosate on life histroy characteristics of freshwater rotifer Brachionus calyciflorus].Ying Yong Sheng Tai Xue Bao. 2005 Jun;16(6):1142-5. Ying Yong Sheng Tai Xue Bao. 2005. PMID: 16180771 Chinese.
-
Algal density affects the influences of polyethylene microplastics on the freshwater rotifer Brachionus calyciflorus.Chemosphere. 2021 May;270:128613. doi: 10.1016/j.chemosphere.2020.128613. Epub 2020 Oct 13. Chemosphere. 2021. PMID: 33131733
-
[Influence of temperature on the population dynamics of the rotifer Brachionus calyciflorus pallas].Oecologia. 1970 Jun;4(2):176-207. doi: 10.1007/BF00377100. Oecologia. 1970. PMID: 28309579 German.
-
Ecotoxicological studies with the freshwater rotifer Brachionus calyciflorus. IV. Rotifer behavior as a sensitive and rapid sublethal test criterion.Ecotoxicol Environ Saf. 1994 Aug;28(3):244-55. doi: 10.1006/eesa.1994.1050. Ecotoxicol Environ Saf. 1994. PMID: 7525220
-
Effects of Multi-metal (Cu, Zn, Cd, Cr, and Mn) Mixtures on the Reproduction of Freshwater Rotifer Brachionus calyciflorus.Bull Environ Contam Toxicol. 2015 Dec;95(6):714-20. doi: 10.1007/s00128-015-1675-5. Epub 2015 Oct 13. Bull Environ Contam Toxicol. 2015. PMID: 26464391
References
-
- Allan, J. D. (1976). Life history patterns in zooplankton. The American Naturalist, 110(971), 165–180. 10.1086/283056 - DOI
-
- Bates, D., Mächler, M., Bolker, B. M., & Walker, S. C. (2015). Fitting linear mixed‐effects models using lme4. Journal of Statistical Software, 67(1), v067.i01. 10.18637/jss.v067.i01 - DOI
Associated data
LinkOut - more resources
Full Text Sources
Other Literature Sources
Research Materials
Miscellaneous
