. 2021 Jul 15;11(16):11223-11240.
doi: 10.1002/ece3.7909. eCollection 2021 Aug.

Macronutrient balancing in free-ranging populations of moose

Affiliations

Macronutrient balancing in free-ranging populations of moose

Annika M Felton et al. Ecol Evol. .

Abstract

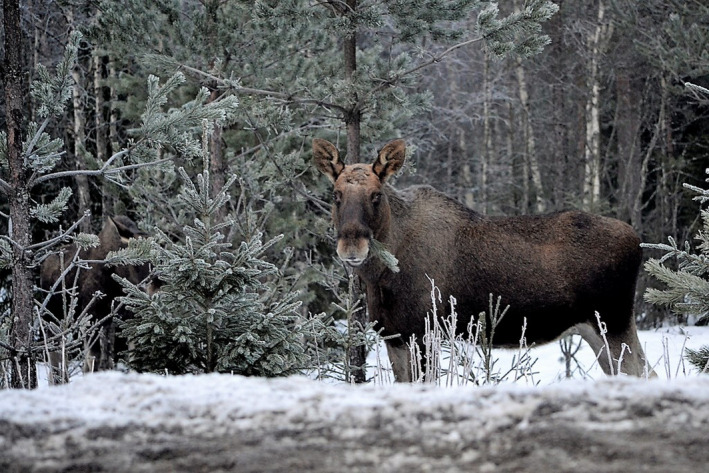
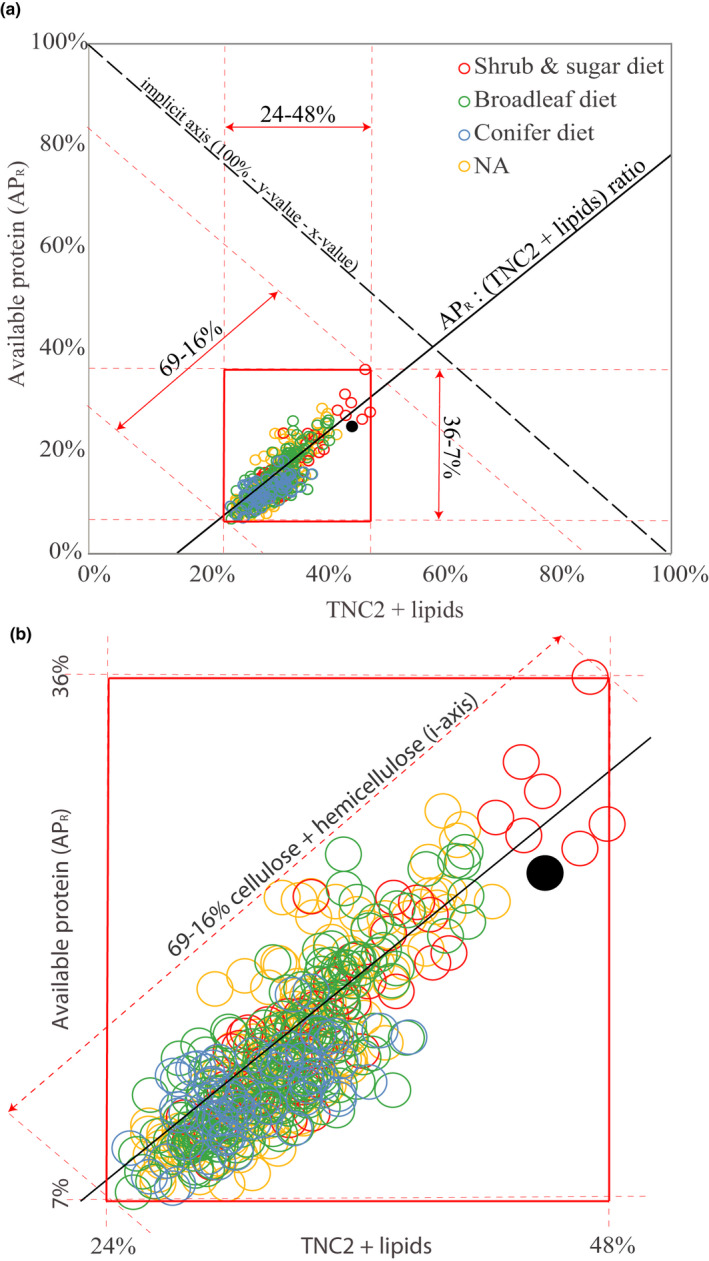
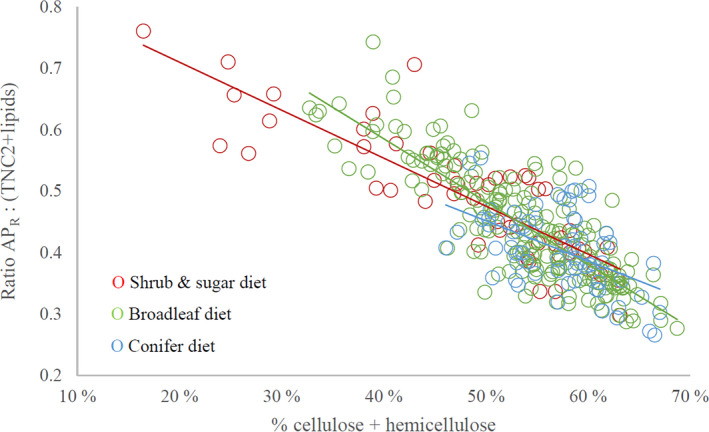
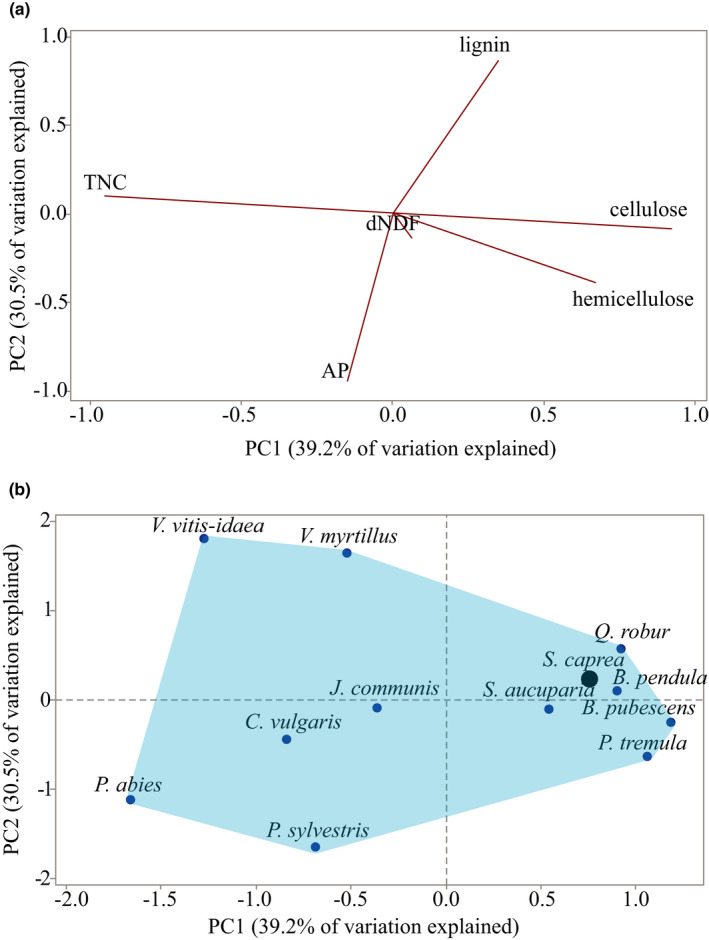
At northern latitudes, large spatial and temporal variation in the nutritional composition of available foods poses challenges to wild herbivores trying to satisfy their nutrient requirements. Studies conducted in mostly captive settings have shown that animals from a variety of taxonomic groups deal with this challenge by adjusting the amounts and proportions of available food combinations to achieve a target nutrient balance. In this study, we used proportions-based nutritional geometry to analyze the nutritional composition of rumen samples collected in winter from 481 moose (Alces alces) in southern Sweden and examine whether free-ranging moose show comparable patterns of nutrient balancing. Our main hypothesis was that wild moose actively regulate their rumen nutrient composition to offset ecologically imposed variation in the nutritional composition of available foods. To test this, we assessed the macronutritional composition (protein, carbohydrates, and lipids) of rumen contents and commonly eaten foods, including supplementary feed, across populations with contrasting winter diets, spanning an area of approximately 10,000 km2. Our results suggest that moose balanced the macronutrient composition of their rumen, with the rumen contents having consistently similar proportional relationship between protein and nonstructural carbohydrates, despite differences in available (and eaten) foods. Furthermore, we found that rumen macronutrient balance was tightly related to ingested levels of dietary fiber (cellulose and hemicellulose), such that the greater the fiber content, the less protein was present in the rumen compared with nonstructural carbohydrates. Our results also suggest that moose benefit from access to a greater variety of trees, shrubs, herbs, and grasses, which provides them with a larger nutritional space to maneuver within. Our findings provide novel theoretical insights into a model species for ungulate nutritional ecology, while also generating data of direct relevance to wildlife and forest management, such as silvicultural or supplementary feeding practices.

Keywords: Alces alces; deer; herbivory; nutritional ecology; primate; ungulate.


Conflict of interest statement

The authors declare no competing interests.

Figures

FIGURE 1
FIGURE 1
Female moose (Alces alces) among broadleaved and conifer food trees. Photo credit: Inger Bjørndal Foss [Correction added on 23 July 2021, after first online publication: Figure 1 caption has been corrected in this version.]
FIGURE 2
FIGURE 2
(a) Right‐angled mixture triangle (RMT) (Raubenheimer, 2011) depicting the relative components of macronutrient content in individual moose rumen samples (n = 481) collected during the winter 2014/15 in southern Sweden, expressed as a percentage of total macronutrients in g dry matter (dm). X‐axis = % macronutrients providing highly digestible energy (a combined measure of total nonstructural carbohydrates and lipids (TNC2+lipids)). Y‐axis = % available protein (APR) which includes microbial‐N. I‐axis (implicit axis, i.e., 100% minus y‐value minus x‐value) = % cellulose and hemicellulose (fibers). Increased distance from the hypotenuse means increased % fiber. Circles = composition of individual rumen samples. For example, the filled black circle represents a sample (approx. one meal) with contributions of 25% AP, 30% fiber, and 45% TNC2+lipids, totaling 100%. Solid black line: linear relationship between (nonstandardized) % APR and %TNC2+lipids (y = 0.98x − 0.17, R² = 0.70). Dashed red lines draw the upper and lower limits of the three dimensions’ observed ranges, while solid red lines mark the resulting range of observations, which is expanded in panel (b). (b) Three diet types (distinguished by color) were identified in these moose populations through rumen analysis, as classified by a previous study (Table 1 and Felton, Holmström, et al., 2020)). NA (yellow circles) indicates rumen samples where such plant identification data are not available. Note that no representatives of the “conifer diet” had less than 45% fiber (of total macronutrients), while the other two diet types were represented across the entire range of % fiber
FIGURE 3
FIGURE 3
Relationship between the proportion of fiber (cellulose and hemicellulose) and the ratio between available protein (APR) and macronutrients providing highly digestible energy (TNC2+lipids (see Figure 2)), in individual moose rumen samples (n = 319) collected during the winter 2014/15 in southern Sweden. Values are based on percentages of total macronutrients in g dry matter (dm), where APR, TNC2+lipids, and fiber sum up to 100%. Lines are drawn for the linear relationship of each of the three diet types, where the “broadleaf” diet type had a steeper slope than the “shrub and sugar diet” (t = 3.1, p = .002, see Table S3 for parameter coefficients). Note how the range of fiber contents differed between the diet types
FIGURE 4
FIGURE 4
(a) PCA results illustrating the nutritional composition of 12 common moose food plants in Sweden, using the mean composition (% dm, estimated by wet chemistry) of six nutritional constituents (loading plot). Edible parts of twigs and/or needles edible were sampled in winter (March 2015). The first principal component (PC1, x‐axis) depicts variation in total nonstructural carbohydrates (TNC1, increasing values to the left), cellulose, and hemicellulose (both with increasing values to the right). The second principal component (PC2, y‐axis) depicts variation in lignin (increasing values upwards) and available protein (AP, increasing values downwards). In vitro digestibility of NDF (dNDF) has neutral values on both axes. For loading values, see Appendix: Table S4. (b) Score plot from the same PCA showing the placement of the 12 plant species within this nutritional space. Six of the plant species are evergreen: Pinus sylvestris, Picea abies, Juniperus communis, Vaccinium vitis‐idaea, Calluna vulgaris, and V. myrtillus (even though the latter is deciduous). Salix caprea is denoted by a large black point, as its nutritional composition has been found to correspond to the wintertime nutritional target balance of moose, as identified experimentally with captive moose (Felton et al., 2016). A moose that has access to all plants has a larger nutritional space (blue field) to navigate within compared with a moose that only has access to a few of the plants. The 12 food items together represent ca 85% of total ingested dry matter by these moose populations (Felton, Holmström, et al., 2020)
FIGURE 5
FIGURE 5
The score plot from a PCA of the nutritional composition of five common supplementary feeds (marked with asterisk) used in Sweden and 12 common moose food plants (parts of their twigs edible for moose). The supplementary feeds are three root vegetables (whole roots of Beta vulgaris, Solanum tuberosum, and Dauca carota), one type of silage (a grass mix with <25% legumes), and green peas (Pisum sativum). Included in the PCA are the nutritional constituents (as % dm): available protein, NDF, and total nonstructural carbohydrates (TNC1). The first principal component (PC1, x‐axis) depicts variation in NDF (increasing values to the left) and TNC1 (increasing values to the right; more details in Appendix: Table S5 and Figure S3). The second principal component (PC2, y‐axis) depicts variation in protein (increasing values upwards). The blue field illustrates the nutritional space created by the 12 moose food plants that are not supplementary foods (see Figure 4)

References

    1. Aharoni, Y., & Tagari, H. (1991). Use of N‐15 determinations of purine nitrogen fraction of digesta to define nitrogen‐metabolism traits in the rumen. Journal of Dairy Science, 74, 2540–2547. - PubMed
    1. Allen, M. S. (1997). Relationship between fermentation acid production in the rumen and the requirement for physically effective fiber. Journal of Dairy Science, 80, 1447–1462. - PubMed
    1. Asher, G. W., Stevens, D. R., Archer, J. A., Barrel, G. K., Scott, I. C., Ward, J. F., & Littlejohn, R. P. (2011). Energy and protein as nutritional drivers of lactation and calf growth of farmed red deer. Livestock Science, 140, 8–16.
    1. Barboza, P. S., Parker, K. L., & Hume, I. D. (2008). Integrative wildlife nutrition. Springer Science & Business Media.
    1. Belovsky, G. E. (1978). Diet optimization in a generalist herbivore ‐ Moose. Theoretical Population Biology, 14, 105–134. - PubMed

LinkOut - more resources