. 2021 Sep 7;10(17):e020717.
doi: 10.1161/JAHA.120.020717. Epub 2021 Aug 25.

Trends in Prepregnancy Obesity and Association With Adverse Pregnancy Outcomes in the United States, 2013 to 2018

Affiliations

Trends in Prepregnancy Obesity and Association With Adverse Pregnancy Outcomes in the United States, 2013 to 2018

Michael C Wang et al. J Am Heart Assoc. .

Abstract

Background The prevalence of obesity in the population has increased in parallel with increasing rates of adverse pregnancy outcomes (APOs). Quantifying contemporary trends in prepregnancy obesity and associations with interrelated APOs (preterm birth, low birth weight, and pregnancy-associated hypertension) together and individually can inform prevention strategies to optimize cardiometabolic health in women and offspring. Methods and Results We performed a serial, cross-sectional study using National Center for Health Statistics birth certificate data including women aged 15 to 44 years with live singleton births between 2013 and 2018, stratified by race/ethnicity (non-Hispanic White, non-Hispanic Black, Hispanic, and non-Hispanic Asian). We quantified the annual prevalence of prepregnancy obesity (body mass index ≥30.0 kg/m2; body mass index ≥27.5 kg/m2 if non-Hispanic Asian). We then estimated adjusted associations using multivariable logistic regression (odds ratios and population attributable fractions) for obesity-related APOs compared with normal body mass index (18.5-24.9 kg/m2; 18.5-22.9 kg/m2 if non-Hispanic Asian). Among 20 139 891 women, the prevalence of prepregnancy obesity increased between 2013 and 2018: non-Hispanic White (21.6%-24.8%), non-Hispanic Black (32.5%-36.2%), Hispanic (26.0%-30.5%), and non-Hispanic Asian (15.3%-18.6%) women (P-trend < 0.001 for all). Adjusted odds ratios (95% CI) for APOs associated with obesity increased between 2013 and 2018, and by 2018, ranged from 1.27 (1.25-1.29) in non-Hispanic Black to 1.94 (1.92-1.96) in non-Hispanic White women. Obesity was most strongly associated with pregnancy-associated hypertension and inconsistently associated with preterm birth and low birth weight. Population attributable fractions of obesity-related APOs increased over the study period: non-Hispanic White (10.6%-14.7%), non-Hispanic Black (3.7%-6.9%), Hispanic (7.0%-10.4%), and non-Hispanic Asian (7.4%-9.7%) women (P-trend < 0.01 for all). Conclusions The prevalence of prepregnancy obesity and burden of obesity-related APOs have increased, driven primarily by pregnancy-associated hypertension, and vary across racial/ethnic subgroups.

Keywords: adverse pregnancy outcomes; obesity; population attributable fraction; primordial prevention; racial disparities.


Conflict of interest statement

None.

Figures
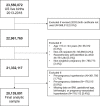
Figure 1
Figure 1. Flow diagram for the final analytic sample representing the study population.
From the initial population of all live births in the United States between 2013 and 2018 (N=23 550 072), we first excluded records using the unrevised (1989) birth certificate, which did not report prepregnancy body mass index. We then applied the following inclusion criteria: maternal age, 15–44 years; US resident; self‐identified as non‐Hispanic White, non‐Hispanic Black, Hispanic, or non‐Hispanic Asian; and singleton pregnancy. Finally, we applied the following exclusion criteria: prepregnancy hypertension; prepregnancy diabetes mellitus; or missing data on prepregnancy BMI, gestational age, birth weight, or pregnancy‐associated hypertension. Our final analytic sample contained 20 139 891 live births. BMI indicates body mass index.
Figure 2
Figure 2. Trends in the percentage of women in each prepregnancy BMI category stratified by race/ethnicity in the United States, 2013 to 2018.
We examined annual trends in the categorical BMI distribution of pregnant women between 2013 and 2018 in (A) non‐Hispanic White, (B) non‐Hispanic Black, (C) Hispanic, and (D) non‐Hispanic Asian women. Each year, the proportion of prepregnancy normal BMI decreased while the prevalence of prepregnancy obesity increased across all racial/ethnic groups. There were large differences in the prevalence of prepregnancy obesity by race/ethnicity. BMI indicates body mass index.
Figure 3
Figure 3. Trends in unadjusted rates of APOs stratified by race/ethnicity and prepregnancy BMI category in the United States, 2013 to 2018.
We examined annual trends in unadjusted APO rates between 2013 and 2018 in (A) non‐Hispanic White, (B) non‐Hispanic Black, (C) Hispanic, and (D) non‐Hispanic Asian women stratified by prepregnancy BMI category. The rate of APOs increased between 2013 and 2018 across all racial/ethnic groups and for all BMI categories except underweight. This increase was greatest among women with prepregnancy obesity, who also experienced higher rates of APOs than women with overweight or normal BMI. However, annual rates were consistently different by race/ethnicity. APO indicates adverse pregnancy outcome; and BMI, body mass index.
Figure 4
Figure 4. Association between prepregnancy BMI and APOs adjusted for age and stratified by race/ethnicity in the United States, 2013 and 2018.
We assessed associations of continuous prepregnancy BMI with APO in (A) non‐Hispanic White, (B) non‐Hispanic Black, (C) Hispanic, and (D) non‐Hispanic Asian women. For each racial/ethnic group, we plotted the conditional expectation of APO rate on BMI, adjusted for age, in 2013 and 2018 using 20 equal‐sized bins, and superimposed separate linear fit lines within each BMI category. Vertical dashed lines represent BMI category cut points (18.5 kg/m2, 25 kg/m2, and 30 kg/m2; 18.5 kg/m2, 23.0 kg/m2, and 27.5 kg/m2 in Asian women). There was a J‐shaped relationship between continuous prepregnancy BMI and APOs for all racial/ethnic groups, with both underweight and obesity associated with higher risk of APOs compared with normal BMI. Within overweight and obesity strata, the slopes of the linear splines for overweight and obesity increased between 2013 and 2018, suggesting increasing APO risk associated with excess weight. APO indicates adverse pregnancy outcome; and BMI, body mass index.

References

    1. Martin JA, Hamilton BE, Osterman MJ, Driscoll AK. Births: final data for 2018. Natl Vital Stat Rep. 2019;68:1–47. - PubMed
    1. Lane‐Cordova AD, Khan SS, Grobman WA, Greenland P, Shah SJ. Long‐term cardiovascular risks associated with adverse pregnancy outcomes. J Am Coll Cardiol. 2019;73:2106–2116. DOI: 10.1016/j.jacc.2018.12.092. - DOI - PubMed
    1. Benjamin EJ, Muntner P, Alonso A, Bittencourt MS, Callaway CW, Carson AP, Chamberlain AM, Chang AR, Cheng S, Das SR, et al. Heart disease and stroke statistics‐2019 update: a report from the American Heart Association. Circulation. 2019;139:e56–e528. DOI: 10.1161/CIR.0000000000000659. - DOI - PubMed
    1. Ananth CV, Keyes KM, Wapner RJ. Pre‐eclampsia rates in the United States, 1980–2010: age‐period‐cohort analysis. BMJ. 2013;347:f6564. DOI: 10.1136/bmj.f6564. - DOI - PMC - PubMed
    1. Zhang S, Cardarelli K, Shim R, Ye J, Booker KL, Rust G. Racial disparities in economic and clinical outcomes of pregnancy among medicaid recipients. Matern Child Health J. 2013;17:1518–1525. DOI: 10.1007/s10995-012-1162-0. - DOI - PMC - PubMed

Publication types