. 2021 Sep;20(9):e13459.
doi: 10.1111/acel.13459. Epub 2021 Aug 25.

A genome-wide association study of the frailty index highlights brain pathways in ageing

Affiliations

A genome-wide association study of the frailty index highlights brain pathways in ageing

Janice L Atkins et al. Aging Cell. 2021 Sep.

Abstract

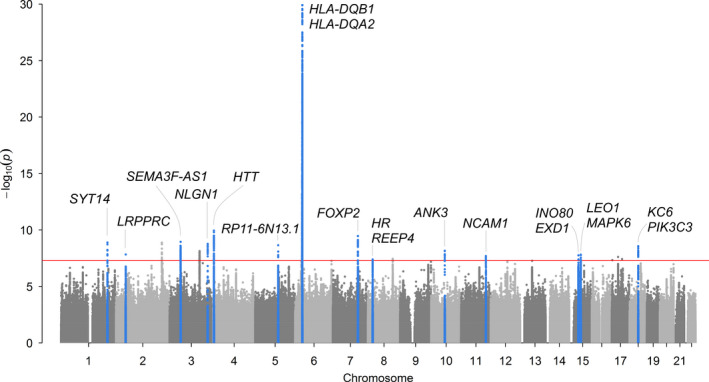
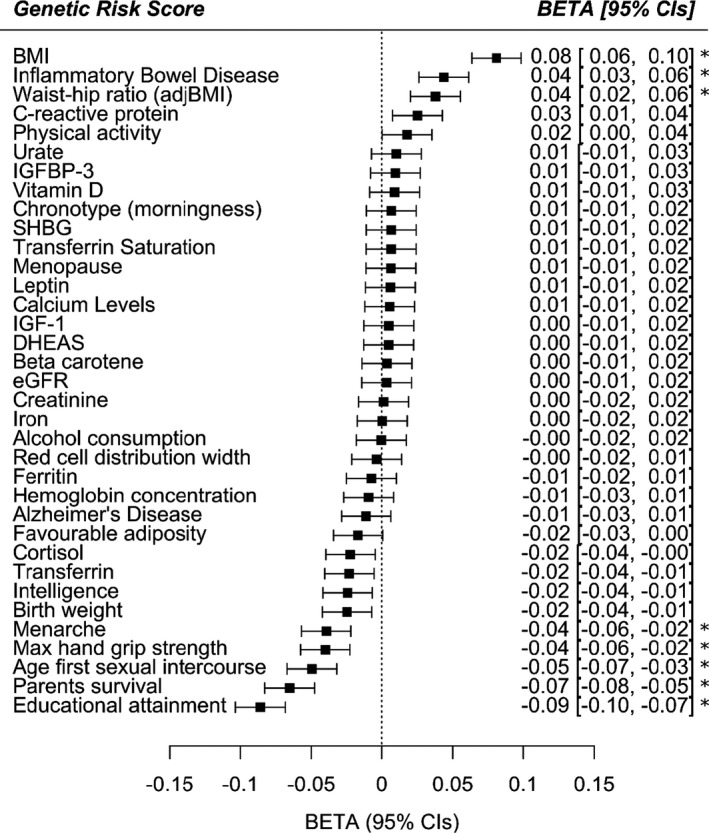
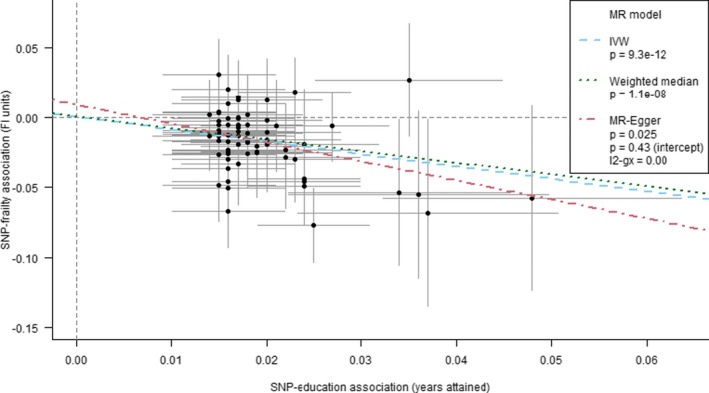
Frailty is a common geriatric syndrome and strongly associated with disability, mortality and hospitalization. Frailty is commonly measured using the frailty index (FI), based on the accumulation of a number of health deficits during the life course. The mechanisms underlying FI are multifactorial and not well understood, but a genetic basis has been suggested with heritability estimates between 30 and 45%. Understanding the genetic determinants and biological mechanisms underpinning FI may help to delay or even prevent frailty. We performed a genome-wide association study (GWAS) meta-analysis of a frailty index in European descent UK Biobank participants (n = 164,610, 60-70 years) and Swedish TwinGene participants (n = 10,616, 41-87 years). FI calculation was based on 49 or 44 self-reported items on symptoms, disabilities and diagnosed diseases for UK Biobank and TwinGene, respectively. 14 loci were associated with the FI (p < 5*10-8 ). Many FI-associated loci have established associations with traits such as body mass index, cardiovascular disease, smoking, HLA proteins, depression and neuroticism; however, one appears to be novel. The estimated single nucleotide polymorphism (SNP) heritability of the FI was 11% (0.11, SE 0.005). In enrichment analysis, genes expressed in the frontal cortex and hippocampus were significantly downregulated (adjusted p < 0.05). We also used Mendelian randomization to identify modifiable traits and exposures that may affect frailty risk, with a higher educational attainment genetic risk score being associated with a lower degree of frailty. Risk of frailty is influenced by many genetic factors, including well-known disease risk factors and mental health, with particular emphasis on pathways in the brain.

Keywords: UK Biobank; ageing; frailty; frailty index; genetics.


Conflict of interest statement

No conflicts of interest to declare.

Figures

FIGURE 1
FIGURE 1
Manhattan plot for genome‐wide association study of Frailty Index. Meta‐analysis GWAS of Frailty Index (normalized) in 164,610 UK Biobank participants aged 60–70 of European descent and 10,616 TwinGene participants aged 41–87 years. Primary analysis included 7,666,890 autosomal variants with minor allele frequency (MAF) >0.1%. Hardy–Weinberg p‐value >1x10⁻⁹ and imputation quality >0.3 in both cohorts. Linear mixed‐effects regression models (BOLT‐LMM software (Loh et al., 2015), which accounts for relatedness and population structure), were adjusted for age, sex, assessment centre (22 categories) and genotyping array (2 categories: Axiom or BiLEVE). There are 14 loci associated with p<5*10−8 (red line) in the meta‐analysis, highlighted in blue. In secondary analysis of 8,828,853 variants only available in UK Biobank, 6 additional loci were associated p<5*10−8 (plotted but not highlighted). Genes are those nearest to the lead variants. See Table 2 for primary meta‐analysis results. See Tables S1 and S2 for full details
FIGURE 2
FIGURE 2
Genetic risk score associations with the frailty index in UK Biobank. Thirty‐five exposures, including lifestyle factors, clinical measures, circulating biomarkers and diseases, were assessed for their association with the Frailty Index by genetic risk score analysis in UK Biobank participants of European descent aged 60–70 years. Linear regression models included age, sex, assessment centre (22 categories), genotyping array (2 categories: Axiom or BiLEVE) and principal components of ancestry 1–10 as covariates. The betas represent the SD change in FI per SD increase in genetic predisposition to the exposure. Positive betas suggest increased frailty in individuals with greater genetic predisposition to the exposure, whereas negative betas represent a protective effect with increasing genetic predisposition. See Table S10 for details. * = significant p<0.0014 after Bonferroni correction for 35 tests. Abbreviations: BMI = body mass index; adjBMI = adjusted for BMI; IGFBP‐3 = insulin‐like growth factor‐binding protein 3; SHBG = sex hormone binding globulin; IGF‐1 = insulin‐like growth factor 1; DHEAS = Dehydroepiandrosterone sulphate; eGFR = estimated glomerular filtration rate; CIs = 95% confidence intervals
FIGURE 3
FIGURE 3
Mendelian randomization estimates for the effect of educational attainment on the frailty index in UK Biobank Points and error bars represent beta estimates and 95% confidence intervals for each SNP‐education / SNP‐FI association. The trend lines represent different methods for summarizing the estimates from individual SNPS—inverse variance weighting (IVW), weighted median and MR‐Egger. The weighted median and MR‐Egger estimates are less prone to bias from pleiotropy among the set of variants than IVW, given alternative assumptions hold. The MR‐Egger method includes a test of whether the trend's intercept differs from zero, which indicates whether there is an overall imbalance (directional) of pleiotropic effects: such bias was not identified in this education‐FI model

References

    1. Blodgett, J., Theou, O., Kirkland, S., Andreou, P., & Rockwood, K. (2015). Frailty in NHANES: Comparing the frailty index and phenotype. Archives of Gerontology and Geriatrics, 60(3), 464–470. 10.1016/j.archger.2015.01.016. - DOI - PubMed
    1. Bottos, A., Rissone, A., Bussolino, F., & Arese, M. (2011). Neurexins and neuroligins: Synapses look out of the nervous system. Cellular and Molecular Life Sciences, 68, 2655–2666. - PMC - PubMed
    1. Bowman, K., Atkins, J. L., Delgado, J., Kos, K., Kuchel, G. A., Ble, A., Ferrucci, L., & Melzer, D. (2017). Central adiposity and the overweight risk paradox in aging: follow‐up of 130,473 UK Biobank participants. American Journal of Clinical Nutrition, 106, 130–135. 10.3945/ajcn.116.147157. - DOI - PMC - PubMed
    1. Broad Institute of MIT and Harvard (2016). Broad Institute TCGA Genome Data Analysis Center. Correlation between mRNA expression and DNA methylation. Broad Institute of MIT and Harvard.
    1. Broad Institute RICOPILI : Rapid Imputation and COmputational PIpeLIne for Genome‐Wide Association Studies. Available at: https://sites.google.com/a/broadinstitute.org/ricopili/home.

Publication types