. 2021 Oct 4;218(10):e20210745.
doi: 10.1084/jem.20210745. Epub 2021 Aug 25.

Alveolar macrophages rely on GM-CSF from alveolar epithelial type 2 cells before and after birth

Affiliations

Alveolar macrophages rely on GM-CSF from alveolar epithelial type 2 cells before and after birth

Julia Gschwend et al. J Exp Med. .

Abstract

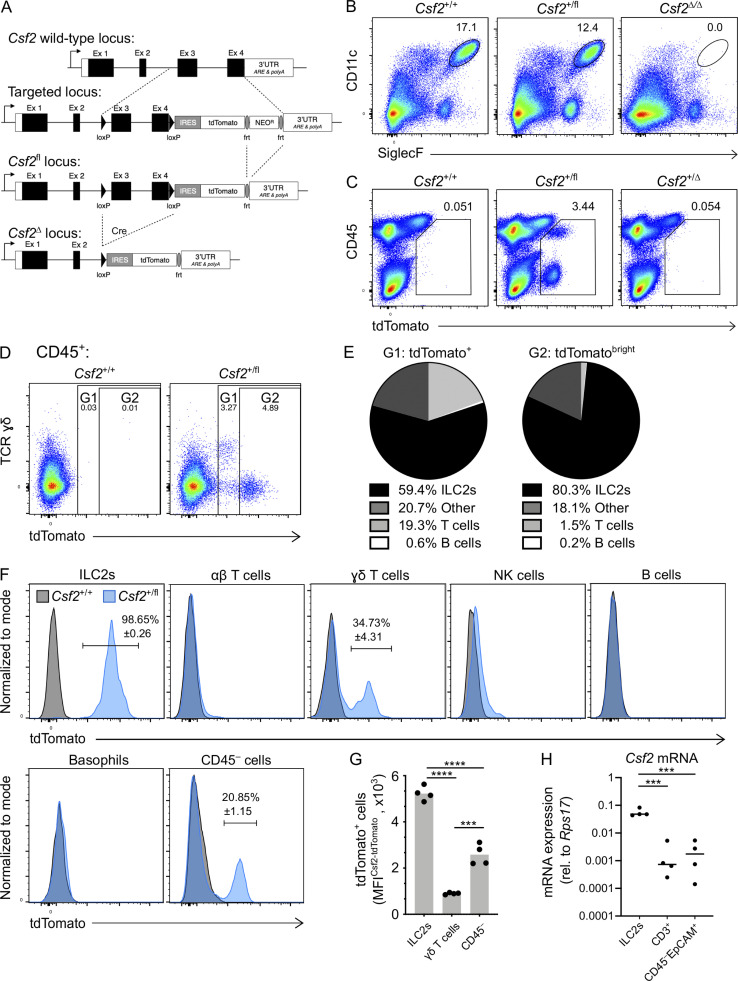
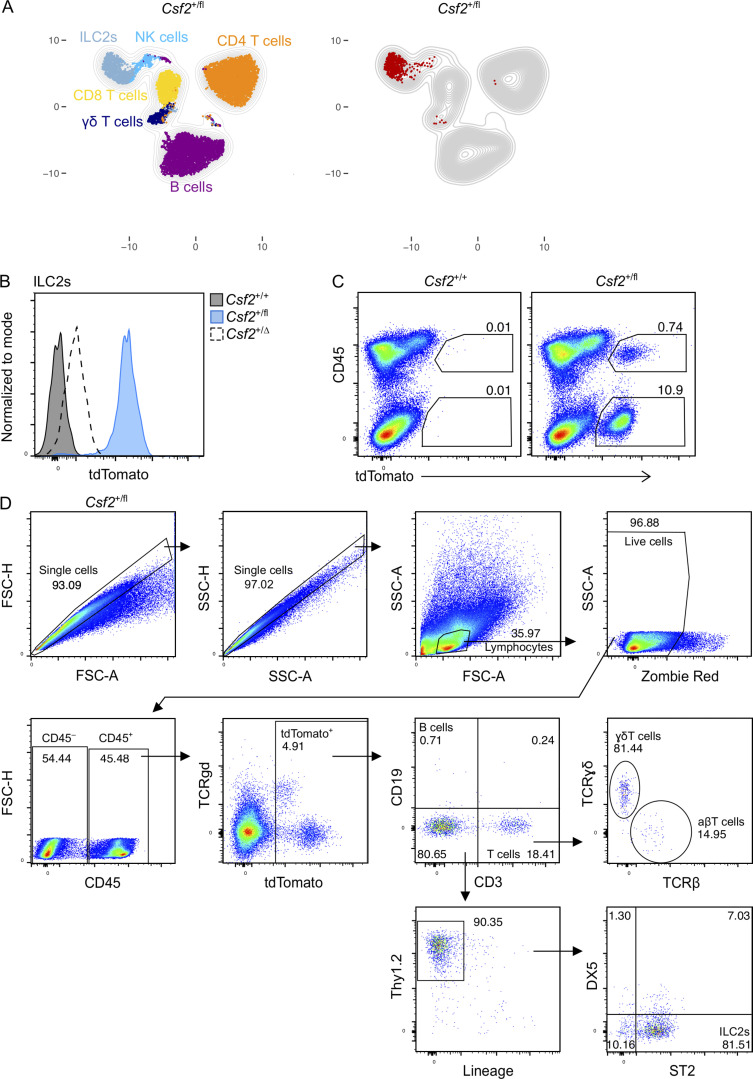
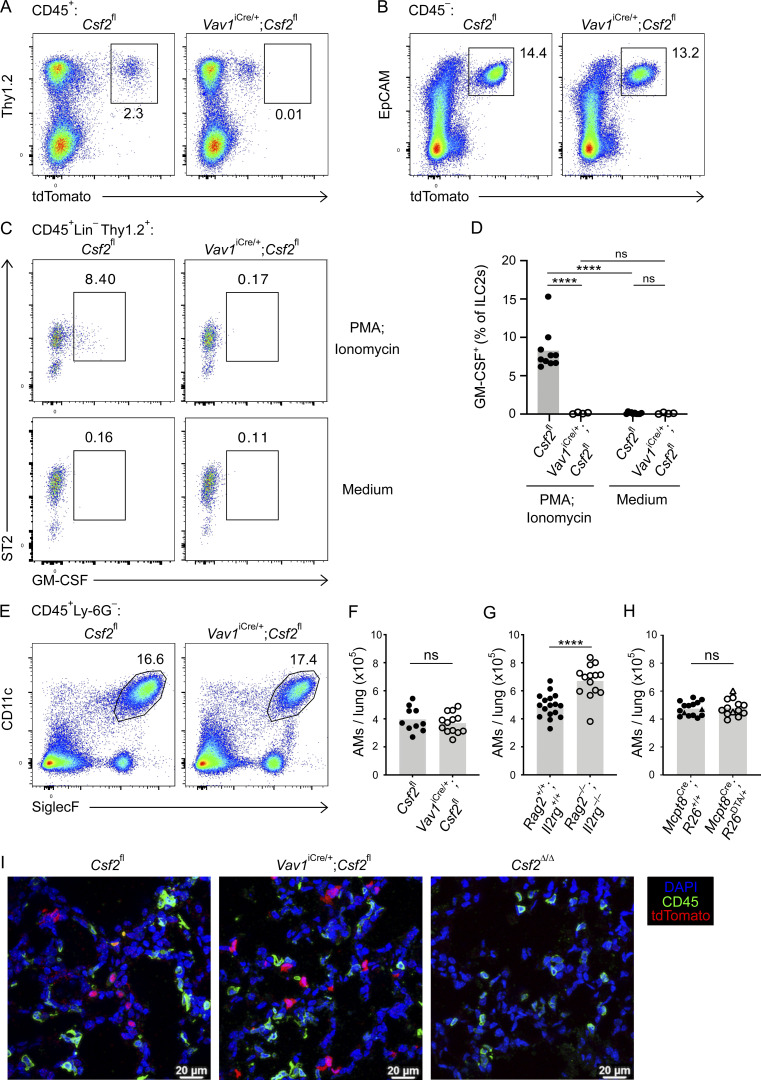
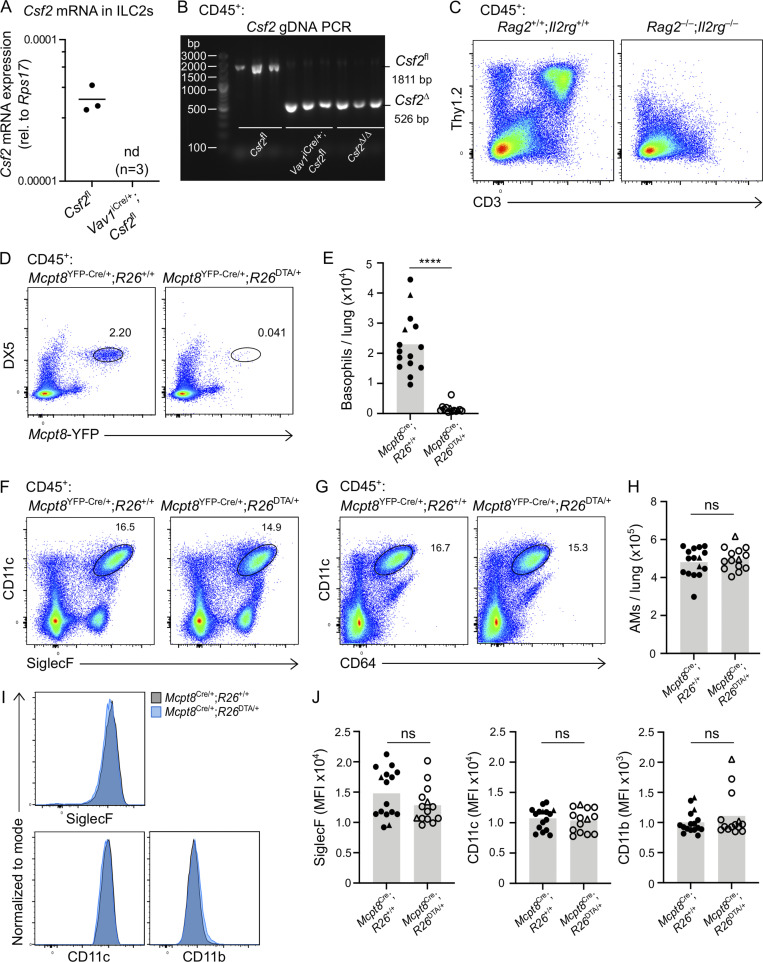
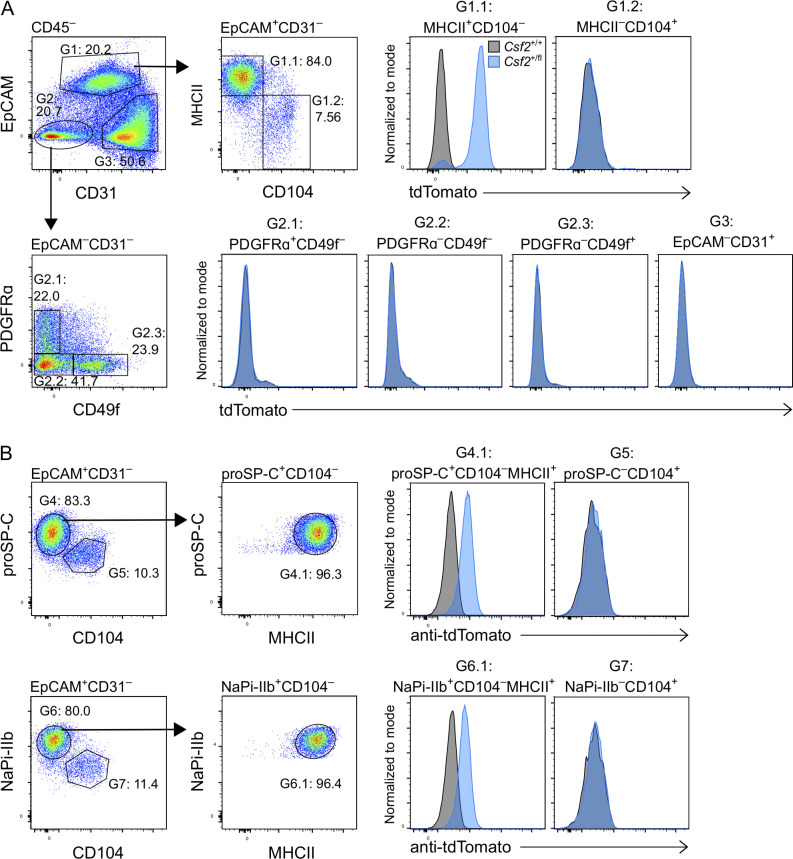
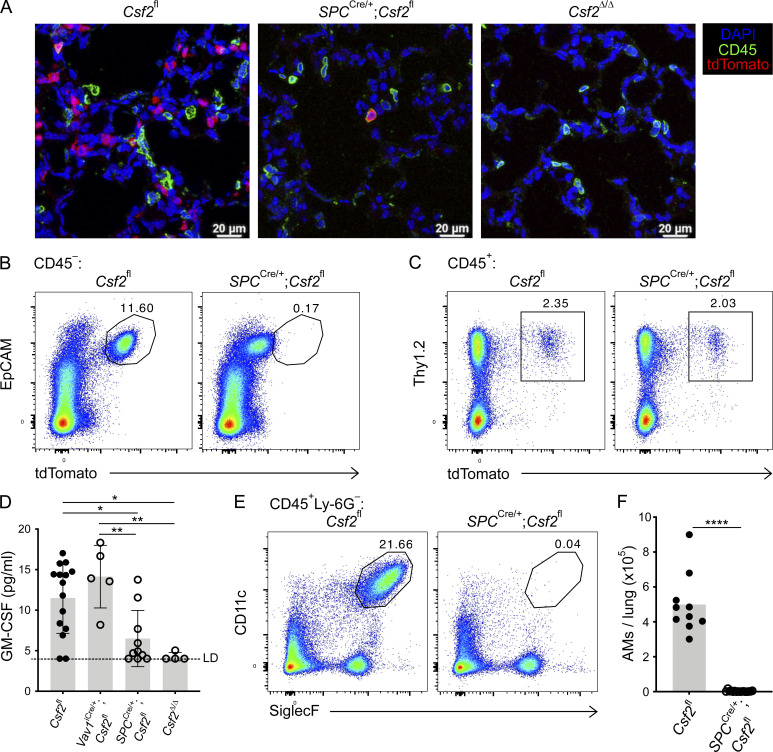
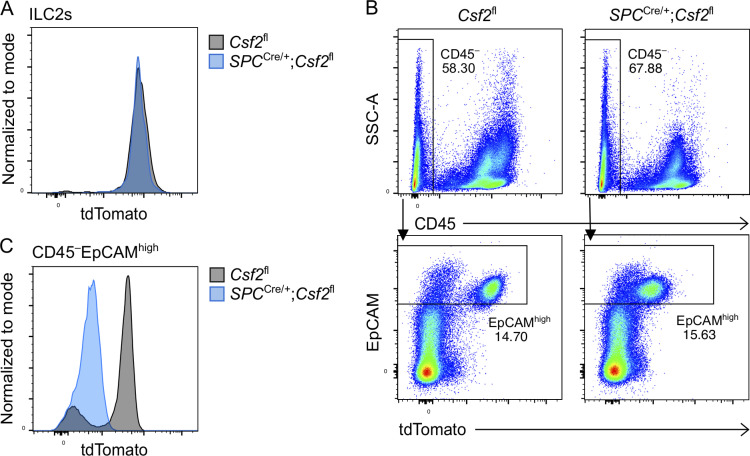
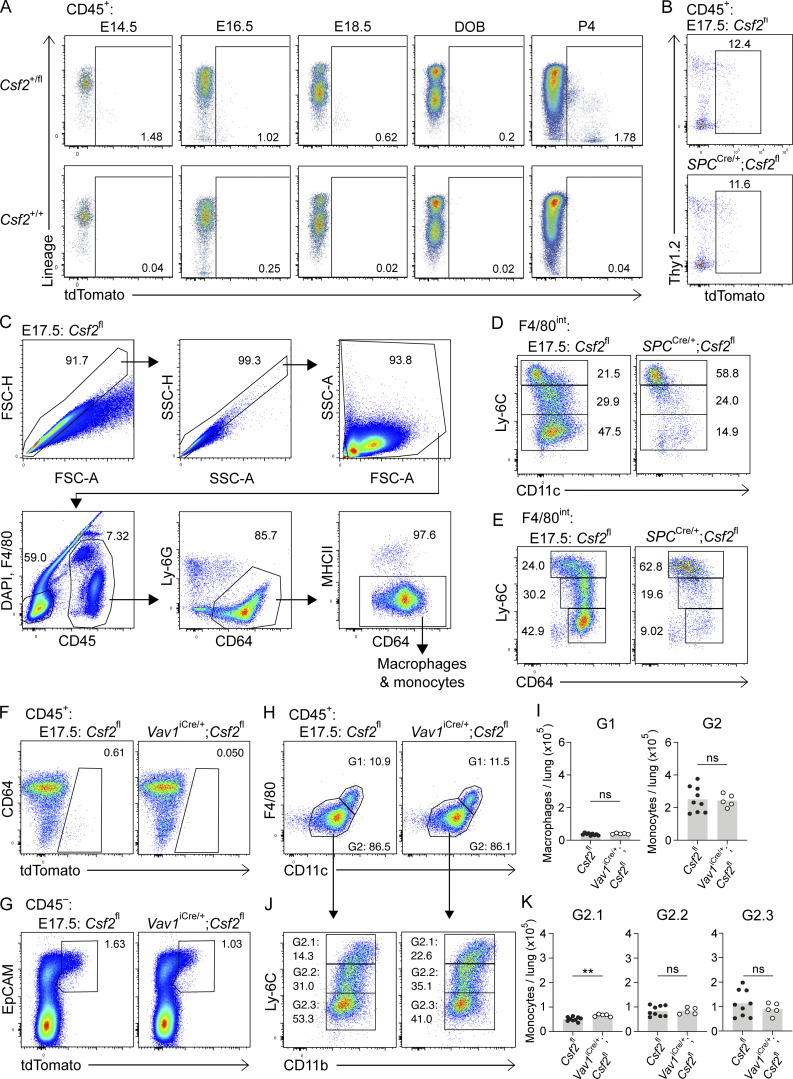
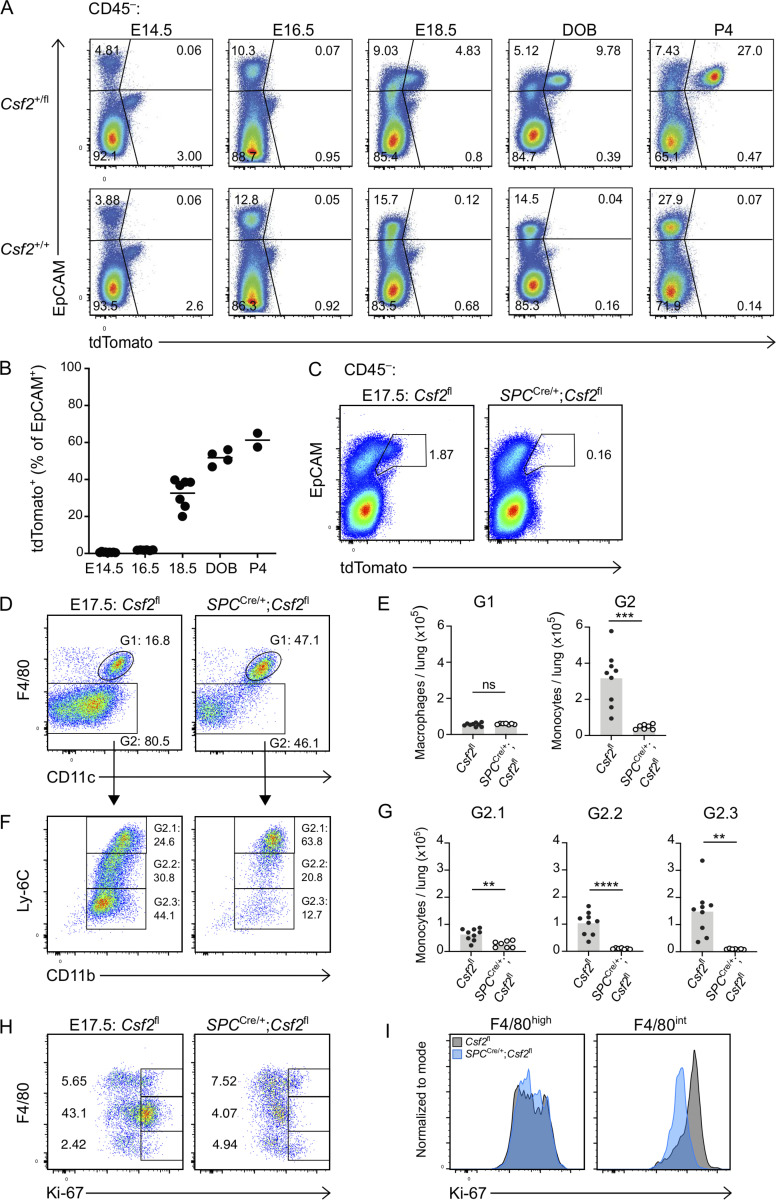
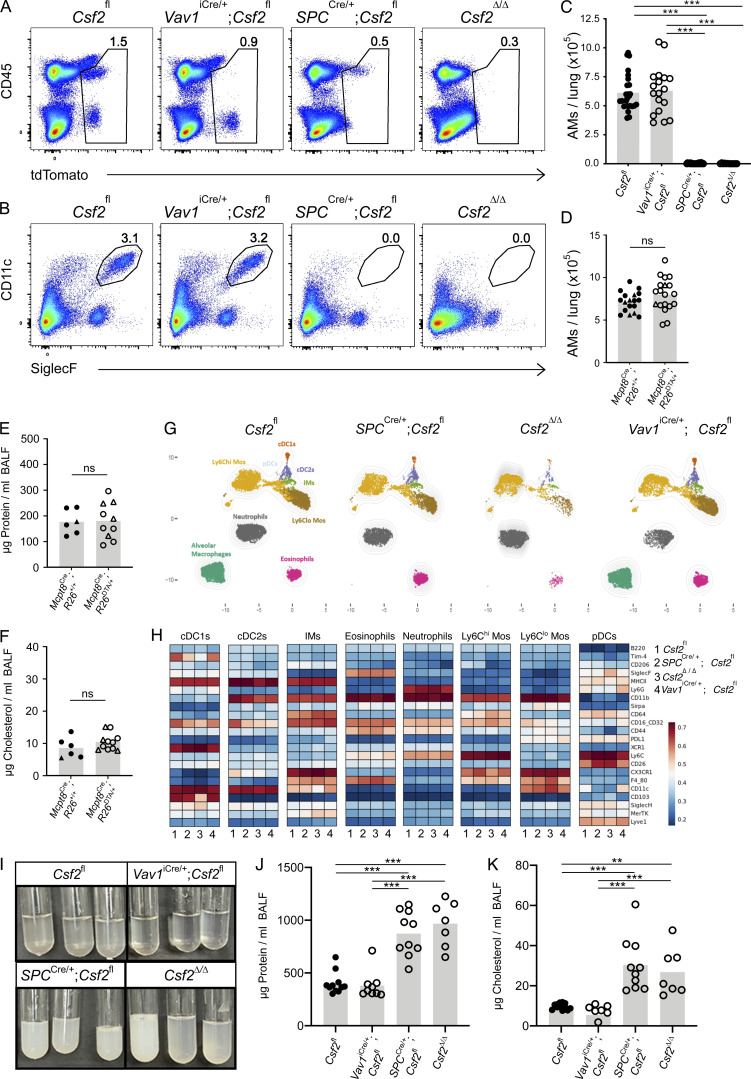
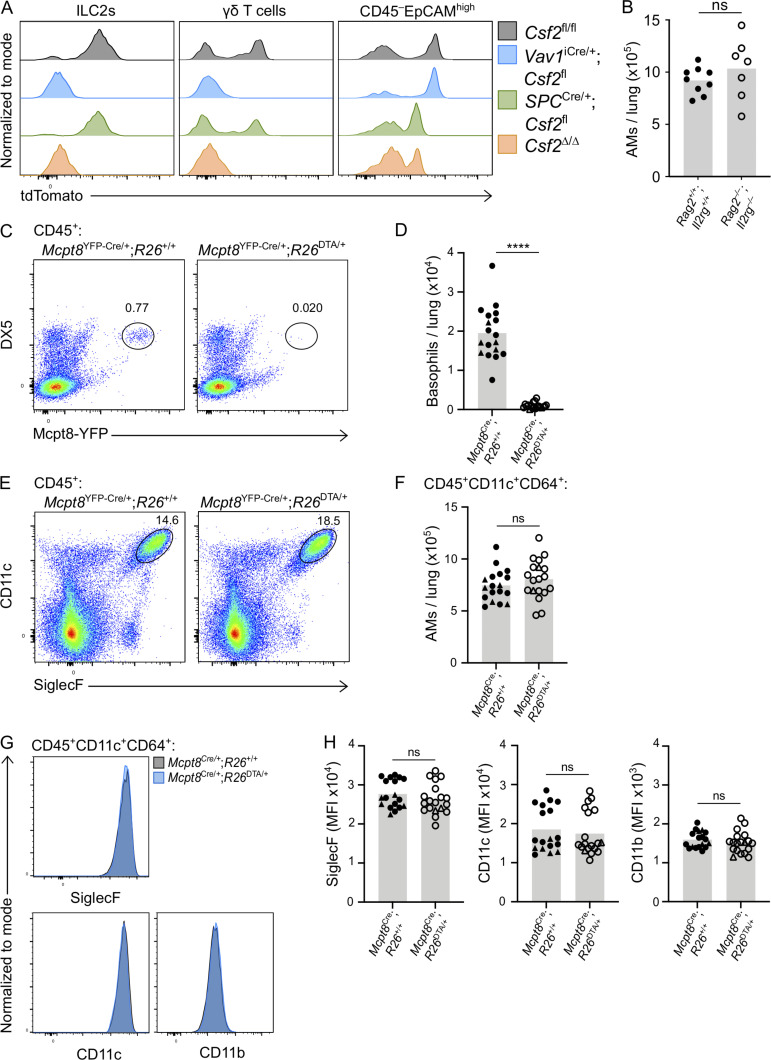
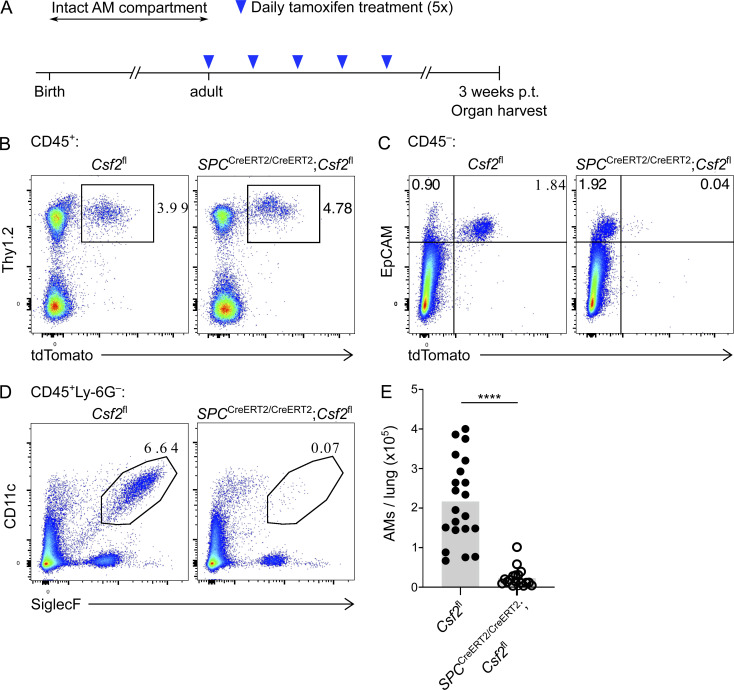
Programs defining tissue-resident macrophage identity depend on local environmental cues. For alveolar macrophages (AMs), these signals are provided by immune and nonimmune cells and include GM-CSF (CSF2). However, evidence to functionally link components of this intercellular cross talk remains scarce. We thus developed new transgenic mice to profile pulmonary GM-CSF expression, which we detected in both immune cells, including group 2 innate lymphoid cells and γδ T cells, as well as AT2s. AMs were unaffected by constitutive deletion of hematopoietic Csf2 and basophil depletion. Instead, AT2 lineage-specific constitutive and inducible Csf2 deletion revealed the nonredundant function of AT2-derived GM-CSF in instructing AM fate, establishing the postnatal AM compartment, and maintaining AMs in adult lungs. This AT2-AM relationship begins during embryogenesis, where nascent AT2s timely induce GM-CSF expression to support the proliferation and differentiation of fetal monocytes contemporaneously seeding the tissue, and persists into adulthood, when epithelial GM-CSF remains restricted to AT2s.


Conflict of interest statement

Disclosures: The authors declare no competing interests exist.

Figures

Figure 1.
Figure 1.
Different hematopoietic cell populations contribute to GM-CSF production in the neonatal lung. (A) Gene-targeting strategy used to engineer Csf2flox-tdTomato (Csf2fl) mice. (B) Flow cytometry analysis of CD11c+SiglecF+ AMs in the lungs of adult Csf2+/+, Csf2+/fl, and Csf2Δ/Δ mice, gated on CD45+ cells. (C) Flow cytometry analysis of tdTomato+ populations in the adult lungs of Csf2+/+, Csf2+/fl, and Csf2+/Δ mice. (D) Flow cytometry of tdTomato expression in Csf2+/+ and Csf2+/fl P10 lungs, gated on CD45+ cells. (E) Percentage contribution from different hematopoietic cells types to the tdTomato+ (left) or tdTomatobright compartment, as gated in D. (F) Expression of tdTomato in the indicated cell populations in lungs of P10 Csf2+/+ (gray) and Csf2+/fl (blue) mice was determined by flow cytometry analysis. Percentages (±SEM) of tdTomato+ cells are indicated. (G) MFI of tdTomato of Csf2+/fl ILC2s, γδ T cells, and CD45 cells in P10 lungs, gated on tdTomato+ cells as indicated in F. (H) Csf2 mRNA expression relative to Rps17 in the three major tdTomato+ cell populations isolated from P10 Csf2+/fl lungs. (B–H) Data are from one experiment representative of two (B and C), five (D-G), or three (H) independent experiments. (G and H) ***, P 0.0001–0.001; ****, P < 0.0001. IRES, internal ribosome entry site; MFI, mean fluorescence intensity; rel., relative; UTR, untranslated region.
Figure S1.
Figure S1.
The contribution of the hematopoietic compartment to GM-CSF production in the lung and the gating strategy for lymphocytes. (A) Representative UMAP showing the FlowSOM-guided meta-clustering of lymphoid populations in adult lungs of Csf2+/fl mice (left). tdTomato-expressing cells are identified in the corresponding UMAP (right). (B) Expression level of tdTomato in Thy1.2+ST2+ ILC2s from adult lungs of Csf2+/+ (gray), Csf2+/fl (blue), and Csf2+/∆ (dashed line) mice. (C) Flow cytometry analysis of tdTomato expression by CD45+ and CD45 cells in Csf2+/+ and Csf2+/fl P10 lungs. (D) Gating strategy used to identify lymphocytes in Fig. 1, E–G. Lin = CD11b, CD11c, NK1.1, F4/80, Gr-1, FcεRIα, Ter119. (A–D) Data are from one experiment, representative of four (A), two (B), or five (C and D) independent experiments.
Figure 2.
Figure 2.
Hematopoietic-derived GM-CSF is dispensable for the development of AMs in the neonatal lung. (A–F) Analysis of P10 lungs isolated from Csf2fl and Vav1iCre/+;Csf2fl mice. (A) Flow cytometry analysis of the Thy1.2+tdTomato+ population, gated on CD45+ cells. (B) Flow cytometry analysis of the EpCAM+ tdTomato+ population, gated on CD45 cells. (C) Flow cytometry analysis of GM-CSF production in ILC2s (CD45+LinThy1.2+ST2+) after restimulation with PMA/ionomycin (top row) or incubation with medium only (bottom row). (D) Percentage of GM-CSF+ ILC2s after restimulation or in the presence of medium only. (E) Flow cytometry analysis of CD11c+SiglecF+ AMs, gated on CD45+Ly-6G cells. (F) Quantification of AMs. (G) Quantification of AMs in P10 lungs of Rag2+/+;Il2rg+/+ and Rag2−/−;Il2rg−/− mice. (H) Quantification of AMs (CD45+SiglecF+CD11c+) in P10 lungs of Mcpt8YFP-Cre;R26+/+ and Mcpt8YFP-Cre;R26DTA/+ mice. Mcpt8YFP-Cre/+ mice are indicated by circles, while Mcpt8YFP-Cre/YFP-Cre mice are indicated by triangles. (I) Representative IF pictures of tdTomato+ cells (red) and CD45+ cells (green) in P10 lungs of Csf2fl, Vav1iCre/+;Csf2fl, and Csf2Δ/Δ mice (scale bars 20 µm). (A–C, E, and I) Data are from one experiment representative of at least two independent experiments. (D and F–H) Data are pooled from two (D), four (F), or three (G and H) independent experiments. ns, P ≥ 0.05; ****, P < 0.0001.
Figure S2.
Figure S2.
Validation for effective Cre-recombination in Vav1iCre and that lung hematopoietic GM-CSF contributions, including from lymphocytes and basophils, are dispensable for AM development in the neonatal lung. (A and B) Cells sorted from P10 lungs isolated from Csf2fl and Vav1iCre/+;Csf2fl mice. (A) Csf2 mRNA expression relative to Rps17 in ILC2s (CD45+LinThy1.2+ST2+). nd, not detected; rel., relative. (B) Gel depicting the Csf2 deletion PCR reaction for CD45+ lung cells. The products of the recombined (Csf2) and nonrecombined (Csf2fl) allele are indicated. (C) Flow cytometry analysis of P10 lungs of Rag2+/+;Il2rg+/+ and Rag2−/−;Il2rg−/− mice, gated on CD45+ cells. (D–J) Analysis of P10 lungs isolated from Mcpt8YFP-Cre;R26+/+ and Mcpt8YFP-Cre;R26DTA/+ mice. (E, H, and J) Mcpt8YFP-Cre/+ mice are indicated by circles, while Mcpt8YFP-Cre/YFP-Cre mice are indicated by triangles. (D) Flow cytometry analysis of DX5+Mcpt8-YFP+ basophils, gated on CD45+ cells. (E) Quantification of basophils. (F) Flow cytometry analysis of CD45+CD11c+SiglecF+ AMs. (G) Flow cytometry analysis of CD45+CD11c+CD64+ AMs. (H) Quantification of AMs, gated per G. (I) Expression levels of SiglecF, CD11c, and CD11b from AMs, gated per G. Mcpt8YFP-Cre/+;R26+/+ (gray) and Mcpt8YFP-Cre/+;R26DTA/+ (blue) mice. (J) MFI of SiglecF, CD11c, and CD11b for AMs, gated per G. (A–D, F, G, and I) Data are from one experiment (A and B) or one experiment representative of three independent experiments (C, D, F, G, and I). (E, H, and J) Data are pooled from three independent experiments. ns, P ≥ 0.05; ****, P < 0.0001. gDNA, genomic DNA; MFI, mean fluorescence intensity.
Figure 3.
Figure 3.
AT2s are the main nonhematopoietic source of GM-CSF in the neonatal lung. (A and B) Analysis of P10 lungs isolated from Csf2+/+ (gray) and Csf2+/fl (blue) mice. (A) Flow cytometry analysis of tdTomato expression in the CD45 compartment. Isolated populations include AT2s (G1.1: CD45CD31EpCAM+MHCII+CD104); airway epithelial cells (G1.2: CD45CD31EpCAM+MHCIICD104+); fibroblasts (G2.1: CD45CD31EpCAMPDGFRα+CD49f); CD45CD31EpCAMPDGFRαCD49f cells (G2.2); CD45CD31EpCAMPDGFRα CD49f+ cells (G2.3); and endothelial cells (G3: CD45CD31+EpCAM). (B) Flow cytometry analysis of tdTomato expression in the CD31EpCAM+ compartment of fixed lungs, gated on CD45 cells. Isolated populations include AT2s (G4.1: proSP-C+CD104MHCII+; G6.1: NaPi-IIb+CD104MHCII+), and airway epithelial cells (G5: proSP-CCD104+; G7: NaPi-IIbCD104+). (A and B) Data are from one experiment representative of two independent experiments.
Figure 4.
Figure 4.
AT2-derived GM-CSF is necessary for the development of AMs in the neonatal lung. (A) Representative IF pictures of tdTomato+ cells (red) and CD45+ cells (green) in P10 lungs of Csf2fl, SPCCre/+;Csf2fl, and Csf2Δ/Δ mice (scale bars, 20 µm). (B, C, E, and F) Analysis of P10 lungs isolated from Csf2fl and SPCCre/+;Csf2fl mice. (B) Flow cytometry analysis of the EpCAM+tdTomato+ population, gated on CD45 cells. (C) Flow cytometry analysis of the Thy1.2+tdTomato+ population, gated on CD45+ cells. (D) Total GM-CSF quantification in lung conditioned media from P10 Csf2fl, Vav1iCre/+;Csf2fl, SPCCre/+;Csf2fl, and Csf2Δ/Δ mice, ±SD. LD, limit of detection. (E) Flow cytometry analysis of CD11c+SiglecF+ AMs, gated on live CD45+Ly-6G cells. (F) Quantification of AMs. (A–E) Data are from one experiment representative of two (A and D) or four (B, C, and E) independent experiments. (F) Data are pooled from two independent experiments representative of four independent experiments. (D and F) *, P 0.01–0.05; **, P 0.01–0.001; ****, P < 0.0001.
Figure S3.
Figure S3.
EpCAM+ epithelial cells do not contribute to GM-CSF production in neonatal SPCCre lungs. (A–C) Analysis of P10 lungs isolated from Csf2fl (gray) and SPCCre/+;Csf2fl (blue) mice. (A) Expression level of tdTomato in Thy1.2+ST2+ ILC2s. (B) Gating strategy used to identify CD45EpCAM+ cells. (C) Expression level of tdTomato in CD45EpCAMhigh epithelial cells. (A–C) Data are from one experiment, representative of five independent experiments.
Figure S4.
Figure S4.
Hematopoietic-derived GM-CSF is not critical for AM fate specification during embryogenesis. (A) Flow cytometry analysis of kinetics of tdTomato expression in perinatal lungs in Csf2+/fl and Csf2+/+ mice ranging from E14.5 to P4, gated on CD45+ cells. DOB, day of birth. (B–E) Analysis of E17.5 lungs isolated from Csf2fl and SPCCre/+;Csf2fl mice. (B) Flow cytometry analysis of tdTomato+ population, gated on CD45+ cells. (C) Gating strategy used to identify fetal macrophage and monocyte populations. (D) Flow cytometry analysis of Ly-6C and CD11c levels in the developing fetal monocyte population (G2 in Fig. 5 D). (E) Flow cytometry analysis of Ly-6C and CD64 levels in the developing fetal monocytes population (G2 in Fig. 5 D). (F–J) Analysis of E17.5 lungs isolated from Csf2fl and Vav1iCre/+;Csf2fl mice. (F) Flow cytometry analysis of the tdTomato+ population, gated on CD45+ cells. (G) Flow cytometry analysis of the EpCAM+tdTomato+ population, gated on CD45 cells. (H) Flow cytometry analysis of F4/80high primitive macrophages (G1) and F4/80int fetal monocytes (G2), gated on CD45+Ly-6GCD64+MHCII cells. (I) Quantification of primitive macrophages (G1) and fetal monocytes (G2). (J) Flow cytometry analysis of Ly-6C and CD11b levels in the developing fetal monocytes population (G2). (K) Quantification of Ly-6Chigh (G2.1), Ly-6Cint (G2.2), and Ly-6Clow (G2.3) fetal monocytes. (A) Data are representative of at least two independent experiments per time point. (B–H and J) Data are from one experiment representative of three (B–E) or two (F–H and J) independent experiments. (I and K) Data are pooled from two independent experiments. ns, P ≥ 0.05; **, P 0.01–0.001.
Figure 5.
Figure 5.
Timed induction of Csf2 expression in nascent AT2s instructs AM differentiation in fetal lung monocytes. (A) Flow cytometry analysis of kinetics of tdTomato expression in perinatal lungs in Csf2+/fl and Csf2+/+ mice ranging from E14.5 to P4, gated on CD45 cells. DOB, day of birth. (B) Percentage of EpCAM+tdTomato+ cells for time points represented in A. (C–I) Analysis of E17.5 lungs isolated from Csf2fl and SPCCre/+;Csf2fl mice. (C) Flow cytometry analysis of EpCAM+tdTomato+ populations, gated on CD45 cells. (D) Flow cytometry analysis of primitive macrophages (G1; F4/80high) and fetal monocytes (G2; F4/80int), gated on CD45+Ly-6GCD64+MHCII cells. (E) Quantification of primitive macrophages (G1) and fetal monocytes (G2). (F) Further flow cytometry analysis of Ly-6C and CD11b levels in the developing fetal monocytes population (G2). (G) Quantification of Ly-6Chigh (G2.1), Ly-6Cint (G2.2), and Ly-6Clow (G2.3) fetal monocytes. (H) Flow cytometry analysis of Ki-67 expression, gated on CD45+ cells. (I) Ki67 expression levels in primitive macrophages (F4/80high) and fetal monocytes (F4/80int) for Csf2fl (gray) and SPCCre/+;Csf2fl (blue) mice. (A and B) Data representative of at least two independent experiments per time point. (B, E, and G) Data are pooled from at least two (B) or three (E and G) independent experiments. (C, D, F, H, and I) Data are from one experiment, representative of three (C, D, and F) or two (H and I) independent experiments. (E and G) ns, P ≥ 0.05; **, P 0.01–0.001; ***, P 0.0001–0.001; ****, P < 0.0001.
Figure 6.
Figure 6.
AT2-specific deletion of Csf2 leads to AM depletion in adult lungs. (A–C, G, and H) Analysis of adult lungs isolated from Csf2fl, Vav1iCre/+;Csf2fl, SPCCre/+;Csf2fl, and Csf2Δ/Δ mice. (A) Flow cytometry analysis of tdTomato+ populations. (B) Flow cytometry analysis of CD11c+SiglecF+ AMs, gated on live CD45+Ly-6G cells. (C) Quantification of AMs. (D) Quantification of AMs (CD45+SiglecF+CD11c+) in adult lungs of Mcpt8YFP-Cre;R26+/+ and Mcpt8YFP-Cre;R26DTA/+ mice. Mcpt8YFP-Cre/+ mice are indicated by circles, while Mcpt8YFP-Cre/YFP-Cre mice are indicated by triangles. (E) Quantification of protein in BALF from mice as in D. (F) Quantification of total cholesterol in BALF from mice as in D. (G) A representative UMAP map showing the FlowSOM-guided meta-clustering of the myeloid compartment. Mos, monocytes; IMs, interstitial macrophages; cDC, conventional DC; and pDC, plasmacytoid DC. (H) Heatmap displaying the median antigen intensity of markers used to generate G. (I) BALF from adult Csf2fl, Vav1iCre/+;Csf2fl, SPCCre/+;Csf2fl, and Csf2Δ/Δ mice. (J) Quantification of protein in BALF as in I. (K) Quantification of total cholesterol in BALF as in I. (A, B, and G–I) Data are from one experiment representative of four (A, B) or two (G–I) independent experiments. (C–F, J, and K) Data are pooled from four (C), three (D), or two (E, F, J, and K) independent experiments. ns, P ≥ 0.05; **, P 0.01–0.001; ***, P 0.0001–0.001.
Figure S5.
Figure S5.
Lung hematopoietic GM-CSF contributions, including from lymphocytes and basophils, are dispensable for AM survival in the adult lung. (A) tdTomato signal from Thy1.2+ST2+ ILC2s, CD3+TCRγδ+ γδ T cells, and CD45EpCAMhigh cells in adult lungs of Csf2fl/fl (gray), Vav1iCre/+;Csf2fl (blue), SPCCre/+;Csf2fl (green), and Csf2∆/∆ (orange) mice. (B) AM quantification from adult lungs of Rag2+/+;Il2rg+/+ and Rag2−/−;Il2rg−/− mice. (C–H) Analysis of adult lungs isolated from Mcpt8YFP-Cre;R26+/+ and Mcpt8YFP-Cre;R26DTA/+ mice. (D, F, and H) Mcpt8YFP-Cre/+ mice are indicated by circles, while Mcpt8YFP-Cre/YFP-Cre mice are indicated by triangles. (C) Flow cytometry analysis of DX5+Mcpt8-YFP+ basophils, gated on CD45+ cells. (D) Quantification of basophils. (E) Flow cytometry analysis of CD45+CD11c+SiglecF+ AMs. (F) Quantification of CD45+CD11c+CD64+ AMs. (G) Expression levels of SiglecF, CD11c, and CD11b by CD45+CD11c+CD64+ AMs. Mcpt8YFP-Cre/+;R26+/+ (gray) and Mcpt8YFP-Cre/+;R26DTA/+ (blue) mice. (H) MFI of SiglecF, CD11c, and CD11b for CD45+CD11c+CD64+ AMs. (A, C, E, and G) Data are from one experiment representative of four (A) or three (C, E, and G) independent experiments. (B, D, F, and H) Data are pooled from two (B) or three (D, F, and H) independent experiments. ns, P ≥ 0.05; ****, P < 0.0001. MFI, mean fluorescence intensity.
Figure 7.
Figure 7.
Inducible AT2-specific ablation of Csf2 expression in adult lungs results in AM population atrophy. (A) Timeline of tamoxifen treatment and organ harvest. p.t., post-treatment. (B–E) Analysis of adult lungs isolated from Csf2fl and SPCCreERT2/CreERT2;Csf2fl mice 3 wk after tamoxifen treatment as in A. (B) Flow cytometry analysis of the Thy1.2+tdTomato+ population, gated on CD45+ cells. (C) Flow cytometry analysis of the EpCAM+tdTomato+ population, gated on CD45 cells. (D) Flow cytometry analysis of CD11c+SiglecF+ AMs, gated on live CD45+Ly-6G cells. (E) Quantification of AMs. (B–D) Data are from one experiment representative of three independent experiments. (E) Data are pooled from three experiments. ****, P < 0.0001.

Comment in

References

    1. Balleza, E., Kim J.M., and Cluzel P.. 2018. Systematic characterization of maturation time of fluorescent proteins in living cells. Nat. Methods. 15:47–51. 10.1038/nmeth.4509 - DOI - PMC - PubMed
    1. Basil, M.C., Katzen J., Engler A.E., Guo M., Herriges M.J., Kathiriya J.J., Windmueller R., Ysasi A.B., Zacharias W.J., Chapman H.A., et al. . 2020. The Cellular and Physiological Basis for Lung Repair and Regeneration: Past, Present, and Future. Cell Stem Cell. 26:482–502. 10.1016/j.stem.2020.03.009 - DOI - PMC - PubMed
    1. Becher, B., Tugues S., and Greter M.. 2016. GM-CSF: From Growth Factor to Central Mediator of Tissue Inflammation. Immunity. 45:963–973. 10.1016/j.immuni.2016.10.026 - DOI - PubMed
    1. Behrens, F., Tak P.P., Østergaard M., Stoilov R., Wiland P., Huizinga T.W., Berenfus V.Y., Vladeva S., Rech J., Rubbert-Roth A., et al. . 2015. MOR103, a human monoclonal antibody to granulocyte-macrophage colony-stimulating factor, in the treatment of patients with moderate rheumatoid arthritis: results of a phase Ib/IIa randomised, double-blind, placebo-controlled, dose-escalation trial. Ann. Rheum. Dis. 74:1058–1064. 10.1136/annrheumdis-2013-204816 - DOI - PMC - PubMed
    1. Blériot, C., Chakarov S., and Ginhoux F.. 2020. Determinants of Resident Tissue Macrophage Identity and Function. Immunity. 52:957–970. 10.1016/j.immuni.2020.05.014 - DOI - PubMed

Publication types

MeSH terms

Substances